
2: Data
- Page ID
- 5545

\( \newcommand{\vecs}[1]{\overset { \scriptstyle \rightharpoonup} {\mathbf{#1}} } \)
\( \newcommand{\vecd}[1]{\overset{-\!-\!\rightharpoonup}{\vphantom{a}\smash {#1}}} \)
\( \newcommand{\dsum}{\displaystyle\sum\limits} \)
\( \newcommand{\dint}{\displaystyle\int\limits} \)
\( \newcommand{\dlim}{\displaystyle\lim\limits} \)
\( \newcommand{\id}{\mathrm{id}}\) \( \newcommand{\Span}{\mathrm{span}}\)
( \newcommand{\kernel}{\mathrm{null}\,}\) \( \newcommand{\range}{\mathrm{range}\,}\)
\( \newcommand{\RealPart}{\mathrm{Re}}\) \( \newcommand{\ImaginaryPart}{\mathrm{Im}}\)
\( \newcommand{\Argument}{\mathrm{Arg}}\) \( \newcommand{\norm}[1]{\| #1 \|}\)
\( \newcommand{\inner}[2]{\langle #1, #2 \rangle}\)
\( \newcommand{\Span}{\mathrm{span}}\)
\( \newcommand{\id}{\mathrm{id}}\)
\( \newcommand{\Span}{\mathrm{span}}\)
\( \newcommand{\kernel}{\mathrm{null}\,}\)
\( \newcommand{\range}{\mathrm{range}\,}\)
\( \newcommand{\RealPart}{\mathrm{Re}}\)
\( \newcommand{\ImaginaryPart}{\mathrm{Im}}\)
\( \newcommand{\Argument}{\mathrm{Arg}}\)
\( \newcommand{\norm}[1]{\| #1 \|}\)
\( \newcommand{\inner}[2]{\langle #1, #2 \rangle}\)
\( \newcommand{\Span}{\mathrm{span}}\) \( \newcommand{\AA}{\unicode[.8,0]{x212B}}\)
\( \newcommand{\vectorA}[1]{\vec{#1}} % arrow\)
\( \newcommand{\vectorAt}[1]{\vec{\text{#1}}} % arrow\)
\( \newcommand{\vectorB}[1]{\overset { \scriptstyle \rightharpoonup} {\mathbf{#1}} } \)
\( \newcommand{\vectorC}[1]{\textbf{#1}} \)
\( \newcommand{\vectorD}[1]{\overrightarrow{#1}} \)
\( \newcommand{\vectorDt}[1]{\overrightarrow{\text{#1}}} \)
\( \newcommand{\vectE}[1]{\overset{-\!-\!\rightharpoonup}{\vphantom{a}\smash{\mathbf {#1}}}} \)
\( \newcommand{\vecs}[1]{\overset { \scriptstyle \rightharpoonup} {\mathbf{#1}} } \)
\(\newcommand{\longvect}{\overrightarrow}\)
\( \newcommand{\vecd}[1]{\overset{-\!-\!\rightharpoonup}{\vphantom{a}\smash {#1}}} \)
\(\newcommand{\avec}{\mathbf a}\) \(\newcommand{\bvec}{\mathbf b}\) \(\newcommand{\cvec}{\mathbf c}\) \(\newcommand{\dvec}{\mathbf d}\) \(\newcommand{\dtil}{\widetilde{\mathbf d}}\) \(\newcommand{\evec}{\mathbf e}\) \(\newcommand{\fvec}{\mathbf f}\) \(\newcommand{\nvec}{\mathbf n}\) \(\newcommand{\pvec}{\mathbf p}\) \(\newcommand{\qvec}{\mathbf q}\) \(\newcommand{\svec}{\mathbf s}\) \(\newcommand{\tvec}{\mathbf t}\) \(\newcommand{\uvec}{\mathbf u}\) \(\newcommand{\vvec}{\mathbf v}\) \(\newcommand{\wvec}{\mathbf w}\) \(\newcommand{\xvec}{\mathbf x}\) \(\newcommand{\yvec}{\mathbf y}\) \(\newcommand{\zvec}{\mathbf z}\) \(\newcommand{\rvec}{\mathbf r}\) \(\newcommand{\mvec}{\mathbf m}\) \(\newcommand{\zerovec}{\mathbf 0}\) \(\newcommand{\onevec}{\mathbf 1}\) \(\newcommand{\real}{\mathbb R}\) \(\newcommand{\twovec}[2]{\left[\begin{array}{r}#1 \\ #2 \end{array}\right]}\) \(\newcommand{\ctwovec}[2]{\left[\begin{array}{c}#1 \\ #2 \end{array}\right]}\) \(\newcommand{\threevec}[3]{\left[\begin{array}{r}#1 \\ #2 \\ #3 \end{array}\right]}\) \(\newcommand{\cthreevec}[3]{\left[\begin{array}{c}#1 \\ #2 \\ #3 \end{array}\right]}\) \(\newcommand{\fourvec}[4]{\left[\begin{array}{r}#1 \\ #2 \\ #3 \\ #4 \end{array}\right]}\) \(\newcommand{\cfourvec}[4]{\left[\begin{array}{c}#1 \\ #2 \\ #3 \\ #4 \end{array}\right]}\) \(\newcommand{\fivevec}[5]{\left[\begin{array}{r}#1 \\ #2 \\ #3 \\ #4 \\ #5 \\ \end{array}\right]}\) \(\newcommand{\cfivevec}[5]{\left[\begin{array}{c}#1 \\ #2 \\ #3 \\ #4 \\ #5 \\ \end{array}\right]}\) \(\newcommand{\mattwo}[4]{\left[\begin{array}{rr}#1 \amp #2 \\ #3 \amp #4 \\ \end{array}\right]}\) \(\newcommand{\laspan}[1]{\text{Span}\{#1\}}\) \(\newcommand{\bcal}{\cal B}\) \(\newcommand{\ccal}{\cal C}\) \(\newcommand{\scal}{\cal S}\) \(\newcommand{\wcal}{\cal W}\) \(\newcommand{\ecal}{\cal E}\) \(\newcommand{\coords}[2]{\left\{#1\right\}_{#2}}\) \(\newcommand{\gray}[1]{\color{gray}{#1}}\) \(\newcommand{\lgray}[1]{\color{lightgray}{#1}}\) \(\newcommand{\rank}{\operatorname{rank}}\) \(\newcommand{\row}{\text{Row}}\) \(\newcommand{\col}{\text{Col}}\) \(\renewcommand{\row}{\text{Row}}\) \(\newcommand{\nul}{\text{Nul}}\) \(\newcommand{\var}{\text{Var}}\) \(\newcommand{\corr}{\text{corr}}\) \(\newcommand{\len}[1]{\left|#1\right|}\) \(\newcommand{\bbar}{\overline{\bvec}}\) \(\newcommand{\bhat}{\widehat{\bvec}}\) \(\newcommand{\bperp}{\bvec^\perp}\) \(\newcommand{\xhat}{\widehat{\xvec}}\) \(\newcommand{\vhat}{\widehat{\vvec}}\) \(\newcommand{\uhat}{\widehat{\uvec}}\) \(\newcommand{\what}{\widehat{\wvec}}\) \(\newcommand{\Sighat}{\widehat{\Sigma}}\) \(\newcommand{\lt}{<}\) \(\newcommand{\gt}{>}\) \(\newcommand{\amp}{&}\) \(\definecolor{fillinmathshade}{gray}{0.9}\)When admiring a well-designed map, it is easy to forget that it is made from data that came from somewhere. An individual or group of people has asked one or more questions, gathered data in response, and processed the raw numbers before putting it all on the map. These data are necessarily just a small portion of what can be measured, because it is impossible to measure all characteristics for all places for all times. Instead, we focus on how and why data were collected for what, where, and when.
This chapter will introduce you to:
- Elements and common types of spatial data.
- Metadata, or data about data.
- How data in the US census – a survey that underlies many of the examples and activities in this book – are collected and aggregated.
Resolution, accuracy, and interoperability – important concepts that are part of metadata and are important to keep in mind when choosing appropriate data for a project.
By the end of this chapter, you should be able to ask thoughtful questions about the data used in mapping.
2.1 What are Spatial Data?
Map data have three key characteristics:
- Spatial – where an object is located or an event has occurred
- Temporal – when the location and attributes were accurate (i.e. when collected)
- Attribute – what characteristics the object or event has
Imagine we have data about US states. Spatial characteristics of data, namely location of state boundaries, are necessary to put the data on a map or use. More broadly, spatial information can take the form of street address, latitude-longitude coordinates, or the area in which data was collected (e.g., residential block, city, state, country). Temporal characteristics refer to how data represent a “snapshot” of what things were like at the time the data were collected, such as census data from the year 2000. Finally, attribute characteristics describe the nature of a location. In the case of the states, we could be concerned with population or income or any of hundreds of other characteristics.
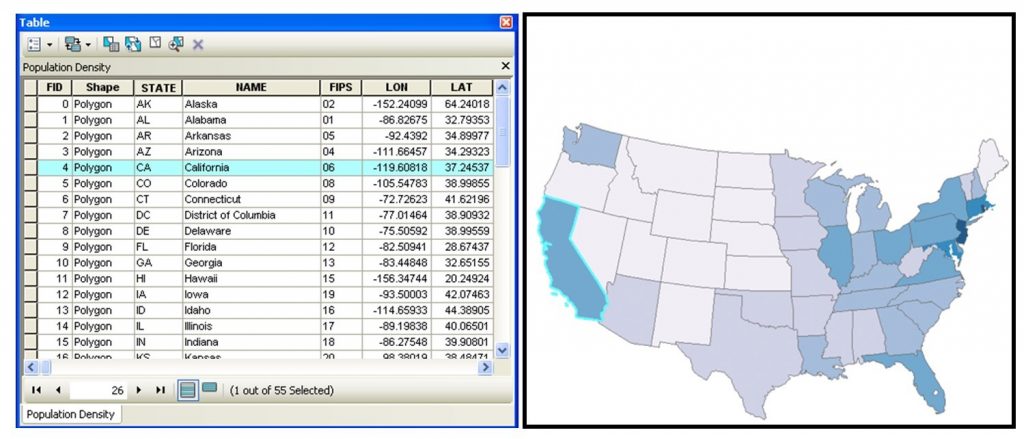
Data table and map. This attribute table and linked map show state boundaries with data from the U.S. Census Bureau on population density. The table and map represent two key elements of spatial data: location and attributes. A third important piece, not shown, is the time at which these data were collected. [1]
2.2 Collecting Spatial Data
Two main methods of spatial data collection, or gathering information about places, are ground surveying and remote sensing. Ground surveying involves a person or mechanism observes or interacts with people or the environment in a particular place. Remote sensing refers to collecting data from afar, often by taking pictures from a plane or satellite.
2.2.1 Ground Surveying
Ground surveying is conducted through an individual or mechanism interacting with a particular place.. This can include a person collecting locational data with a handset that works with a global positioning system (GPS), a constellation of satellites that beam signals to earth where they can be used to determine position. Surveys involve talking to people or traveling to different locations to gather information. Another kind of ground surveying occurs at weather stations that measure temperature and other climatological information at a given location. This is similar to a process called geocoding, where data with a locational element such as an address or zip code, are matched to their respective ground coordinates that are known already.
Land surveying is one of the longest-standing methods of determining location. In essence, land surveyors use a variety of tools to determine the precise positions of locations by triangulating from the position of known locations, or in other words, using mathematics of angles and distances to find locations. Surveying has existed for thousands of years, probably originating as a way to determine the boundaries of land and help construct large buildings. From the 1800s onward, land surveyors helped map out many countries, working outward from known to unknown locations.
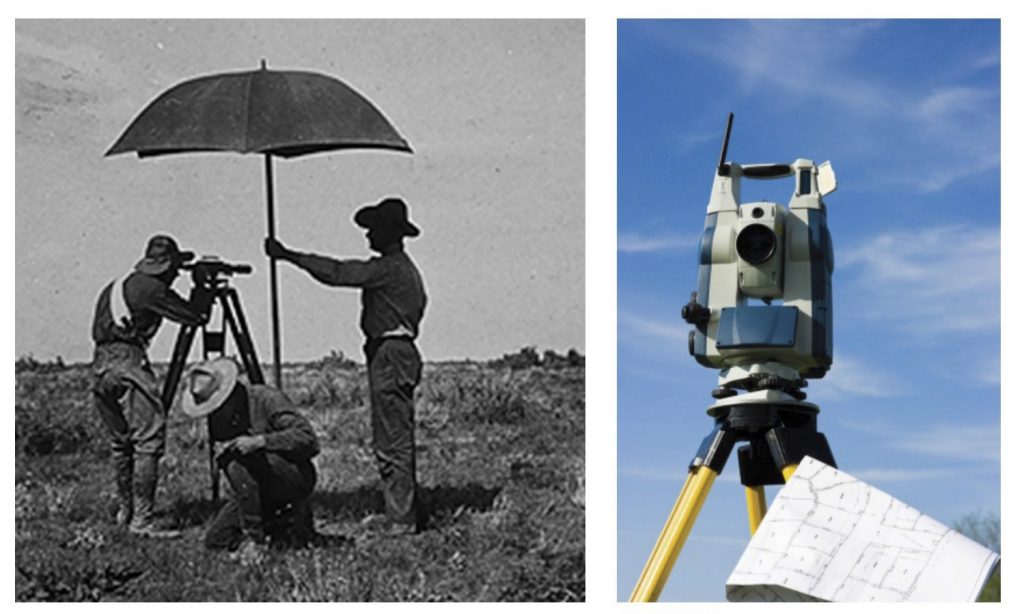
Land surveying. The foundation for modern mapping was laid by people walking and measuring the land with specialized telescopes (left) and modern GPS enabled total stations (right). [2][3]
Global positioning systems (GPS) are constellations of satellites that orbit the earth. These satellites transmit signals to the earth’s surface that indicate their position in space and a very precise time signal. A device equipped with an appropriate GPS receiver can interpret these signals and determine the device’s location on the earth. We consider using a GPS unit to find location a form of ground surveying because the satellites themselves do not collect information; it is the handset or GPS unit that is determining position from the satellite signals.
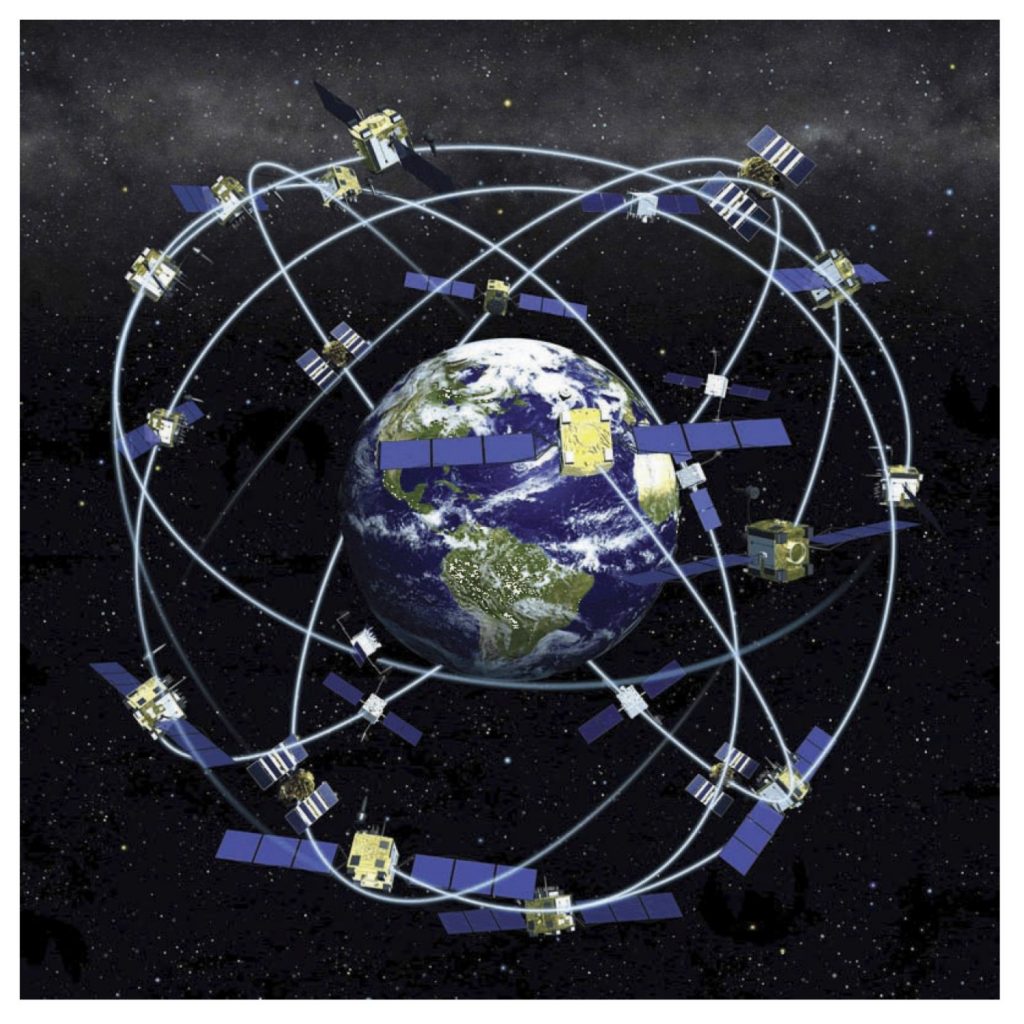
GPS constellation. The Global Positioning System is a system, or constellation, of satellites orbiting the earth that allow handsets to establish location. [4]
For decades, locating objects accurately with GPS units required expensive equipment and specialized training. It was undertaken primarily by the military, scientists, and government organizations. With technological developments making computer chips smaller and faster, GPS receivers are now standard in mobile phones. It is possible for any person to record, or tag, the location where a picture was taken or track daily movements without special expertise. This ease of use substantially expands who is able to create spatial data and the amount of spatial data that exists and must be stored.
GPS have their drawbacks. Since handsets must receive signals from satellites orbiting the earth, these signals can be blocked by solid objects, such as trees, buildings, or landscape features such as the sides of tunnels or ravines. Getting a strong signal in a moderately forested area can be difficult, as can getting one in a city with tall buildings. There are a limited number of satellites orbiting the earth, and there are times when the handset is in a non-optimal position relative to these satellites. A GPS handset should receive signals from at least four satellites, and ideally more, that are spread out evenly in the sky, but there are times when these sources are bunched up relative to the handset position and the coordinates it provides will be inaccurate. Finally, depending on the quality of the handset, GPS coordinates can also be inaccurate when the handset is moving quickly, such as in a car or airplane. Note that, generally speaking, heavy weather such as snow, rain, or clouds do not interfere with GPS signals.
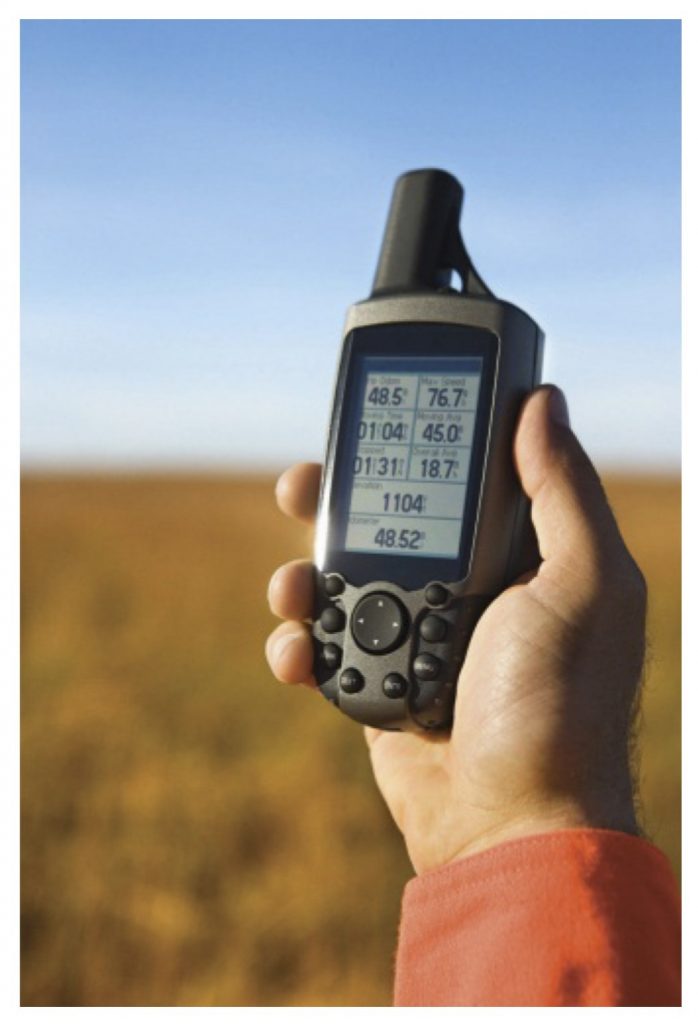
GPS handset. Handsets have specialized radios and computers that receive signals from GPS satellites and then determine location. [5]
Geocoding is the process of attaching a geographic location to some sort of address information, such as a house address or zip code, or a verbal description such as “the intersection of Elm Avenue and Main Street.” Geocoding takes a number of different forms, but most use some form of database of addresses whose locations are precisely known. Unlocated addresses are matched to these known addresses in the database.
Geocoding involves matching street addresses to known addresses or best guesses based on ranges of street addresses along streets already on a map. [6]
Surveys gather attribute information about individuals, households, businesses, or areas. Not all surveys collect spatial information, but when they do, the data can be linked to a location on a map. Surveys can be mailed to households, gathered in person, or conducted over the phone. They usually focus on a specific subpopulation or activity (e.g., students’ perceptions of safety walking home). A census is a special type of survey that collects data on all members of a population (e.g., with the goal of all inhabitants of a country). Note that survey information is usually attribute information, and determining the location requires geocoding (as with a mail survey that records the address of the person surveyed) or use of a GPS handset by the person taking a survey. Another kind of survey occurs when companies like Google equip cars with GPS receivers and cameras and drive around recording pictures of their surroundings.
Sensors. There is a growing number of sensors used to measure a wide array of human and environmental facts. We have long had climate stations, for example, which measure many variables including temperature, sunlight, and precipitation. The locations of these sensors are determined by GPS, ground surveying, or geocoding.
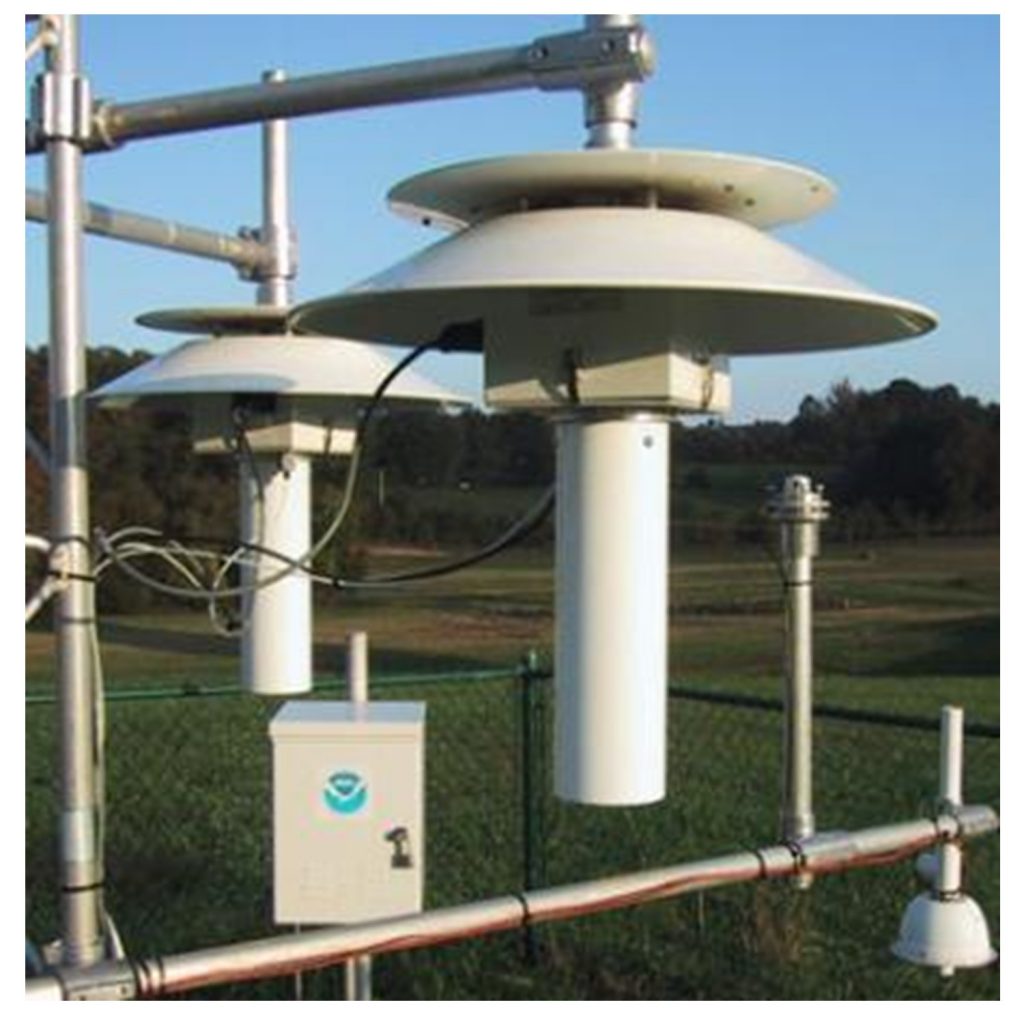
Climate observation station. Ground based stations such as these collect information on weather. [7]
2.2.2 Remote sensing
As the name suggests, remotely-sensed data are collected at a distance from the object they are studying. These data are usually collected by sensors mounted on airplanes, satellites, or drones. Some sensors collect imagery with cameras that work on essentially the same principles as you would find in a handheld film camera or digital cell phone camera. These cameras collect visible light that human eyes can recognize. Other sensors detect different nonvisible parts of the electromagnetic spectrum, such as infrared (heat). Still others can actively scan the earth with technology like radar.
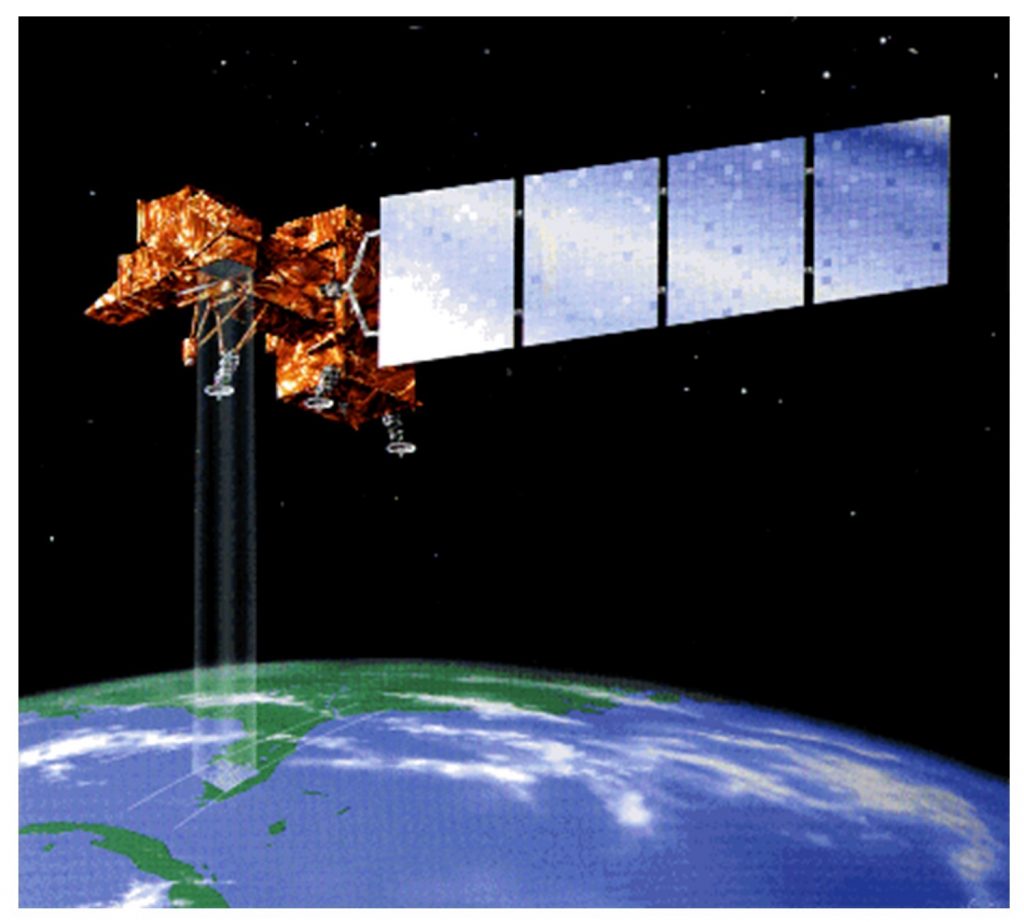
Satellite imaging. Painting of the Landsat 7 remote sensing satellite. Note that the satellite does not really cast a four-sided beam of light upon the Earth’s surface, this is just artistic licence. Instead, the satellite’s sensors record electromagnetic energy reflected or emitted by the Earth. [8]
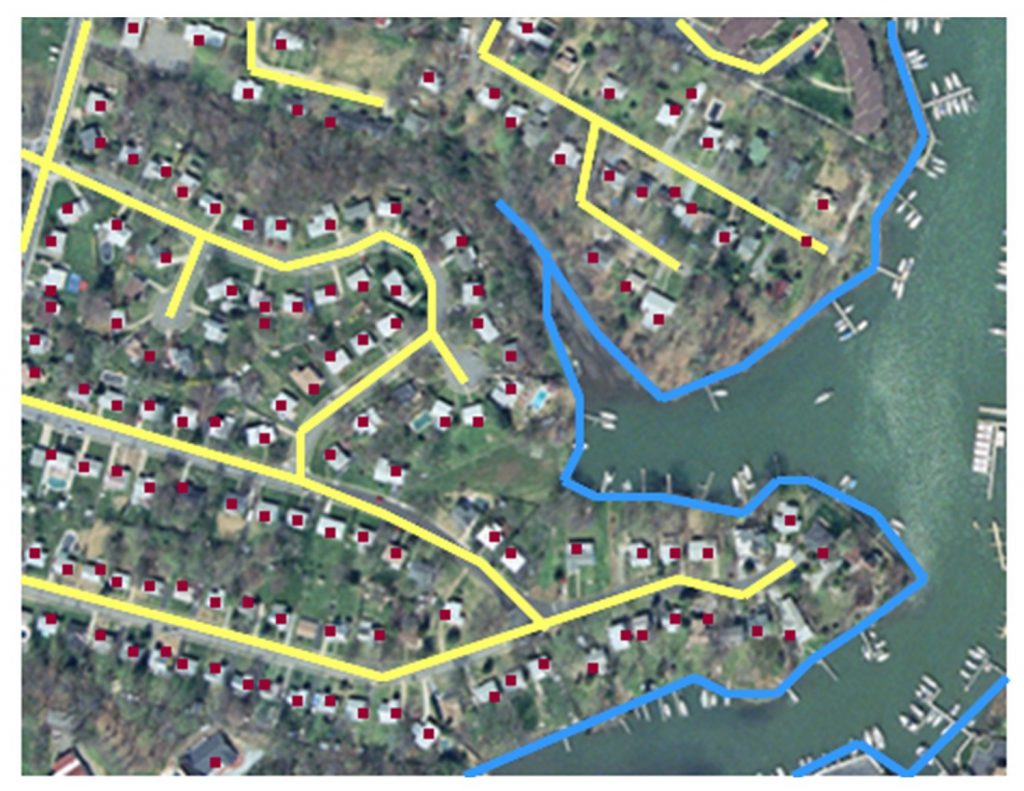
You have likely seen remotely sensed data as a basemap for Google maps or other online maps. This imagery is also used for a wide array of purposes, especially monitoring changes in the environment over large areas such as deforestation in the Amazon or oil spills.
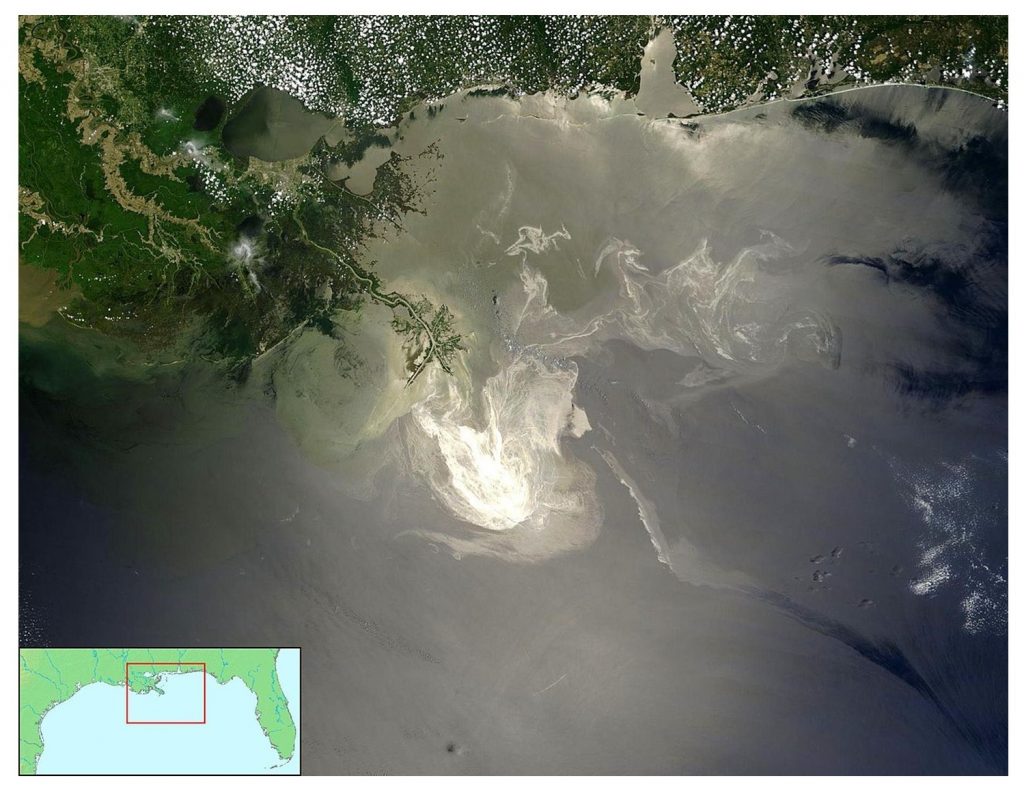
Satellite image of an oil slick. A picture from space of an oil slick from the Deepwater Horizon accident in the Gulf of Mexico (May 24, 2010). [9]
Photos are also taken by airplanes and drones. One of the most common uses is to take photos of the earth’s surface. These photos are then converted by mapping professionals into maps of the ground.
Aerial photogrammetry. Photogrammetry is the process of taking measurements of the ground from photos of the earth in order to make the data necessary for maps. [10]
2.3 Metadata
When working with maps, you will often use data that you did not create. Metadata helps you determine whether the data on the map are appropriate for your question or project. Metadata are data about data. We are usually most interested in spatial, temporal, and attribute data characteristics, but metadata go further and provide information including:
- Who collected the data?
- How were the data collected and classified?
- When were the data collected?
- How accurate are the data?
- What is the resolution of the data? (More on this below!)
Be cautious using a map if you cannot find metadata. This caution is particularly important because metadata lets you assess how well the data can work with other data. Below, we look at issues of resolution, accuracy, and interoperability among datasets. Cartographers explore these issues and then add them to the metadata attached to a map.
2.4 Census Data
An important form of survey data are census data, or those collected by national governments on their populations. We use the example of census data collected by the United States Census Bureau because the census is the primary source of social data used by government, nonprofits, and businesses. These data are created using well documented procedures and are available at a variety of scales for the entire nation. Finally, many free online mapping tools provide census data, making it possible to explore mapping concepts without rigorous technical training.
2.4.1 Background to the Census
The United States census is conducted every ten years with the goal of counting every person in the country, although, as described below, it is almost impossible to reach this goal. The census collects information about the race, age, and housing situation of the population. The primary purpose of the census, as established in the Constitution, is to determine the number of seats each state will have in the US House of Representatives, the legislative branch of government. Voting district boundaries must then be redrawn in states that have gained or lost seats between census years (we will take a closer look at how redistricting is done and the spatial challenges of the process in later chapters). Censuses also determine how hundreds of billions of dollars in federal funding are distributed for many important purposes, including education, health care, environmental protection, transportation, and other forms of federal aid to states and cities.
The first US census, carried out in 1791 by sixteen US marshals and 650 assistants, counted around 3.9 million people. They asked only a few questions: the number of free persons, the number of slaves, and the sex and race of each individual.
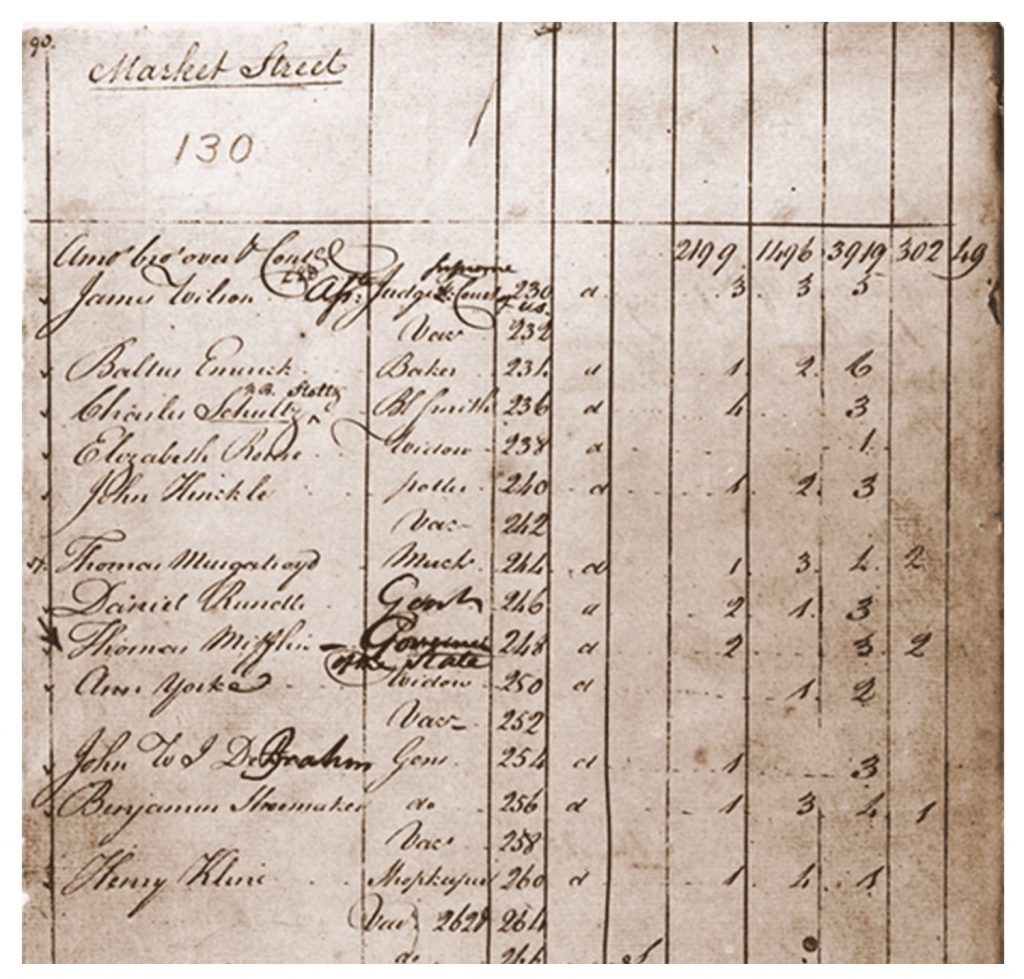
Census form 1791. This form for the first census in the United States was filled out by a census taker who asked a few questions. [11]
By 1960, with the population approaching 180 million, it was no longer feasible to have a census taker visit each household. Instead, questionnaires were mailed to every household, and temporary employees followed up in person with the households that did not respond.
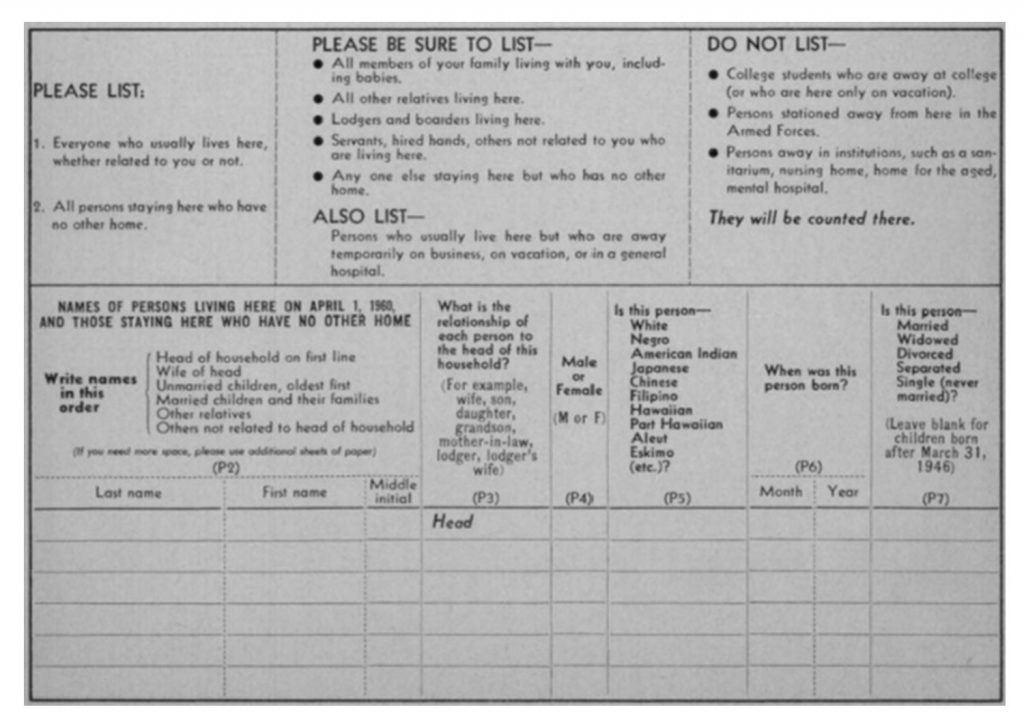
Census form 1960. This is a blank copy of the 1960 Census form that was mailed to each household to be filled out. [12]
Questions asked of all households now include the number of persons by age, gender, ethnicity, homeownership, and household composition. Between 1940 and 2000, one in six households also received a more detailed “long form” survey which asked questions about a much wider range of topics including income, occupation, commute length, and military service. The Census Bureau then used this sample to estimate the characteristics of the rest of the population.
Demand for more timely social data led to the development of the American Community Survey (ACS), which replaced the long form census survey in 2010. The ACS is conducted every year in order to provide more frequent “snapshots” of demographic, economic, and housing characteristics of the population. However, only 2-3 million households receive the survey per year (less than 2% of the population), which introduces substantial statistical errors in estimates for the whole population. Data for the census and ACS are collected from each household, but in order to preserve privacy and to make the data easier to use, the Census Bureau aggregates the data to larger geographic areas.
While data are available for a large number of different geographical areas, we will work primarily with census tracts and counties in this course. Census tracts have a population size between 1,200 and 8,000 people, with an optimum size of 4,000 people. Census tract boundaries generally follow environmental or political features, but the spatial size of census tracts can vary a great deal depending on the density of settlement and population. Census tract boundaries and shapes are drawn with the goal that they will stay pretty much the same over a long time so that statistical comparisons can be made from census to census.
2.4.2 Limitations of Census Data
The census is the most comprehensive source of demographic information available for the United States, but it still has important limitations.
The primary challenge is accuracy and undercounting. The census attempts to take a snapshot of how many people there are and where they are living on April 1st of the census year. The method for collecting data assumes that every person lives in a housing unit with a postal address and that they will respond accurately to surveys. The Census Bureau estimated that approximately 10 million people were missed in its 2010 count.
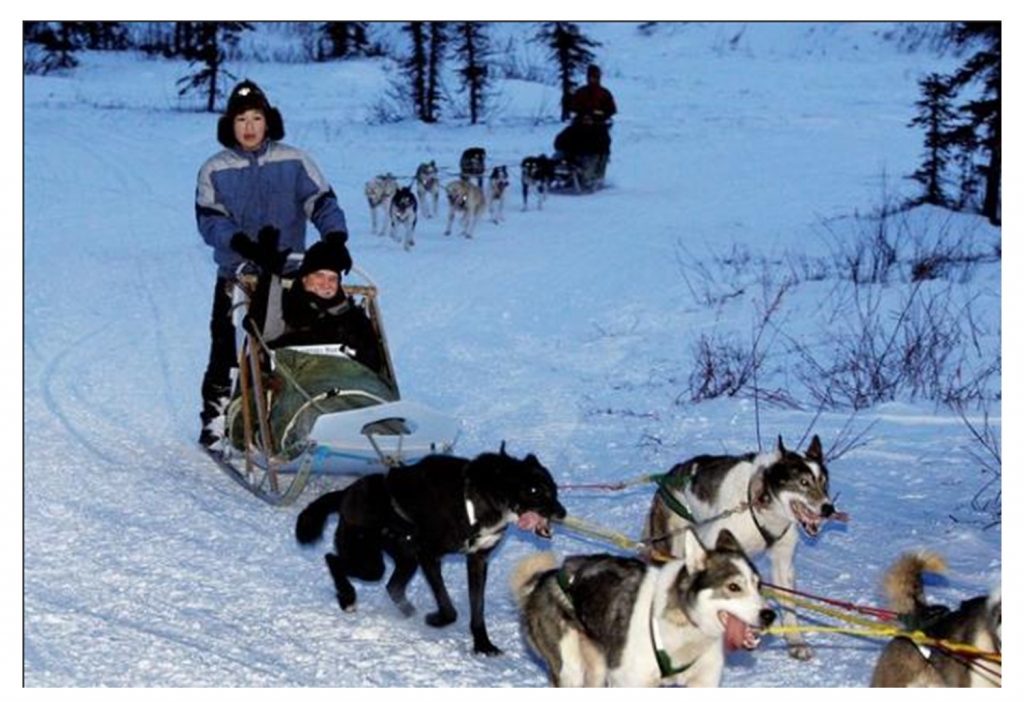
Census 2010. The first enumeration of the 2010 Census took place in Noorvik, Alaska. An early start allows census takers to reach remote villages before residents leave to hunt and fish or travel for warm-weather jobs following the spring thaw. [13]
Undercounting is not random because it is more prevalent in certain areas and subpopulations. Those who are homeless or have unstable housing at the time of the census are often missed. Those residing in remote rural areas can be hard to contact by mail or in person. The census is also less likely to receive responses from those who distrust the government, such as people fearful that their answers will be used by immigration enforcement to deport undocumented family members.
Because the census is only taken every ten years, the counts have long-term consequences for states and cities. The accuracy of counts can be very contentious in cash-strapped cities. For example, Detroit challenged the findings of the 2010 census, having come up 40,000 people short of a population cutoff point for many major sources of federal funding. Since poor and marginalized populations are among the hardest to count, districts with the most need are also the most at risk of underfunding and underrepresentation.
Beyond accuracy issues, while the census and ACS provide an extensive set of social data, plenty of topics are not covered. For example, there are no questions about religion, consumer spending, or political party affiliation. The quantity and wording of questions asked in the census has changed over time, and data are not always available for all places or for all geographic areas.
Remember that there are many other social surveys which collect information about different attributes, areas, or periods. For example, the Association of Statisticians of American Religious Bodies conducts the “Religious Congregations and Membership Study” (RCMS) every 10 years to track patterns of religious affiliation. Local governments gather data for projects in their specific region. There are also censuses conducted in countries around the world with varying levels of detail and accuracy.
2.5 Data Concepts & Problems
When choosing data to analyze a specific problem, there are some key concepts to bear in mind: 1) resolution, 2) accuracy, and 3) interoperability. We will look at each of these concepts with respect to the three elements of spatial data (location, attributes, time). Each of these concepts can be rolled in under the term metadata in that they are information about data (or data about data). Developing and understanding metadata involve looking past the basics of ‘data’ in terms of spatial location, attributes measured, and time collected.
2.5.1 Resolution
Resolution describes the breadth or specificity of the data you are examining. There are three main types of resolution – spatial, attribute, and temporal. Higher resolution corresponds with smaller areas over which data are aggregated, narrower distinctions between categories, or shorter times between data collection. But before we get into examples of resolution related to mapping social data, think about the concept in relation to everyday technology.
Spatial Resolution. You have probably seen the term “resolution” used to describe the quality of a computer screen or mobile phone camera. Each picture is composed of many smaller squares or pixels. When the pixels that make up the larger picture are small, more detail can be distinguished and the image is said to have higher resolution. As the size of the square pixels increases, it becomes more difficult to make out small details, such as the water droplets on the flower petals. This can be important if you copy an image from a website and then resize the image. Depending on the resolution of the original picture, you may suddenly be able to see pixels that previously were too small to see.
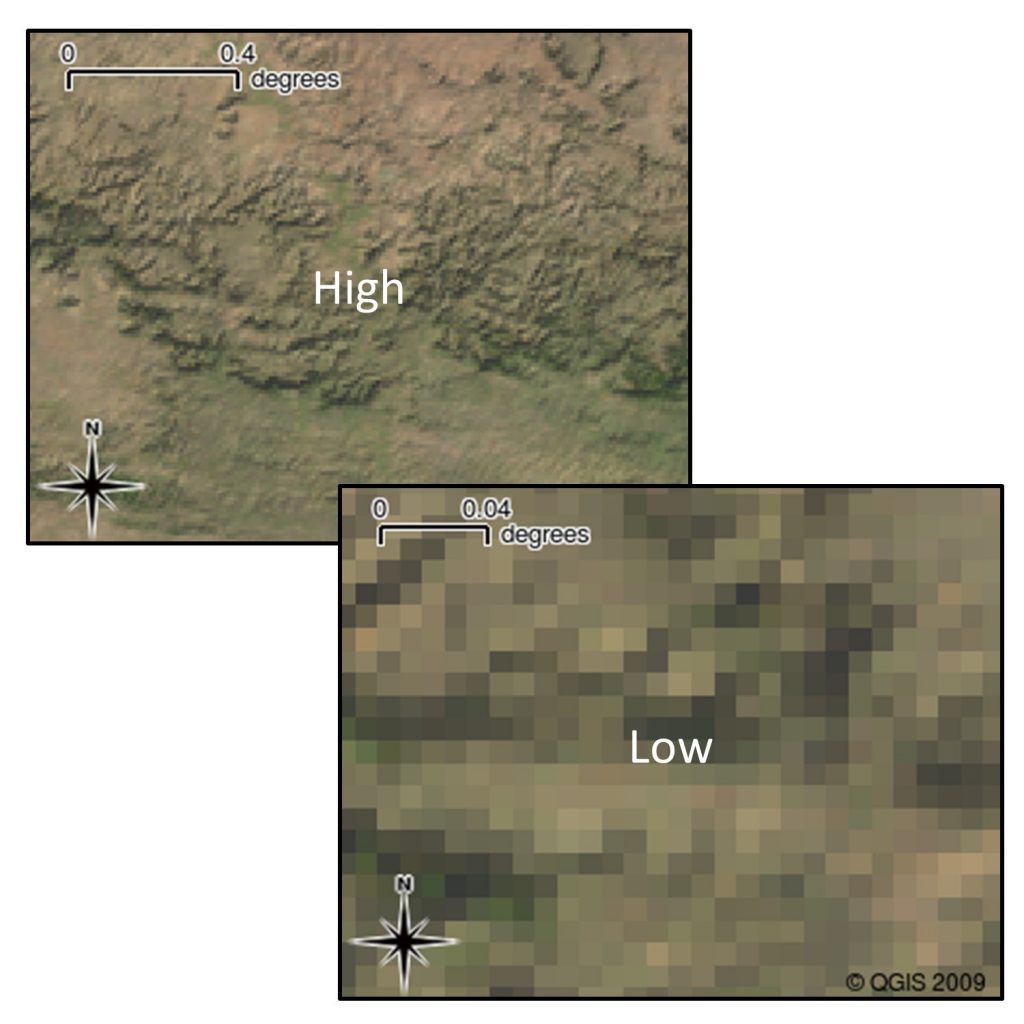
Spatial resolution. Comparing higher resolution and lower resolution in a photograph of leaves (top) or in a grid (bottom). [14]
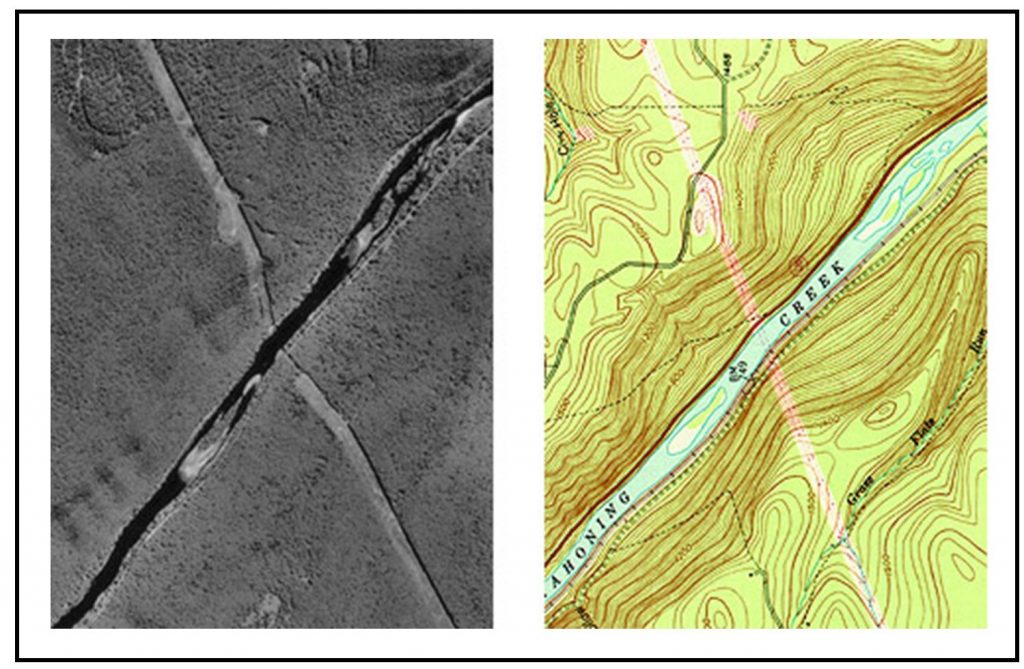
Spatial resolution can also refer to the question, “What is the smallest unit of area measured?” It is similar to pixel resolution, except that the map often is not split into equally sized squares. Instead, the map might be split up between administrative boundaries (such as census tracts, counties, or states) which have varying shapes and land areas. The greater the area over which data have been aggregated, the lower the resolution and the more difficult it is to make out small details in the data. In the figure below, small areas of high population density are not visible with lower spatial resolution.
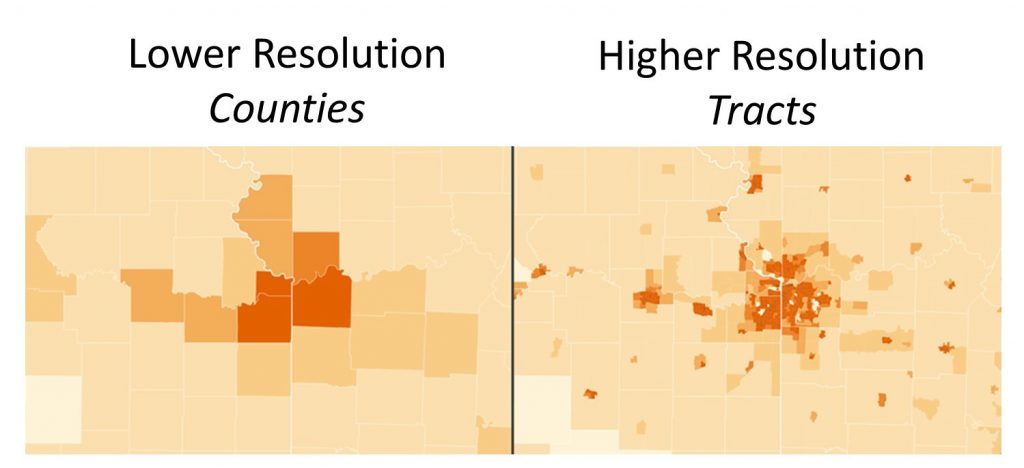
Census data resolution. Comparing population density data aggregated by county (left) to data aggregated by census tract (right). [15]
Consider an example. If you were trying to determine whether there had been increasing median income on your block in the last 4 years, but the only data you could find was zip code level resolution, it would be hard to establish the pattern. Zip codes are substantially larger than blocks. Changes of median income in other parts of the zip code might obscure or falsely enhance what is happening on your block.
Attribution resolution deals with the degree to which distinctions are made between categories. Data split into many categories provide more detailed distinctions and therefore higher attribute resolution. For example, imagine you are interested in data about the age of individuals. If the data are grouped into only two categories – individuals who are under 18 years old and individuals who are over 18 years old – the data would have low attribute resolution. By comparison, splitting ages into more categories (e.g., 0-18, 18-34, 34-64, 65+) would give us higher attribution resolution. If you need to know the number of individuals who are old enough to vote in national elections, using the lower resolution data would be sufficient. But if you are interested in the number of senior citizens, you would need to have higher data resolution.
Temporal resolution is the frequency with which data are collected, and in essence addresses the question, How often or over what period of time is a measurement taken? In the section above, we noted that the US Census Bureau collects data every ten years, whereas the ACS conducts a survey every year. The census is more accurate than the ACS because it draws on a larger proportion of the population, but at the cost of having a coarser temporal resolution. It would not be possible to make an argument about how your neighborhood had changed demographically over a period of five years given the temporal resolution of the census, because the census will only give you a snapshot of your neighborhood every ten years.
In summary, when looking at data, ask yourself the following questions: Are you looking at the correct area for the question being asked? Are the categories in the data specific enough for your argument (or do you need to broaden your claims)? Are data collected frequently enough for the time period you want to analyze?
2.5.2 Accuracy
Accuracy describes how well data on a map align with objects in the world. There are three main types of accuracy – spatial, attribute, and temporal.
Spatial accuracy answers the question of how well an object’s location on the map matches its location in the world. There are many reasons why the locations of something on a map do not exactly correspond to those on the ground in reality. Boundaries between countries may be drawn incorrectly. Points marked using GPS can be offset from their actual location if the signal is blocked by trees or tall buildings. The figure below shows the example of a person whose movements are being tracked with GPS in a vehicle. The map appears to show the person walking through several buildings and then running across a nine-lane freeway. It only appears that way on the maps because of an error in how the GPS measurements were collected.
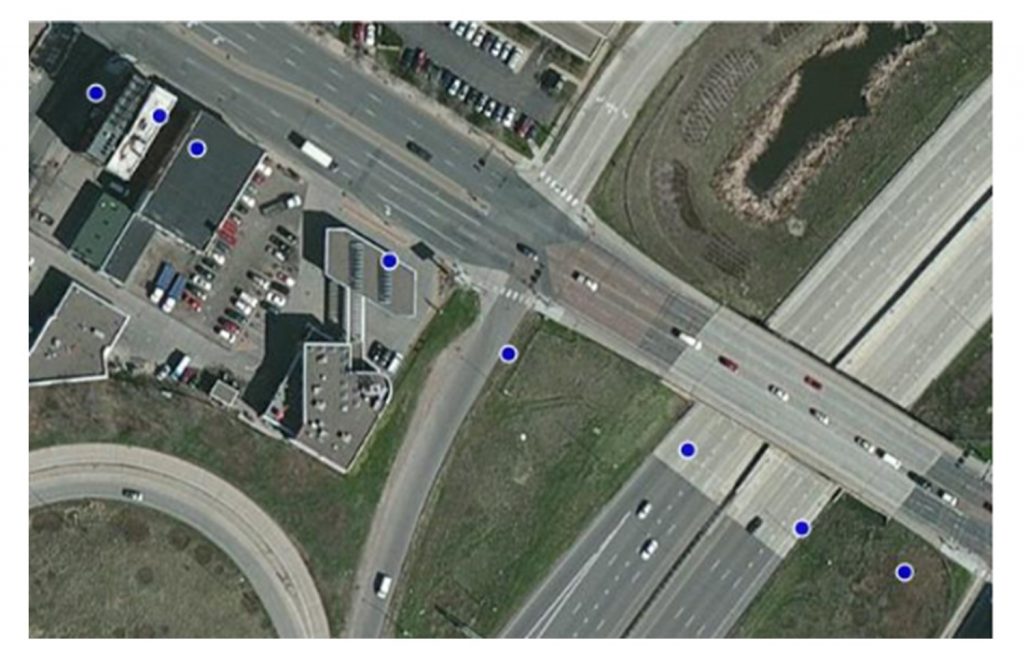
Spatial accuracy. Blue dots mark the path taken by an individual carrying a GPS tracking device in a vehicle. [16]
Attribute accuracy asks whether characteristics reported about an object are true about that object in the world. Attribute inaccuracies can show up in survey data if participants do not respond, misunderstand the instructions, or purposefully provide false information. Inaccuracies may also occur when estimating values for a small area based on a small number of responses. Remember that the ACS polls around 2% of the population each year – 4 out of every 200 people – and then estimates the characteristics of the rest of the population from their responses. The ACS has better attribute and temporal resolution than the census (more categories that are collected more often), but the census is more accurate in the sense that it counts more people.
Temporal accuracy is concerned with whether details about an object are up-to-date with respect to changes in the world. While data may be accurate and complete at the time they are collected, details may soon be inaccurate because of changes to the social and physical landscape. For example, the objects on a printed reference map will become less accurate over time as new roads are constructed, removed, or given name changes.

Temporal accuracy. Static road maps are updated much less frequently than Google maps. [17]
2.5.3 Interoperability
Interoperability describes how well two different datasets work with each other. There are three main types of interoperability – spatial, attribute, and temporal.
Ask yourself the following questions: Are they comparing the same area? Do they use the same categories and define them in the same way? These questions are especially relevant when using data collected by different organizations or across multiple time periods.
Spatial interoperability. How well do spatial units match up? This is the question that concerns spatial interoperability. For example, zip codes and census tracts are spatial units for which data are frequently aggregated, but their boundaries are rarely the same. A census tract may fall within multiple zip codes and vice versa. Zip code level data and census tract level data have poor interoperability because they do not show characteristics for the same group of people.
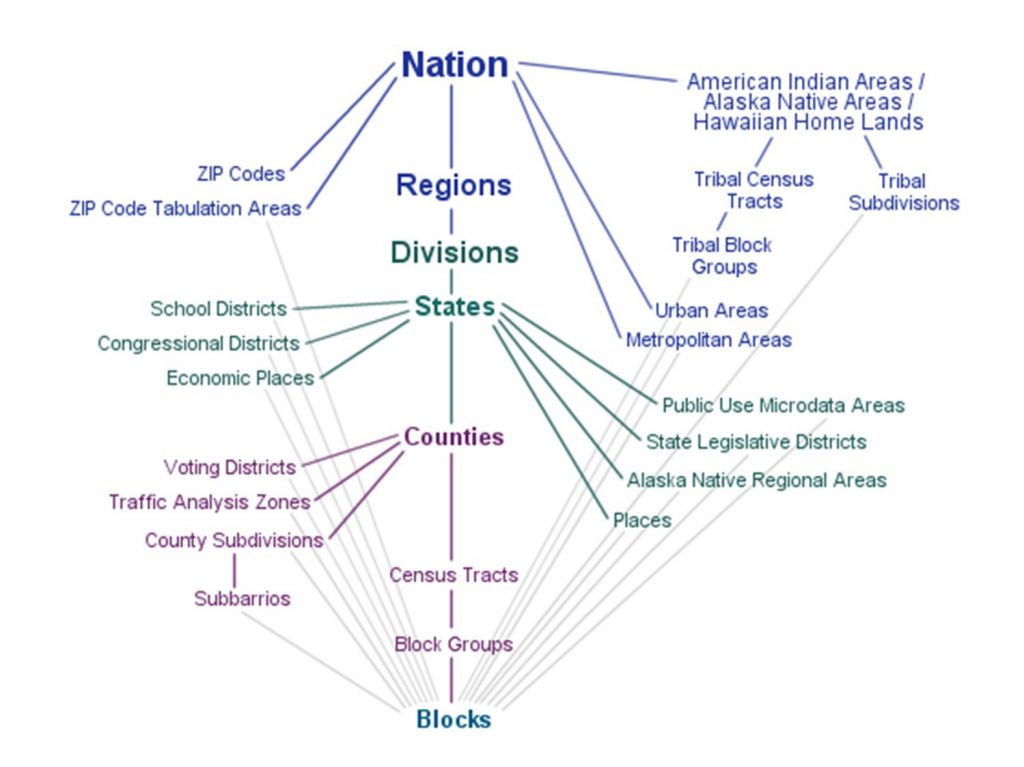
Census Geographies. Census Geographies. Geographic areas for which the US Census Bureau makes data available, ranging from the state level down to blocks. [18]
Attribute interoperability asks the question: how well do the categories of two datasets match? For example, in the 2010 census, individuals could pick from between fifteen different racial categories with the option of selecting multiple categories. By comparison, in the 1850 census individuals were divided into only three racial categories: “white,” “black,” or “mulatto.” These two datasets have poor attribute interoperability because they have very different attribute resolution and do not have matching categories.
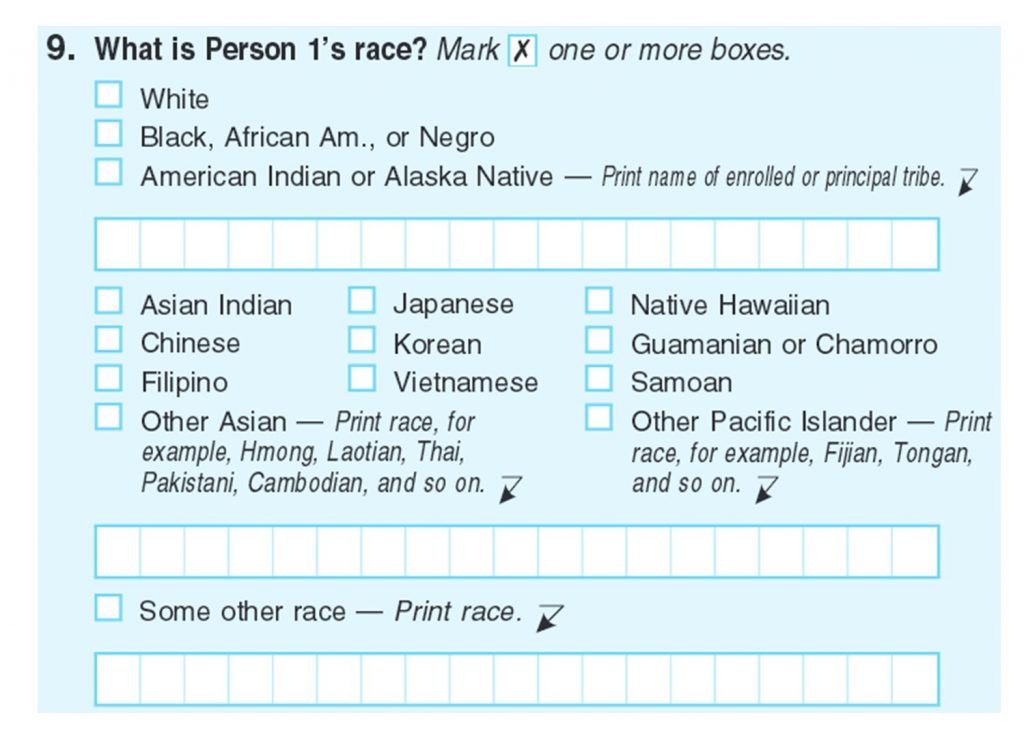
Census form 2010 on race. In the 2010 Census, individuals could pick from between fifteen different racial categories with the option of selecting multiple categories. [19]
Even a category that has a similar name between two census years may measure different attributes. The category “Chinese” used in the 1870 census was applied to individuals from any part of Asia, rather than just China. It is therefore not interoperable with “Chinese” as used in the 2010 census.
Temporal interoperability. How well do reported times match up? Temporal interoperability is of most concern if you are making an argument about what things are like at one point in time but your data are not from the same point in time. For example, imagine you are working at a nonprofit that is trying to compare the number of children ages 0-5 to the number and location of early childhood centers in an area. The most accurate count of children is from the 2010 census, but your organization has information about childhood centers collected in 2015. These two datasets have poor temporal interoperability because no children who were 0-5 at the time of the census would still be in that age bracket in 2015. It would be hard to determine whether childhood centers are appropriately located based on this data. Per below, sometimes you have to worry about both spatial and temporal interoperability!
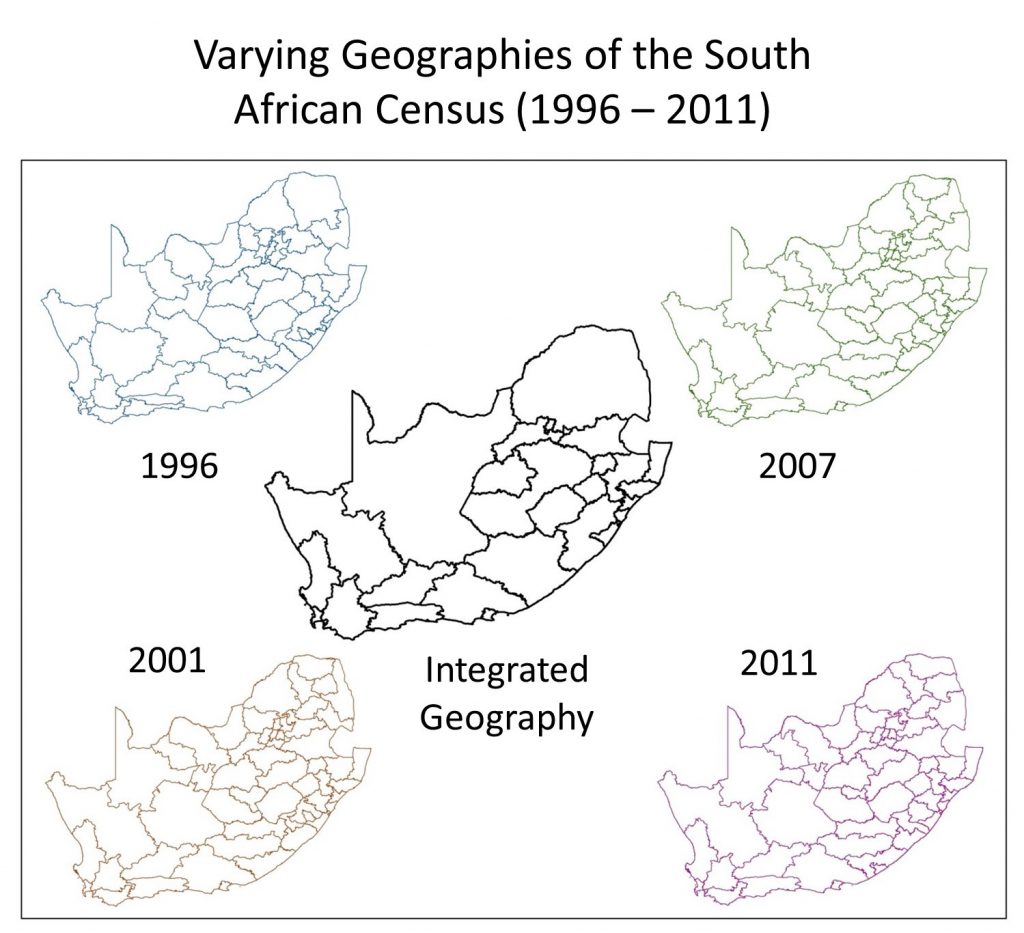
Spatial and temporal interoperability. Boundaries for different census years in South Africa do not align between years because new regions were added over time. One solution is to create a new map that groups together regions; this integrated geography allows data to be compared between maps. [20]
In summary, when looking at multiple sets of data, ask yourself: Does it make sense to compare these data? Are the data generated for the same area using the same spatial units? Are the attribute categories defined the same way by the organization(s) that produced the data and over time? Were the data produced over a comparable time frame?
2.6 Mapping Tools
There are many software programs for making maps and most offer a range of data to their users. While these programs have traditionally been developed for desktop computers, a large and growing number of websites and web applications are allowing people to view and make maps online. These maps and tools have been developed with the goal of making data more accessible to researchers, politicians, and members of the public.
Social Explorer is an example of an online mapping tool, developed to make it easier to access and use data generated by the US Census Bureau. Keep in mind that many organizations are focused on getting maps online and had no role in collecting the underlying data. Instead, online maps and mapping tools act like libraries by bringing together information from multiple sources. Note that Social Explorer is not the source of the data being mapped; it is our tool for exploring data created by the Census Bureau.
2.7 Conclusion
Whenever you look at a map, it is important to think about how the data that has been visualized were generated. Who created the map? How were the underlying data collected? What questions were asked of whom? How accurate is the map? What is missing? Even the most carefully created data contain errors and have a context within a social, political, and cultural landscape. To be a responsible map user and map maker, you must think about what you can and cannot show given the resolution, accuracy, and interoperability of the available data. It is important to cite the sources of the data you include on your map so that your audience can find additional information.
As we move on to explore how to symbolize and simplify data, to make an appealing map, and to analyze the spatial relationships of data, remember: a map can only be as good as the data that go into it.
Resources
For more information about the history of census questions and procedures, and what the census does and does not ask:
- US Census
- Social Explorer
For more information about GPS:
- Pennsylvania State University Geography 482: The Nature of Geographic Information
- Adam Goetsch at USC
- CC BY-NC-SA 3.0. Adapted from Dibiase et al. (2012) Mapping our Changing World. https://www.e-education.psu.edu/geog160/node/1930. Jennifer M. Smith, Department of Geography, The Pennsylvania State University; Data from U.S. Census Bureau. ↵
- CC BY-NC-SA 3.0. Adapted from David Dibiase (1998) Nature of Geographic Information. https://www.e-education.psu.edu/natu...nfo/c5_p8.html; originally Hodgson, C. V. A leveling crew at work in 1916. NOAA Historical Photo Collection (2004). Retrieved on April 20, 2006, from http://www.photolib.noaa.gov/. ↵
- CC BY-NC-SA 4.0. Adapted from J. Campbell and M. Shin (2012). https://2012books.lardbucket.org/boo...ics/index.html; ↵
- CC BY-NC-SA 4.0. Adapted from J. Campbell and M. Shin (2012) https://2012books.lardbucket.org/boo...ics/index.html↵
- CC BY-NC-SA 4.0. Adapted from J. Campbell and M. Shin (2012) https://2012books.lardbucket.org/boo...ics/index.html↵
- CC BY-NC-SA 3.0. Adapted from Dibiase et al. (2012) Mapping our Changing World. https://www.e-education.psu.edu/geog160/node/1941. Data from U.S. Census Bureau. ↵
- Public Domain. NOAA's National Centers for Environmental Information (nd) Measuring instruments used for current observations and data reporting. www.ncdc.noaa.gov/data-acces...d-based-statio n-data ↵
- CC BY-NC-SA 3.0. Adapted from David Dibiase (1998). Nature of Geographic Information. https://www.e-education.psu.edu/natu...nfo/c5_p8.html↵
- Public Domain. By NASA/GSFC, MODIS Rapid Response AND demis.nl AND FT2 - 1/ File:Deepwater Horizon oil spill - May 24, 2010.jpg (based upon Original image with cropping)2/ Locator by FT2 from File:Map of USA topological.png (Public domain by author demis.nl)., Public Domain, https://commons.wikimedia.org/w/inde...curid=10671450. ↵
- CC BY-NC-SA 3.0. Adapted from David Dibiase (1998) Nature of Geographic Information https://www.e-education.psu.edu/natu...nfo/c5_p8.html. ↵
- Public Domain. US Census Bureau. www.census.gov/history/www/s...790_photos.php↵
- Public Domain. US Census Bureau. https://broadcast.census.gov/pio/pho...0/1960a_hi.jpg↵
- Public Domain. www.census.gov/history/www/s...sounds/photos/ 2010_photos.php# ↵
- GNU Free Documentation License, Version 1.2. Adapted from Sutton, O. Dassau, M. Sutton (2009). A Gentle Introduction to GIS. Chief Directorate: Spatial Planning & Information, Department of Land Affairs, Eastern Cape. http://docs.qgis.org/2.14/en/docs/ge...ucing_gis.html↵
- CC BY-NC-SA 4.0. Steven M. Manson (2015) ↵
- CC BY-NC-SA 4.0. Steven M. Manson (2015) ↵
- Unsplash license. https://unsplash.com/search/map?photo=gtCWBwbZNpM, John-Mark Kuznietsov ↵
- Public Domain. US Census. http://factfinder.census.gov/faces/n...ges/using_fact finder.xhtml?page=census_geography ↵
- Public Domain. US Census Bureau website - www.census.gov/prod/cen2010/b...c2010br-02.pdf↵
- CC BY-NC-SA 4.0. Adapted from IPUMSI, created by Sula Sarka and Ding Fei. https://international.ipums.org/international/↵