
6.3: Climate Proxies and the Climate Record
- Page ID
- 5559

\( \newcommand{\vecs}[1]{\overset { \scriptstyle \rightharpoonup} {\mathbf{#1}} } \)
\( \newcommand{\vecd}[1]{\overset{-\!-\!\rightharpoonup}{\vphantom{a}\smash {#1}}} \)
\( \newcommand{\id}{\mathrm{id}}\) \( \newcommand{\Span}{\mathrm{span}}\)
( \newcommand{\kernel}{\mathrm{null}\,}\) \( \newcommand{\range}{\mathrm{range}\,}\)
\( \newcommand{\RealPart}{\mathrm{Re}}\) \( \newcommand{\ImaginaryPart}{\mathrm{Im}}\)
\( \newcommand{\Argument}{\mathrm{Arg}}\) \( \newcommand{\norm}[1]{\| #1 \|}\)
\( \newcommand{\inner}[2]{\langle #1, #2 \rangle}\)
\( \newcommand{\Span}{\mathrm{span}}\)
\( \newcommand{\id}{\mathrm{id}}\)
\( \newcommand{\Span}{\mathrm{span}}\)
\( \newcommand{\kernel}{\mathrm{null}\,}\)
\( \newcommand{\range}{\mathrm{range}\,}\)
\( \newcommand{\RealPart}{\mathrm{Re}}\)
\( \newcommand{\ImaginaryPart}{\mathrm{Im}}\)
\( \newcommand{\Argument}{\mathrm{Arg}}\)
\( \newcommand{\norm}[1]{\| #1 \|}\)
\( \newcommand{\inner}[2]{\langle #1, #2 \rangle}\)
\( \newcommand{\Span}{\mathrm{span}}\) \( \newcommand{\AA}{\unicode[.8,0]{x212B}}\)
\( \newcommand{\vectorA}[1]{\vec{#1}} % arrow\)
\( \newcommand{\vectorAt}[1]{\vec{\text{#1}}} % arrow\)
\( \newcommand{\vectorB}[1]{\overset { \scriptstyle \rightharpoonup} {\mathbf{#1}} } \)
\( \newcommand{\vectorC}[1]{\textbf{#1}} \)
\( \newcommand{\vectorD}[1]{\overrightarrow{#1}} \)
\( \newcommand{\vectorDt}[1]{\overrightarrow{\text{#1}}} \)
\( \newcommand{\vectE}[1]{\overset{-\!-\!\rightharpoonup}{\vphantom{a}\smash{\mathbf {#1}}}} \)
\( \newcommand{\vecs}[1]{\overset { \scriptstyle \rightharpoonup} {\mathbf{#1}} } \)
\( \newcommand{\vecd}[1]{\overset{-\!-\!\rightharpoonup}{\vphantom{a}\smash {#1}}} \)
\(\newcommand{\avec}{\mathbf a}\) \(\newcommand{\bvec}{\mathbf b}\) \(\newcommand{\cvec}{\mathbf c}\) \(\newcommand{\dvec}{\mathbf d}\) \(\newcommand{\dtil}{\widetilde{\mathbf d}}\) \(\newcommand{\evec}{\mathbf e}\) \(\newcommand{\fvec}{\mathbf f}\) \(\newcommand{\nvec}{\mathbf n}\) \(\newcommand{\pvec}{\mathbf p}\) \(\newcommand{\qvec}{\mathbf q}\) \(\newcommand{\svec}{\mathbf s}\) \(\newcommand{\tvec}{\mathbf t}\) \(\newcommand{\uvec}{\mathbf u}\) \(\newcommand{\vvec}{\mathbf v}\) \(\newcommand{\wvec}{\mathbf w}\) \(\newcommand{\xvec}{\mathbf x}\) \(\newcommand{\yvec}{\mathbf y}\) \(\newcommand{\zvec}{\mathbf z}\) \(\newcommand{\rvec}{\mathbf r}\) \(\newcommand{\mvec}{\mathbf m}\) \(\newcommand{\zerovec}{\mathbf 0}\) \(\newcommand{\onevec}{\mathbf 1}\) \(\newcommand{\real}{\mathbb R}\) \(\newcommand{\twovec}[2]{\left[\begin{array}{r}#1 \\ #2 \end{array}\right]}\) \(\newcommand{\ctwovec}[2]{\left[\begin{array}{c}#1 \\ #2 \end{array}\right]}\) \(\newcommand{\threevec}[3]{\left[\begin{array}{r}#1 \\ #2 \\ #3 \end{array}\right]}\) \(\newcommand{\cthreevec}[3]{\left[\begin{array}{c}#1 \\ #2 \\ #3 \end{array}\right]}\) \(\newcommand{\fourvec}[4]{\left[\begin{array}{r}#1 \\ #2 \\ #3 \\ #4 \end{array}\right]}\) \(\newcommand{\cfourvec}[4]{\left[\begin{array}{c}#1 \\ #2 \\ #3 \\ #4 \end{array}\right]}\) \(\newcommand{\fivevec}[5]{\left[\begin{array}{r}#1 \\ #2 \\ #3 \\ #4 \\ #5 \\ \end{array}\right]}\) \(\newcommand{\cfivevec}[5]{\left[\begin{array}{c}#1 \\ #2 \\ #3 \\ #4 \\ #5 \\ \end{array}\right]}\) \(\newcommand{\mattwo}[4]{\left[\begin{array}{rr}#1 \amp #2 \\ #3 \amp #4 \\ \end{array}\right]}\) \(\newcommand{\laspan}[1]{\text{Span}\{#1\}}\) \(\newcommand{\bcal}{\cal B}\) \(\newcommand{\ccal}{\cal C}\) \(\newcommand{\scal}{\cal S}\) \(\newcommand{\wcal}{\cal W}\) \(\newcommand{\ecal}{\cal E}\) \(\newcommand{\coords}[2]{\left\{#1\right\}_{#2}}\) \(\newcommand{\gray}[1]{\color{gray}{#1}}\) \(\newcommand{\lgray}[1]{\color{lightgray}{#1}}\) \(\newcommand{\rank}{\operatorname{rank}}\) \(\newcommand{\row}{\text{Row}}\) \(\newcommand{\col}{\text{Col}}\) \(\renewcommand{\row}{\text{Row}}\) \(\newcommand{\nul}{\text{Nul}}\) \(\newcommand{\var}{\text{Var}}\) \(\newcommand{\corr}{\text{corr}}\) \(\newcommand{\len}[1]{\left|#1\right|}\) \(\newcommand{\bbar}{\overline{\bvec}}\) \(\newcommand{\bhat}{\widehat{\bvec}}\) \(\newcommand{\bperp}{\bvec^\perp}\) \(\newcommand{\xhat}{\widehat{\xvec}}\) \(\newcommand{\vhat}{\widehat{\vvec}}\) \(\newcommand{\uhat}{\widehat{\uvec}}\) \(\newcommand{\what}{\widehat{\wvec}}\) \(\newcommand{\Sighat}{\widehat{\Sigma}}\) \(\newcommand{\lt}{<}\) \(\newcommand{\gt}{>}\) \(\newcommand{\amp}{&}\) \(\definecolor{fillinmathshade}{gray}{0.9}\)Overview
The first method most students think about when we talk about recording climate is using a thermometer to directly measure temperature. There are actually a few problems reconstructing climate patterns this way, including that the thermometer gives a very local signal and, more importantly, thermometers are a relatively recent invention. Given that direct observations do not give us the long-term trends needed to establish climate change or patterns, we must look at a natural recorder of climate called a climate proxy. As climate changes it affects the deposition of sedimentary rock, rock chemistry, and fossil organisms that scientists can detect in order to reconstruct ancient climate patterns, in a field called paleoclimatology. An individual climate proxy may not give a clear signal of the global climate for a couple of reasons. First, proxies show a history of the area in which they were formed, not of an entire region. Second, an individual proxy, which may have a long or a short record, can record the short-term variability of weather events. And third, most climate proxies are influenced by multiple factors. For instance, the thickness of tree rings (dendrochronology) is a wonderful proxy for temperature. Trees grow more in warmer years (producing thicker rings) and less in colder years (producing thinner rings). However, a tree could also grow slowly because of a drought or because of an infestation of pests even if it was a warm year.
If all of the individual proxies show local patterns, with some degree of weather-related noise, and possibly influenced by other factors, how do we then reconstruct long-term global temperature records? The answer lies in increasing the size of the dataset. If temperature is the most important variable influencing the proxies, and we combine hundreds to thousands of individual proxy records, an overarching pattern emerges from the noise. Again, an individual proxy record may be contrary to the overall trend, but that is expected since a local region can have a cold winter in the midst of an overall hot year for the planet. To illustrate this consider the following: say we want to reconstruct overall economic patterns over the past few hundred years in the United States of America. We could examine lots of proxies for economic growth, such as employment, the stock market, individual wealth, or rates of home-ownership to name a few. If we only looked at one of these proxies we likely would not get a clear picture of change. Also, if we only looked at Macon, Georgia, for example, we would be unlikely to see a trend that mimics the entire country. For instance, if a new factory opened outside of Macon, GA that would be a huge economic benefit for the city, but not for the country overall. Again, the more data we have, whether it is for economics, or climate, or any other complex system, the clearer the signal becomes over the local and random noise.
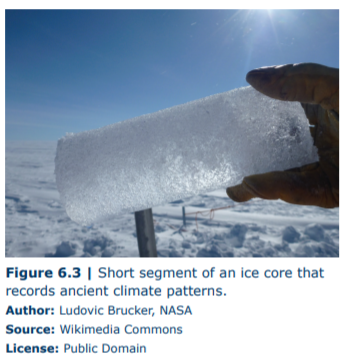
 One of the most commonly used climate proxies is the measurement of oxygen isotopes. As you may remember from chapter one, isotopes are atoms of the same element that differ in their weights because of differences in the number of neutrons in the nucleus of the atom. Multiple isotopes of oxygen are stable, meaning they do not radioactively decay over time. Oxygen has two stable isotopes that occur in a constant ratio on Earth. However, certain minerals (like calcite or ice) prefer one of the isotopes over the other within their crystal structure (a slightly larger or smaller atom fits better). This preference results in a ratio of oxygen isotopes that is different from the ratio found in other materials; this difference is called fractionation. The amount of fractionation in oxygen isotopes is temperature dependent, such that the mineral calcite has a different ratio of oxygen isotopes if it was formed in near-freezing versus warm water temperatures. Using oxygen isotopes we can get climate records from many different sources, including coral, clams and other mollusks, the skeletons of single-celled organisms, and ice cores to name a few. Ice cores (as shown in Figure 6.3) can contain a wealth of climate data in addition to temperature data from oxygen isotopes, such as air bubbles that record the levels of greenhouse gases, concentrations of windblown aerosols, and ash from volcanic eruptions.
Other proxies include the extent of glacial sediment, sea-level curves, pollen (palynology), and fossils. For instance, climatologists have used several features within fossil plants to reconstruct climate, largely because these organisms are sensitive to climate. These proxies include the thickness of tree rings, the shape of the leaves (toothier leaves are more common in colder climates), and the density of pores on leaf surfaces (more pores are needed with lower concentrations of carbon dioxide, which is necessary for photosynthesis).
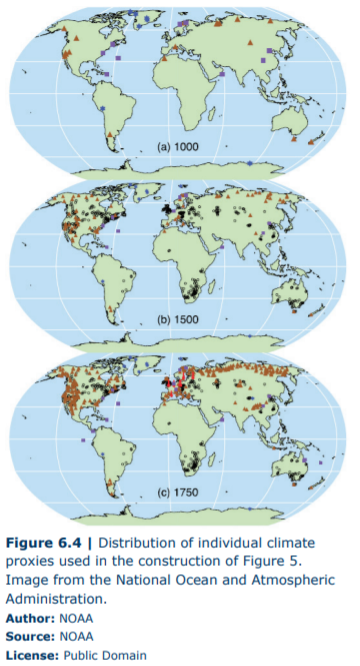
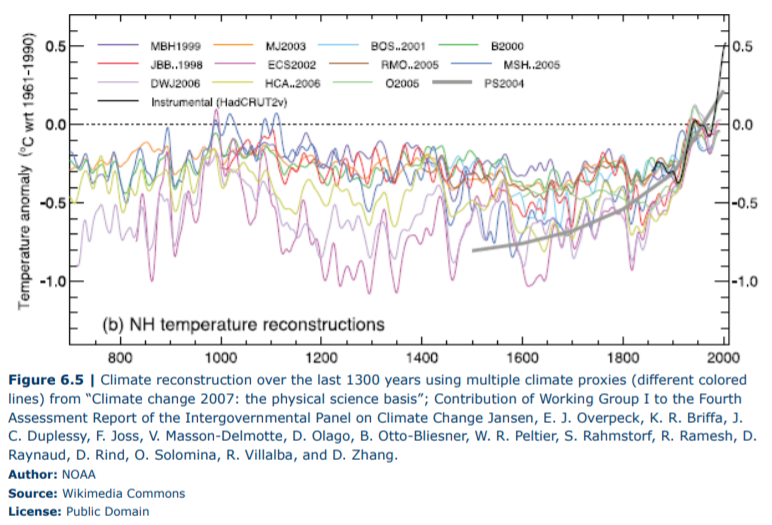
As was mentioned before, by combining hundreds to thousands of individual climate records we can start to gain insight into overall climate trends. For instance, the Intergovernmental Panel on Climate Change (IPCC) and the National Oceanic and Atmospheric Administration (NOAA) regularly compile multiple types of proxy records from across the world (Figure 6.4) to reconstruct climate patterns (Figure 6.5). The accuracy of the climate records very much depends on the time frame being considered, with more certainty in the patterns of the recent past (Cenozoic) and less the further back in geologic time we are examining.
The climate proxy we will focus on for this lab is the extent of sea ice coverage on the North and South Polar ice sheets. This is an easy proxy to assess from satellite images and is measured as the size of the ice sheet in million square kilometers. This proxy isn’t a perfect indicator of global climate change, but it is easy to understand that a warming of the Earth is likely to cause a decrease in the amount of ice at the poles and thus a decrease in the ice extent, while a cooling event will cause an increase in ice production. Ice extent is simply the amount of geographic area covered by a glacier as measured from satellites.
There is debate surrounding the interpretation of individual proxies and the resulting climate records, which largely stems from the economic and political aspects of climate change. This current lab was constructed following a discussion with a student regarding the information presented in several climate articles. The discussion focused on how scientific data is presented to the public and how we should make conclusions based on presented data. In considering information that we are presented with it is important to consider
- the source of the data,
- how the data was collected,
- how the data is presented, and, most importantly,
- what are the reasonable conclusions you should make from the data independent of the opinions expressed alongside the data.