
19.4: Composition and Structure of Planets
- Page ID
- 32292

\( \newcommand{\vecs}[1]{\overset { \scriptstyle \rightharpoonup} {\mathbf{#1}} } \)
\( \newcommand{\vecd}[1]{\overset{-\!-\!\rightharpoonup}{\vphantom{a}\smash {#1}}} \)
\( \newcommand{\id}{\mathrm{id}}\) \( \newcommand{\Span}{\mathrm{span}}\)
( \newcommand{\kernel}{\mathrm{null}\,}\) \( \newcommand{\range}{\mathrm{range}\,}\)
\( \newcommand{\RealPart}{\mathrm{Re}}\) \( \newcommand{\ImaginaryPart}{\mathrm{Im}}\)
\( \newcommand{\Argument}{\mathrm{Arg}}\) \( \newcommand{\norm}[1]{\| #1 \|}\)
\( \newcommand{\inner}[2]{\langle #1, #2 \rangle}\)
\( \newcommand{\Span}{\mathrm{span}}\)
\( \newcommand{\id}{\mathrm{id}}\)
\( \newcommand{\Span}{\mathrm{span}}\)
\( \newcommand{\kernel}{\mathrm{null}\,}\)
\( \newcommand{\range}{\mathrm{range}\,}\)
\( \newcommand{\RealPart}{\mathrm{Re}}\)
\( \newcommand{\ImaginaryPart}{\mathrm{Im}}\)
\( \newcommand{\Argument}{\mathrm{Arg}}\)
\( \newcommand{\norm}[1]{\| #1 \|}\)
\( \newcommand{\inner}[2]{\langle #1, #2 \rangle}\)
\( \newcommand{\Span}{\mathrm{span}}\) \( \newcommand{\AA}{\unicode[.8,0]{x212B}}\)
\( \newcommand{\vectorA}[1]{\vec{#1}} % arrow\)
\( \newcommand{\vectorAt}[1]{\vec{\text{#1}}} % arrow\)
\( \newcommand{\vectorB}[1]{\overset { \scriptstyle \rightharpoonup} {\mathbf{#1}} } \)
\( \newcommand{\vectorC}[1]{\textbf{#1}} \)
\( \newcommand{\vectorD}[1]{\overrightarrow{#1}} \)
\( \newcommand{\vectorDt}[1]{\overrightarrow{\text{#1}}} \)
\( \newcommand{\vectE}[1]{\overset{-\!-\!\rightharpoonup}{\vphantom{a}\smash{\mathbf {#1}}}} \)
\( \newcommand{\vecs}[1]{\overset { \scriptstyle \rightharpoonup} {\mathbf{#1}} } \)
\( \newcommand{\vecd}[1]{\overset{-\!-\!\rightharpoonup}{\vphantom{a}\smash {#1}}} \)
\(\newcommand{\avec}{\mathbf a}\) \(\newcommand{\bvec}{\mathbf b}\) \(\newcommand{\cvec}{\mathbf c}\) \(\newcommand{\dvec}{\mathbf d}\) \(\newcommand{\dtil}{\widetilde{\mathbf d}}\) \(\newcommand{\evec}{\mathbf e}\) \(\newcommand{\fvec}{\mathbf f}\) \(\newcommand{\nvec}{\mathbf n}\) \(\newcommand{\pvec}{\mathbf p}\) \(\newcommand{\qvec}{\mathbf q}\) \(\newcommand{\svec}{\mathbf s}\) \(\newcommand{\tvec}{\mathbf t}\) \(\newcommand{\uvec}{\mathbf u}\) \(\newcommand{\vvec}{\mathbf v}\) \(\newcommand{\wvec}{\mathbf w}\) \(\newcommand{\xvec}{\mathbf x}\) \(\newcommand{\yvec}{\mathbf y}\) \(\newcommand{\zvec}{\mathbf z}\) \(\newcommand{\rvec}{\mathbf r}\) \(\newcommand{\mvec}{\mathbf m}\) \(\newcommand{\zerovec}{\mathbf 0}\) \(\newcommand{\onevec}{\mathbf 1}\) \(\newcommand{\real}{\mathbb R}\) \(\newcommand{\twovec}[2]{\left[\begin{array}{r}#1 \\ #2 \end{array}\right]}\) \(\newcommand{\ctwovec}[2]{\left[\begin{array}{c}#1 \\ #2 \end{array}\right]}\) \(\newcommand{\threevec}[3]{\left[\begin{array}{r}#1 \\ #2 \\ #3 \end{array}\right]}\) \(\newcommand{\cthreevec}[3]{\left[\begin{array}{c}#1 \\ #2 \\ #3 \end{array}\right]}\) \(\newcommand{\fourvec}[4]{\left[\begin{array}{r}#1 \\ #2 \\ #3 \\ #4 \end{array}\right]}\) \(\newcommand{\cfourvec}[4]{\left[\begin{array}{c}#1 \\ #2 \\ #3 \\ #4 \end{array}\right]}\) \(\newcommand{\fivevec}[5]{\left[\begin{array}{r}#1 \\ #2 \\ #3 \\ #4 \\ #5 \\ \end{array}\right]}\) \(\newcommand{\cfivevec}[5]{\left[\begin{array}{c}#1 \\ #2 \\ #3 \\ #4 \\ #5 \\ \end{array}\right]}\) \(\newcommand{\mattwo}[4]{\left[\begin{array}{rr}#1 \amp #2 \\ #3 \amp #4 \\ \end{array}\right]}\) \(\newcommand{\laspan}[1]{\text{Span}\{#1\}}\) \(\newcommand{\bcal}{\cal B}\) \(\newcommand{\ccal}{\cal C}\) \(\newcommand{\scal}{\cal S}\) \(\newcommand{\wcal}{\cal W}\) \(\newcommand{\ecal}{\cal E}\) \(\newcommand{\coords}[2]{\left\{#1\right\}_{#2}}\) \(\newcommand{\gray}[1]{\color{gray}{#1}}\) \(\newcommand{\lgray}[1]{\color{lightgray}{#1}}\) \(\newcommand{\rank}{\operatorname{rank}}\) \(\newcommand{\row}{\text{Row}}\) \(\newcommand{\col}{\text{Col}}\) \(\renewcommand{\row}{\text{Row}}\) \(\newcommand{\nul}{\text{Nul}}\) \(\newcommand{\var}{\text{Var}}\) \(\newcommand{\corr}{\text{corr}}\) \(\newcommand{\len}[1]{\left|#1\right|}\) \(\newcommand{\bbar}{\overline{\bvec}}\) \(\newcommand{\bhat}{\widehat{\bvec}}\) \(\newcommand{\bperp}{\bvec^\perp}\) \(\newcommand{\xhat}{\widehat{\xvec}}\) \(\newcommand{\vhat}{\widehat{\vvec}}\) \(\newcommand{\uhat}{\widehat{\uvec}}\) \(\newcommand{\what}{\widehat{\wvec}}\) \(\newcommand{\Sighat}{\widehat{\Sigma}}\) \(\newcommand{\lt}{<}\) \(\newcommand{\gt}{>}\) \(\newcommand{\amp}{&}\) \(\definecolor{fillinmathshade}{gray}{0.9}\)The fact that there are two distinct kinds of planets—the rocky terrestrial planets and the gas-rich Jovian planets—leads us to believe that they formed under different conditions. Certainly their compositions are dominated by different elements. Let us look at each type in more detail.
The Giant Planets
The two largest planets, Jupiter and Saturn, have nearly the same chemical makeup as the Sun; they are composed primarily of the two elements hydrogen and helium, with 75% of their mass being hydrogen and 25% helium. On Earth, both hydrogen and helium are gases, so Jupiter and Saturn are sometimes called gas planets. But, this name is misleading. Jupiter and Saturn are so large that the gas is compressed in their interior until the hydrogen becomes a liquid. Because the bulk of both planets consists of compressed, liquefied hydrogen, we should really call them liquid planets.
Under the force of gravity, the heavier elements sink toward the inner parts of a liquid or gaseous planet. Both Jupiter and Saturn, therefore, have cores composed of heavier rock, metal, and ice, but we cannot see these regions directly. In fact, when we look down from above, all we see is the atmosphere with its swirling clouds (Figure \(\PageIndex{1}\)). We must infer the existence of the denser core inside these planets from studies of each planet’s gravity.

Uranus and Neptune are much smaller than Jupiter and Saturn, but each also has a core of rock, metal, and ice. Uranus and Neptune were less efficient at attracting hydrogen and helium gas, so they have much smaller atmospheres in proportion to their cores.
Chemically, each giant planet is dominated by hydrogen and its many compounds. Nearly all the oxygen present is combined chemically with hydrogen to form water (H2O). Chemists call such a hydrogen-dominated composition reduced. Throughout the outer solar system, we find abundant water (mostly in the form of ice) and reducing chemistry.
The Terrestrial Planets
The terrestrial planets are quite different from the giants. In addition to being much smaller, they are composed primarily of rocks and metals. These, in turn, are made of elements that are less common in the universe as a whole. The most abundant rocks, called silicates, are made of silicon and oxygen, and the most common metal is iron. We can tell from their densities that Mercury has the greatest proportion of metals (which are denser) and the Moon has the lowest. Earth, Venus, and Mars all have roughly similar bulk compositions: about one third of their mass consists of iron-nickel or iron-sulfur combinations; two thirds is made of silicates. Because these planets are largely composed of oxygen compounds (such as the silicate minerals of their crusts), their chemistry is said to be oxidized.
When we look at the internal structure of each of the terrestrial planets, we find that the densest metals are in a central core, with the lighter silicates near the surface. If these planets were liquid, like the giant planets, we could understand this effect as the result the sinking of heavier elements due to the pull of gravity. This leads us to conclude that, although the terrestrial planets are solid today, at one time they must have been hot enough to melt.
Differentiation is the process by which gravity helps separate a planet’s interior into layers of different compositions and densities. The heavier metals sink to form a core, while the lightest minerals float to the surface to form a crust. Later, when the planet cools, this layered structure is preserved. In order for a rocky planet to differentiate, it must be heated to the melting point of rocks, which is typically more than 1300 K.
Moons, Asteroids, and Comets
Chemically and structurally, Earth’s Moon is like the terrestrial planets, but most moons are in the outer solar system, and they have compositions similar to the cores of the giant planets around which they orbit. The three largest moons—Ganymede and Callisto in the Jovian system, and Titan in the Saturnian system—are composed half of frozen water, and half of rocks and metals. Most of these moons differentiated during formation, and today they have cores of rock and metal, with upper layers and crusts of very cold and—thus very hard—ice (Figure \(\PageIndex{2}\)).
Most of the asteroids and comets, as well as the smallest moons, were probably never heated to the melting point. However, some of the largest asteroids, such as Vesta, appear to be differentiated; others are fragments from differentiated bodies. Many of the smaller objects seem to be fragments or rubble piles that are the result of collisions. Because most asteroids and comets retain their original composition, they represent relatively unmodified material dating back to the time of the formation of the solar system. In a sense, they act as chemical fossils, helping us to learn about a time long ago whose traces have been erased on larger worlds.
Temperatures: Going to Extremes
Generally speaking, the farther a planet or moon is from the Sun, the cooler its surface. The planets are heated by the radiant energy of the Sun, which gets weaker with the square of the distance. You know how rapidly the heating effect of a fireplace or an outdoor radiant heater diminishes as you walk away from it; the same effect applies to the Sun. Mercury, the closest planet to the Sun, has a blistering surface temperature that ranges from 280–430 °C on its sunlit side, whereas the surface temperature on Pluto is only about –220 °C, colder than liquid air.
Mathematically, the temperatures decrease approximately in proportion to the square root of the distance from the Sun. Pluto is about 30 AU at its closest to the Sun (or 100 times the distance of Mercury) and about 49 AU at its farthest from the Sun. Thus, Pluto’s temperature is less than that of Mercury by the square root of 100, or a factor of 10: from 500 K to 50 K.
In addition to its distance from the Sun, the surface temperature of a planet can be influenced strongly by its atmosphere. Without our atmospheric insulation (the greenhouse effect, which keeps the heat in), the oceans of Earth would be permanently frozen. Conversely, if Mars once had a larger atmosphere in the past, it could have supported a more temperate climate than it has today. Venus is an even more extreme example, where its thick atmosphere of carbon dioxide acts as insulation, reducing the escape of heat built up at the surface, resulting in temperatures greater than those on Mercury. Today, Earth is the only planet where surface temperatures generally lie between the freezing and boiling points of water. As far as we know, Earth is the only planet to support life.
Dating Planetary Surfaces
How do we know the age of the surfaces we see on planets and moons? If a world has a surface (as opposed to being mostly gas and liquid), astronomers have developed some techniques for estimating how long ago that surface solidified. Note that the age of these surfaces is not necessarily the age of the planet as a whole. On geologically active objects (including Earth), vast outpourings of molten rock or the erosive effects of water and ice, which we call planet weathering, have erased evidence of earlier epochs and present us with only a relatively young surface for investigation.
One way to estimate the age of a surface is by counting the number of impact craters. This technique works because the rate at which impacts have occurred in the solar system has been roughly constant for several billion years. Thus, in the absence of forces to eliminate craters, the number of craters is simply proportional to the length of time the surface has been exposed. This technique has been applied successfully to many solid planets and moons (Figure \(\PageIndex{3}\)).

Bear in mind that crater counts can tell us only the time since the surface experienced a major change that could modify or erase preexisting craters. Estimating ages from crater counts is a little like walking along a sidewalk in a snowstorm after the snow has been falling steadily for a day or more. You may notice that in front of one house the snow is deep, while next door the sidewalk may be almost clear. Do you conclude that less snow has fallen in front of Ms. Jones’ house than Mr. Smith’s? More likely, you conclude that Jones has recently swept the walk clean and Smith has not. Similarly, the numbers of craters indicate how long it has been since a planetary surface was last “swept clean” by ongoing lava flows or by molten materials ejected when a large impact happened nearby.
Still, astronomers can use the numbers of craters on different parts of the same world to provide important clues about how regions on that world evolved. On a given planet or moon, the more heavily cratered terrain will generally be older (that is, more time will have elapsed there since something swept the region clean).
Radioactive Rocks
Another way to trace the history of a solid world is to measure the age of individual rocks. After samples were brought back from the Moon by Apollo astronauts, the techniques that had been developed to date rocks on Earth were applied to rock samples from the Moon to establish a geological chronology for the Moon. Furthermore, a few samples of material from the Moon, Mars, and the large asteroid Vesta have fallen to Earth as meteorites and can be examined directly.
Scientists measure the age of rocks using the properties of natural radioactivity. Around the beginning of the twentieth century, physicists began to understand that some atomic nuclei are not stable but can split apart (decay) spontaneously into smaller nuclei. The process of radioactive decay involves the emission of particles such as electrons, or of radiation in the form of gamma rays.
For any one radioactive nucleus, it is not possible to predict when the decay process will happen. Such decay is random in nature, like the throw of dice: as gamblers have found all too often, it is impossible to say just when the dice will come up 7 or 11. But, for a very large number of dice tosses, we can calculate the odds that 7 or 11 will come up. Similarly, if we have a very large number of radioactive atoms of one type (say, uranium), there is a specific time period, called its half-life, during which the chances are fifty-fifty that decay will occur for any of the nuclei.
A particular nucleus may last a shorter or longer time than its half-life, but in a large sample, almost exactly half of the nuclei will have decayed after a time equal to one half-life. Half of the remaining nuclei will have decayed after two half-lives pass, leaving only one half of a half—or one quarter—of the original sample (Figure \(\PageIndex{4}\)).
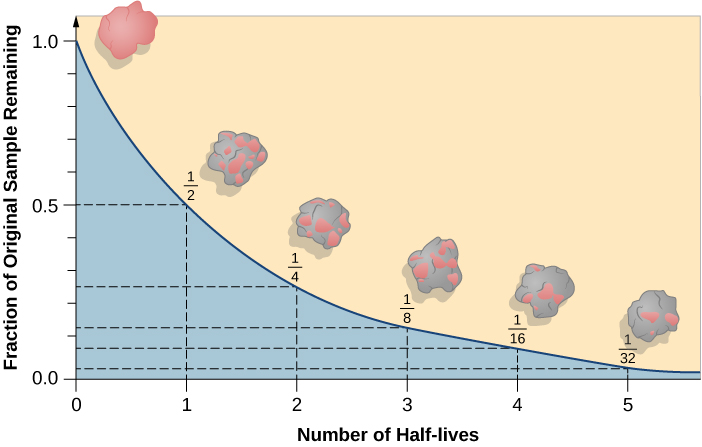
If you had 1 gram of pure radioactive nuclei with a half-life of 100 years, then after 100 years you would have
1/2 gram; after 200 years, 1/4 gram; after 300 years, only 1/8 gram; and so forth. However, the material does not disappear. Instead, the radioactive atoms are replaced with their decay products. Sometimes the radioactive atoms are called parents and the decay products are called daughter elements.
In this way, radioactive elements with half-lives we have determined can provide accurate nuclear clocks. By comparing how much of a radioactive parent element is left in a rock to how much of its daughter products have accumulated, we can learn how long the decay process has been going on and hence how long ago the rock formed. Table \(\PageIndex{1}\) summarizes the decay reactions used most often to date lunar and terrestrial rocks.
| Parent | Daughter | Half-Life (billions of years) |
|---|---|---|
| Samarium-147 | Neodymium-143 | 106 |
| Rubidium-87 | Strontium-87 | 48.8 |
| Thorium-232 | Lead-208 | 14.0 |
| Uranium-238 | Lead-206 | 4.47 |
| Potassium-40 | Argon-40 | 1.31 |
When astronauts first flew to the Moon, one of their most important tasks was to bring back lunar rocks for radioactive age-dating. Until then, astronomers and geologists had no reliable way to measure the age of the lunar surface. Counting craters had let us calculate relative ages (for example, the heavily cratered lunar highlands were older than the dark lava plains), but scientists could not measure the actual age in years. Some thought that the ages were as young as those of Earth’s surface, which has been resurfaced by many geological events. For the Moon’s surface to be so young would imply active geology on our satellite. Only in 1969, when the first Apollo samples were dated, did we learn that the Moon is an ancient, geologically dead world. Using such dating techniques, we have been able to determine the ages of both Earth and the Moon: each was formed about 4.5 billion years ago (although, as we shall see, Earth probably formed earlier than the Moon).
We should also note that the decay of radioactive nuclei generally releases energy in the form of heat. Although the energy from a single nucleus is not very large (in human terms), the enormous numbers of radioactive nuclei in a planet or moon (especially early in its existence) can be a significant source of internal energy for that world. Geologists estimate that about half of Earth’s current internal heat budget comes from the decay of radioactive isotopes in its interior.
Footnotes
- 4 The number after each element is its atomic weight, equal to the number of protons plus neutrons in its nucleus. This specifies the isotope of the element; different isotopes of the same element differ in the number of neutrons.