
8.5: Climate Change
- Page ID
- 4514

\( \newcommand{\vecs}[1]{\overset { \scriptstyle \rightharpoonup} {\mathbf{#1}} } \)
\( \newcommand{\vecd}[1]{\overset{-\!-\!\rightharpoonup}{\vphantom{a}\smash {#1}}} \)
\( \newcommand{\dsum}{\displaystyle\sum\limits} \)
\( \newcommand{\dint}{\displaystyle\int\limits} \)
\( \newcommand{\dlim}{\displaystyle\lim\limits} \)
\( \newcommand{\id}{\mathrm{id}}\) \( \newcommand{\Span}{\mathrm{span}}\)
( \newcommand{\kernel}{\mathrm{null}\,}\) \( \newcommand{\range}{\mathrm{range}\,}\)
\( \newcommand{\RealPart}{\mathrm{Re}}\) \( \newcommand{\ImaginaryPart}{\mathrm{Im}}\)
\( \newcommand{\Argument}{\mathrm{Arg}}\) \( \newcommand{\norm}[1]{\| #1 \|}\)
\( \newcommand{\inner}[2]{\langle #1, #2 \rangle}\)
\( \newcommand{\Span}{\mathrm{span}}\)
\( \newcommand{\id}{\mathrm{id}}\)
\( \newcommand{\Span}{\mathrm{span}}\)
\( \newcommand{\kernel}{\mathrm{null}\,}\)
\( \newcommand{\range}{\mathrm{range}\,}\)
\( \newcommand{\RealPart}{\mathrm{Re}}\)
\( \newcommand{\ImaginaryPart}{\mathrm{Im}}\)
\( \newcommand{\Argument}{\mathrm{Arg}}\)
\( \newcommand{\norm}[1]{\| #1 \|}\)
\( \newcommand{\inner}[2]{\langle #1, #2 \rangle}\)
\( \newcommand{\Span}{\mathrm{span}}\) \( \newcommand{\AA}{\unicode[.8,0]{x212B}}\)
\( \newcommand{\vectorA}[1]{\vec{#1}} % arrow\)
\( \newcommand{\vectorAt}[1]{\vec{\text{#1}}} % arrow\)
\( \newcommand{\vectorB}[1]{\overset { \scriptstyle \rightharpoonup} {\mathbf{#1}} } \)
\( \newcommand{\vectorC}[1]{\textbf{#1}} \)
\( \newcommand{\vectorD}[1]{\overrightarrow{#1}} \)
\( \newcommand{\vectorDt}[1]{\overrightarrow{\text{#1}}} \)
\( \newcommand{\vectE}[1]{\overset{-\!-\!\rightharpoonup}{\vphantom{a}\smash{\mathbf {#1}}}} \)
\( \newcommand{\vecs}[1]{\overset { \scriptstyle \rightharpoonup} {\mathbf{#1}} } \)
\(\newcommand{\longvect}{\overrightarrow}\)
\( \newcommand{\vecd}[1]{\overset{-\!-\!\rightharpoonup}{\vphantom{a}\smash {#1}}} \)
\(\newcommand{\avec}{\mathbf a}\) \(\newcommand{\bvec}{\mathbf b}\) \(\newcommand{\cvec}{\mathbf c}\) \(\newcommand{\dvec}{\mathbf d}\) \(\newcommand{\dtil}{\widetilde{\mathbf d}}\) \(\newcommand{\evec}{\mathbf e}\) \(\newcommand{\fvec}{\mathbf f}\) \(\newcommand{\nvec}{\mathbf n}\) \(\newcommand{\pvec}{\mathbf p}\) \(\newcommand{\qvec}{\mathbf q}\) \(\newcommand{\svec}{\mathbf s}\) \(\newcommand{\tvec}{\mathbf t}\) \(\newcommand{\uvec}{\mathbf u}\) \(\newcommand{\vvec}{\mathbf v}\) \(\newcommand{\wvec}{\mathbf w}\) \(\newcommand{\xvec}{\mathbf x}\) \(\newcommand{\yvec}{\mathbf y}\) \(\newcommand{\zvec}{\mathbf z}\) \(\newcommand{\rvec}{\mathbf r}\) \(\newcommand{\mvec}{\mathbf m}\) \(\newcommand{\zerovec}{\mathbf 0}\) \(\newcommand{\onevec}{\mathbf 1}\) \(\newcommand{\real}{\mathbb R}\) \(\newcommand{\twovec}[2]{\left[\begin{array}{r}#1 \\ #2 \end{array}\right]}\) \(\newcommand{\ctwovec}[2]{\left[\begin{array}{c}#1 \\ #2 \end{array}\right]}\) \(\newcommand{\threevec}[3]{\left[\begin{array}{r}#1 \\ #2 \\ #3 \end{array}\right]}\) \(\newcommand{\cthreevec}[3]{\left[\begin{array}{c}#1 \\ #2 \\ #3 \end{array}\right]}\) \(\newcommand{\fourvec}[4]{\left[\begin{array}{r}#1 \\ #2 \\ #3 \\ #4 \end{array}\right]}\) \(\newcommand{\cfourvec}[4]{\left[\begin{array}{c}#1 \\ #2 \\ #3 \\ #4 \end{array}\right]}\) \(\newcommand{\fivevec}[5]{\left[\begin{array}{r}#1 \\ #2 \\ #3 \\ #4 \\ #5 \\ \end{array}\right]}\) \(\newcommand{\cfivevec}[5]{\left[\begin{array}{c}#1 \\ #2 \\ #3 \\ #4 \\ #5 \\ \end{array}\right]}\) \(\newcommand{\mattwo}[4]{\left[\begin{array}{rr}#1 \amp #2 \\ #3 \amp #4 \\ \end{array}\right]}\) \(\newcommand{\laspan}[1]{\text{Span}\{#1\}}\) \(\newcommand{\bcal}{\cal B}\) \(\newcommand{\ccal}{\cal C}\) \(\newcommand{\scal}{\cal S}\) \(\newcommand{\wcal}{\cal W}\) \(\newcommand{\ecal}{\cal E}\) \(\newcommand{\coords}[2]{\left\{#1\right\}_{#2}}\) \(\newcommand{\gray}[1]{\color{gray}{#1}}\) \(\newcommand{\lgray}[1]{\color{lightgray}{#1}}\) \(\newcommand{\rank}{\operatorname{rank}}\) \(\newcommand{\row}{\text{Row}}\) \(\newcommand{\col}{\text{Col}}\) \(\renewcommand{\row}{\text{Row}}\) \(\newcommand{\nul}{\text{Nul}}\) \(\newcommand{\var}{\text{Var}}\) \(\newcommand{\corr}{\text{corr}}\) \(\newcommand{\len}[1]{\left|#1\right|}\) \(\newcommand{\bbar}{\overline{\bvec}}\) \(\newcommand{\bhat}{\widehat{\bvec}}\) \(\newcommand{\bperp}{\bvec^\perp}\) \(\newcommand{\xhat}{\widehat{\xvec}}\) \(\newcommand{\vhat}{\widehat{\vvec}}\) \(\newcommand{\uhat}{\widehat{\uvec}}\) \(\newcommand{\what}{\widehat{\wvec}}\) \(\newcommand{\Sighat}{\widehat{\Sigma}}\) \(\newcommand{\lt}{<}\) \(\newcommand{\gt}{>}\) \(\newcommand{\amp}{&}\) \(\definecolor{fillinmathshade}{gray}{0.9}\)If one thing has been constant about Earth’s climate over geological time, it is its constant change. In the geological record, we can see this in the evidence of glaciations in the distant past, and we can also detect periods of extreme warmth by looking at the isotope composition of seafloor sediments. Not only has the climate changed frequently, the temperature fluctuations have been very significant. Today’s mean global temperature is about 15°C. However, during its coldest periods, the global mean was as cold as -50°C, while at various times during the Paleozoic and Mesozoic and during the Paleocene–Eocene thermal maximum, it was close to 30°C.
There are two parts to climate change, the first one is known as climate forcing, which is when conditions change to give the climate a little nudge in one direction or the other. The second part of climate change, and the one that typically does most of the work, is what we call a feedback. When a climate forcing changes the climate a little, a whole series of environmental changes take place, many of which either exaggerate the initial change (positive feedback), or suppress the change (negative feedback).
An example of a climate forcing mechanism is the increase in the amount of carbon dioxide (CO2) in the atmosphere that results from our use of fossil fuels. CO2 traps heat in the atmosphere and leads to climate warming. Warming changes vegetation patterns; contributes to the melting of snow, ice, and permafrost; causes sea level to rise; reduces the solubility of CO2 in sea water; and has a number of other minor effects. Most of these changes contribute to more warming. Melting of permafrost, for example, is a strong positive feedback because frozen soil contains trapped organic matter that is converted to CO2 and methane (CH4) when the soil thaws. Both these gases accumulate in the atmosphere and add to the warming effect. On the other hand, if warming causes more vegetation growth, that vegetation should absorb CO2, thus reducing the warming effect, which would be a negative feedback. Under our current conditions — a planet that still has lots of glacial ice and permafrost — most of the feedbacks that result from a warming climate are positive feedbacks and so the climate changes that we cause get naturally amplified by natural processes.
Natural Climate Forcing
Natural climate forcing has been going on throughout geological time. A wide range of processes has been operating at widely different time scales, from a few years to billions of years. The longest-term natural forcing variation is related to the evolution of the Sun. Like most other stars of a similar mass, our Sun is evolving. For the past 4.6 billion years, its rate of nuclear fusion has been increasing, and it is now emitting about 40% more energy (as light) than it did at the beginning of geological time. A difference of 40% is big, so it’s a little surprising that the temperature on Earth has remained at a reasonable and habitable temperature for all of this time. The mechanism for that relative climate stability has been the evolution of our atmosphere from one that was dominated by CO2, and also had significant levels of CH4 — both greenhouse gasses — to one with only a few hundred parts per million of CO2 and just under 1 part per million of CH4. Those changes to our atmosphere have been no accident; over geological time, life and its metabolic processes have evolved (such as the evolution of photosynthetic bacteria that consume CO2) and changed the atmosphere to conditions that remained cool enough to be habitable.
The position of the Earth relative to the Sun is another important component of natural climate forcing. Earth’s orbit around the Sun is nearly circular, but like all physical systems, it has natural oscillations. First, the shape of the orbit changes on a regular time scale (close to 100,000 years) from being close to circular to being very slightly elliptical. But the circularity of the orbit is not what matters; it is the fact that as the orbit becomes more elliptical, the position of the Sun within that ellipse becomes less central or more eccentric (Figure \(\PageIndex{1}\)a). Eccentricity is important because when it is high, the Earth-Sun distance varies more from season to season than it does when eccentricity is low.
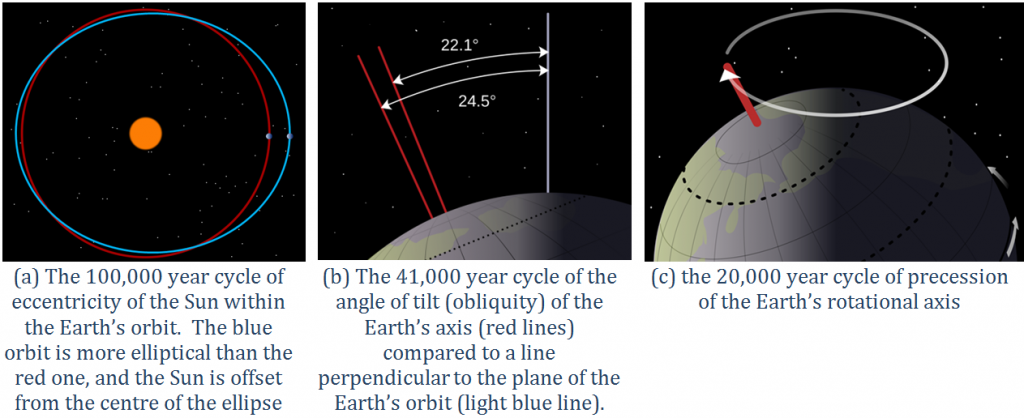
Second, Earth rotates around an axis through the North and South Poles, and that axis is at an angle to the plane of Earth’s orbit around the Sun (Figure \(\PageIndex{1}\)b). The angle of tilt (also known as obliquity) varies on a time scale of 41,000 years. When the angle is at its maximum (24.5°), Earth’s seasonal differences are accentuated. When the angle is at its minimum (22.1°), seasonal differences are minimized. The current hypothesis is that glaciation is favored at low seasonal differences as summers would be cooler and snow would be less likely to melt and more likely to accumulate from year to year. Third, the direction in which Earth’s rotational axis points also varies, on a time scale of about 20,000 years (Figure \(\PageIndex{1}\)c). This variation, known as precession, means that although the North Pole is presently pointing to the star Polaris (the pole star), in 10,000 years it will point to the star Vega. The importance of eccentricity, tilt, and precession to Earth’s climate cycles (now known as Milankovitch Cycles) was first pointed out by Yugoslavian engineer and mathematician Milutin Milankovitch in the early 1900s. Milankovitch recognized that although the variations in the orbital cycles did not affect the total amount of insolation (light energy from the Sun) that Earth received, it did affect where on Earth that energy was strongest.
Volcanic eruptions don’t just involve lava flows and exploding rock fragments; various particulates and gases are also released, the important ones being sulphur dioxide and CO2. Sulphur dioxide is an aerosol that reflects incoming solar radiation and has a net cooling effect that is short lived (a few years in most cases, as the particulates settle out of the atmosphere within a couple of years), and doesn’t typically contribute to longer-term climate change. Volcanic CO2 emissions can contribute to climate warming but only if a greater-than-average level of volcanism is sustained over a long time (at least tens of thousands of years). It is widely believed that the catastrophic end-Permian extinction (at 250 Ma) resulted from warming initiated by the eruption of the massive Siberian Traps over a period of at least a million years.
Ocean currents are important to climate, and currents also have a tendency to oscillate. Glacial ice cores show clear evidence of changes in the Gulf Stream that affected global climate on a time scale of about 1,500 years during the last glaciation. The east-west changes in sea-surface temperature and surface pressure in the equatorial Pacific Ocean, known as the El Niño Southern Oscillation or ENSO (see section 9.6) varies on a much shorter time scale of between two and seven years. These variations tend to garner the attention of the public because they have significant climate implications in many parts of the world. The strongest El Niños in recent decades were in 1983, 1998, and 2015 and those were very warm years from a global perspective. During a strong El Niño, the equatorial Pacific sea-surface temperatures are warmer than normal and heat the atmosphere above the ocean, which leads to warmer-than-average global temperatures.
Climate Feedbacks
As already stated, climate feedbacks are critically important in amplifying weak climate forcings into full-blown climate changes. Since Earth still has a very large volume of ice, mostly in the continental ice sheets of Antarctica and Greenland, but also in alpine glaciers and permafrost, melting is one of the key feedback mechanisms. Melting of ice and snow leads to several different types of feedbacks, an important one being a change in albedo, or the reflectivity of a surface. Earth’s various surfaces have widely differing albedos, expressed as the percentage of light that reflects off a given material. This is important because most solar energy that hits a very reflective surface is not absorbed and therefore does little to warm Earth. Water in the oceans or on a lake is one of the darkest surfaces, reflecting less than 10% of the incident light, while clouds and snow or ice are among the brightest surfaces, reflecting 70% to 90% of the incident light. When sea ice melts, as it has done in the Arctic Ocean at a disturbing rate over the past decade, the albedo of the area affected changes dramatically, from around 80% down to less than 10%. Much more solar energy is absorbed by the water than by the pre-existing ice, and the temperature increase is amplified. The same applies to ice and snow on land, but the difference in albedo is not as great. When ice and snow on land melt, sea level rises. (Sea level is also rising because the oceans are warming and that increases their volume; see section 13.7). A higher sea level means a larger proportion of the planet is covered with water, and since water has a lower albedo than land, more heat is absorbed and the temperature goes up a little more. Since the last glaciation, sea-level rise has been about 125 m; a huge area that used to be land is now flooded by heat-absorbent seawater. During the current period of anthropogenic climate change, sea level has risen only about 20 cm, and although that doesn’t make a big change to albedo, sea-level rise is accelerating.
Most of northern Canada, Alaska, Russia, and Scandinavia has a layer of permafrost that ranges from a few centimeters to hundreds of meters in thickness. Permafrost is a mixture of soil and ice and it also contains a significant amount of trapped organic carbon that is released as CO2 and CH4 when the permafrost breaks down. Because the amount of carbon stored in permafrost is in the same order of magnitude as the amount released by burning fossil fuels, this is a feedback mechanism that has the potential to equal or surpass the forcing that has unleashed it. In some polar regions, including northern Canada, permafrost includes methane hydrate, a highly concentrated form of CH4 trapped in solid form. Breakdown of permafrost releases this CH4. Even larger reserves of methane hydrate exist on the seafloor, and while it would take significant warming of ocean water down to a depth of hundreds of meters, this too is likely to happen in the future if we don’t limit our impact on the climate. There is strong isotopic evidence that the Paleocene–Eocene thermal maximum was caused, at least in part, by a massive release of sea-floor methane hydrate.
There is about 45 times as much carbon in the ocean (as dissolved bicarbonate ions, HCO3–) as there is in the atmosphere (as CO2), and there is a steady exchange of carbon between the two reservoirs (see section 5.5). But the solubility of CO2 in water decreases as the temperature goes up. In other words, the warmer it gets, the more oceanic bicarbonate that gets transferred to the atmosphere as CO2. That makes CO2 solubility another positive feedback mechanism. Vegetation growth responds positively to both increased temperatures and elevated CO2 levels, and so in general, it represents a negative feedback to climate change because the more the vegetation grows, the more CO2 is taken from the atmosphere. But it’s not quite that simple, because when trees grow bigger and more vigorously, forests become darker (they have lower albedo) so they absorb more heat. Furthermore, climate warming isn’t necessarily good for vegetation growth; some areas have become too hot, too dry, or even too wet to support the plant community that was growing there, and it might take centuries for something to replace it successfully. All of these positive (and negative) feedbacks work both ways. For example, during climate cooling, growth of glaciers leads to higher albedos, and formation of permafrost results in storage of carbon that would otherwise have returned quickly to the atmosphere.
Anthropogenic Climate Change
When we talk about anthropogenic climate change, we are generally thinking of the industrial era, which really got going when we started using fossil fuels (coal to begin with, and later oil and natural gas) to drive machinery and trains, and to generate electricity. That was around the middle of the 18th century. The issue with fossil fuels is that they involve burning carbon that was naturally stored in the crust over hundreds of millions of years as part of Earth’s process of counteracting the warming Sun.
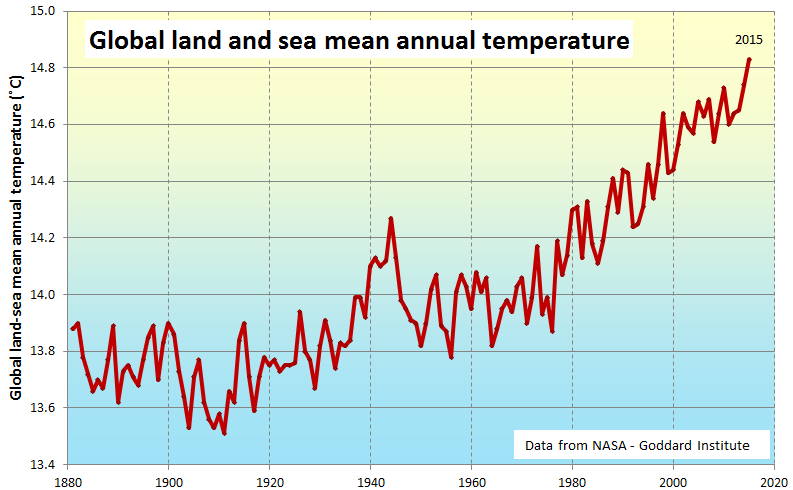
A rapidly rising population, the escalating level of industrialization and mechanization of our lives, and an increasing dependence on fossil fuels have driven the anthropogenic climate change of the past century. The trend of mean global temperatures since 1880 is shown in Figure \(\PageIndex{2}\). For approximately the past 55 years, the temperature has increased at a relatively steady and disturbingly rapid rate, especially compared to past changes. The average temperature now is approximately 0.8°C higher than before industrialization, and two-thirds of this warming has occurred since 1975.
The Intergovernmental Panel on Climate Change (IPCC), established by the United Nations in 1988, is responsible for reviewing the scientific literature on climate change and issuing periodic reports on several topics, including the scientific basis for understanding climate change, our vulnerability to observed and predicted climate changes, and what we can do to limit climate change and minimize its impacts. Figure \(\PageIndex{3}\), from the fifth report of the IPCC, issued in 2014, shows the relative contributions of various greenhouse gases and other factors to current climate forcing, based on the changes from levels that existed in 1750.
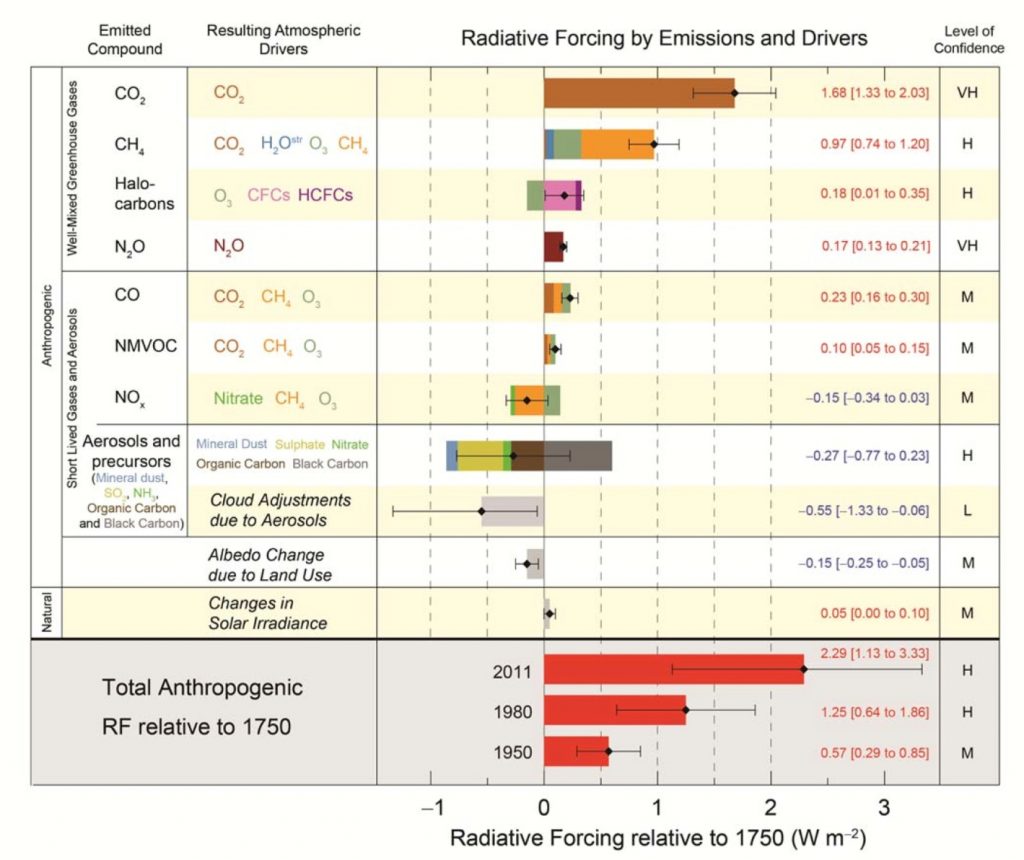
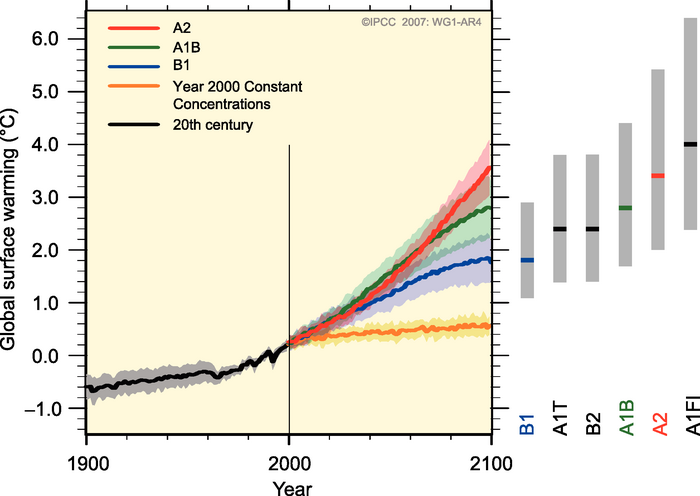
The biggest anthropogenic contributor to warming is the emission of CO2, which accounts for 50% of positive forcing. CH4 and its atmospheric derivatives (CO2, H2O, and O3) account for 29%, and the halocarbon gases (mostly leaked from air-conditioning appliances) and nitrous oxide (N2O) (from burning fossils fuels) account for 5% each. Carbon monoxide (CO) (also produced by burning fossil fuels) accounts for 7%, and the volatile organic compounds other than methane (NMVOC) account for 3%. CO2 emissions come mostly from coal- and gas-fired power stations, motorized vehicles (cars, trucks, and aircraft), and industrial operations (e.g., smelting), and indirectly from forestry. CH4 emissions come from production of fossil fuels (escape from coal mining and from gas and oil production), livestock farming (mostly beef), landfills, and wetland rice farming. N2O and CO come mostly from the combustion of fossil fuels. In summary, close to 70% of our current greenhouse gas emissions come from fossil fuel production and use, while most of the rest comes from agriculture and landfills. Figure \(\PageIndex{4}\) shows the IPCC’s projections for temperature increases over the next 100 years as a result of these increasing greenhouse gases.
Impacts of Climate Change
We’ve all experienced the effects of climate change over the past decade. However, it’s not straightforward for climatologists to make the connection between a warming climate and specific weather events, and most are justifiably reluctant to ascribe any specific event to climate change. In this respect, the best measures of climate change are those that we can detect over several decades, such as the temperature changes shown in Figure \(\PageIndex{2}\), or the sea level rise shown in Figure \(\PageIndex{5}\). As already stated, sea level has risen approximately 20 cm since 1750, and that rise is attributed to both warming (and therefore expanding) seawater and melting glaciers and other land-based snow and ice (melting of sea ice does not contribute directly to sea level rise as it is already floating in the ocean, see section 13.7).
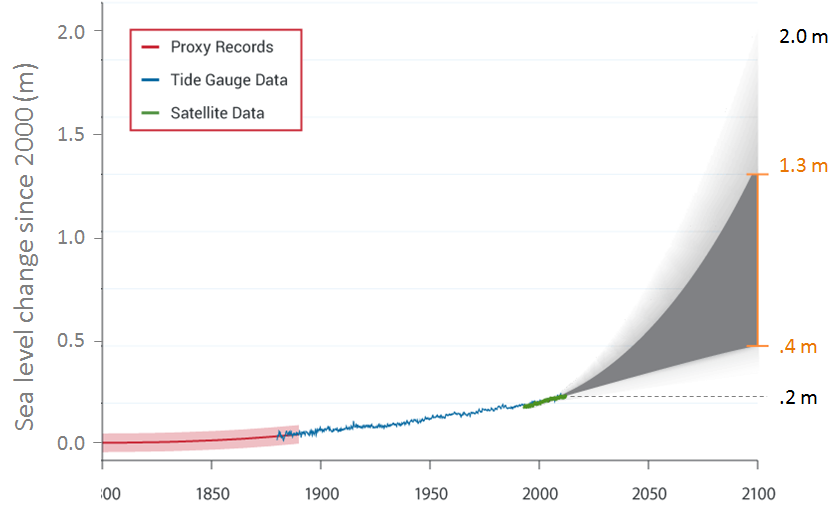
Projections for sea level rise to the end of this century vary widely. This is in large part because we do not know which of the above climate change scenarios (Figure \(\PageIndex{4}\)) we will most closely follow, but many are in the range from 0.5 m to 2.0 m. One of the problems in predicting sea level rise is that we do not have a strong understanding of how large ice sheets, such as Greenland and Antarctica, will respond to future warming. Another issue is that the oceans don’t respond immediately to warming. For example, with the current amount of warming, we are already committed to a future sea level rise of between 1.3 m and 1.9 m, even if we could stop climate change today. This is because it takes decades to centuries for the existing warming of the atmosphere to be transmitted to depth within the oceans and to exert its full impact on large glaciers. Most of that committed rise would take place over the next century, but some would be delayed longer. And for every decade that the current rates of climate change continue, that number increases by another 0.3 m. In other words, if we don’t make changes quickly, by the end of this century we’ll be locked into 3 m of future sea level rise. In a 2008 report, the Organization for Economic Co-operation and Development (OECD) estimated that by 2070 approximately 150 million people living in coastal areas could be at risk of flooding due to the combined effects of sea level rise, increased storm intensity, and land subsidence. The assets at risk (buildings, roads, bridges, ports, etc.) are in the order of $35 trillion ($35,000,000,000,000). Countries with the greatest exposure of population to flooding are China, India, Bangladesh, Vietnam, U.S.A., Japan, and Thailand. Some of the major cities at risk include Shanghai, Guangzhou, Mumbai, Kolkata, Dhaka, Ho Chi Minh City, Tokyo, Miami, and New York.
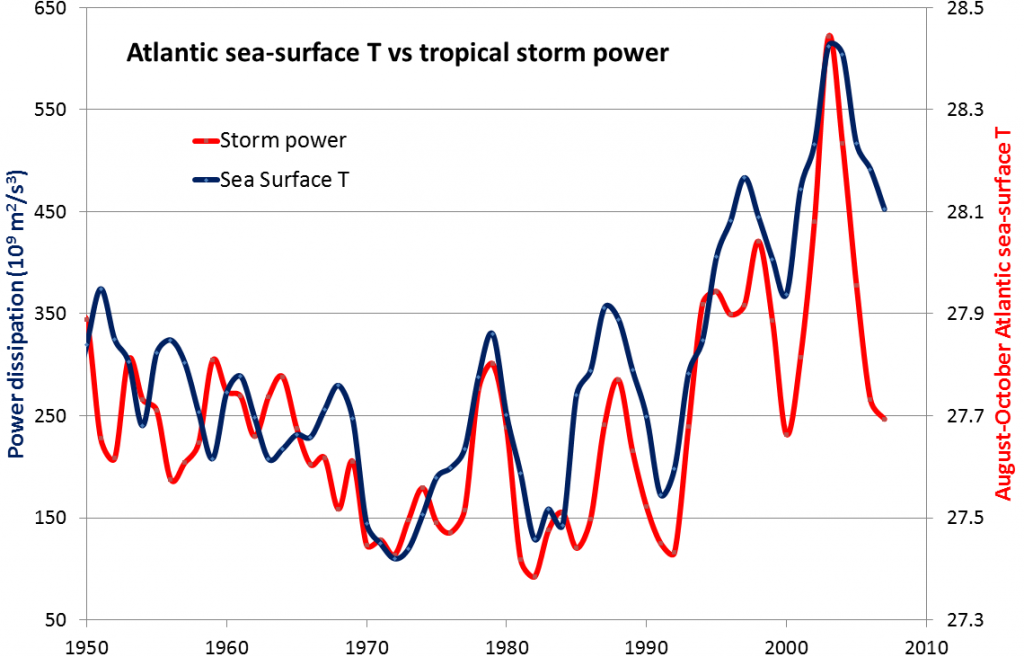
One of the other risks for coastal populations, besides sea level rise, is that climate warming is also associated with an increase in the intensity of tropical storms (e.g., hurricanes or typhoons; see section 8.4), which almost always bring serious flooding from intense rain and storm surges. Some recent examples are New Orleans in 2005 with Hurricane Katrina, and New Jersey and New York in 2012 with Hurricane Sandy. Tropical storms get their energy from the evaporation of warm seawater in tropical regions. In the Atlantic Ocean, this takes place between 8° and 20° N in the summer. Figure \(\PageIndex{6}\) shows the variations in the sea-surface temperature (SST) of the tropical Atlantic Ocean (in blue) versus the amount of power represented by Atlantic hurricanes between 1950 and 2008 (in red). Not only has the overall intensity of Atlantic hurricanes increased with the warming since 1975, but the correlation between hurricanes and sea-surface temperatures is very strong over that time period.
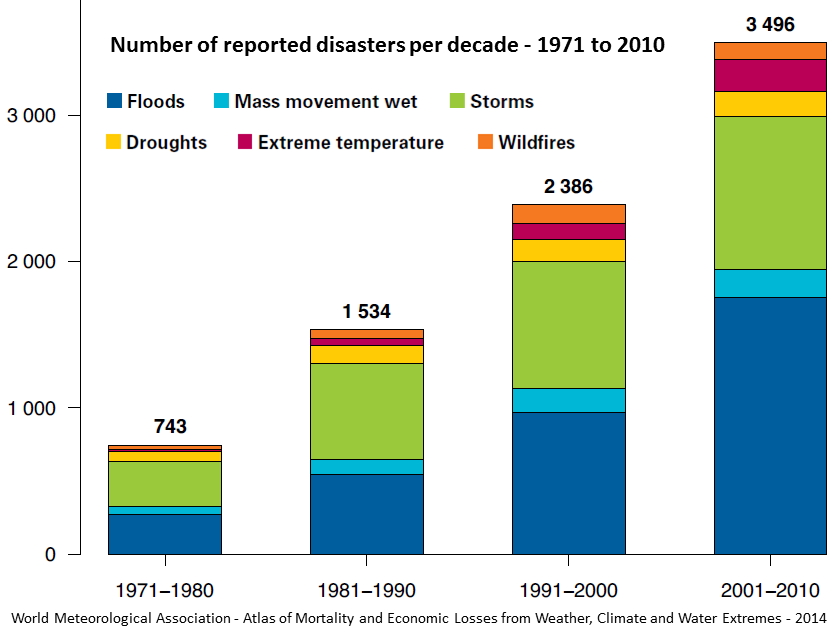
The geographical ranges of diseases and pests, especially those caused or transmitted by insects, have been shown to extend toward temperate regions because of climate change. West Nile virus and Lyme disease are two examples that already directly affect North Americans, while dengue fever could be an issue in the future (dengue became a “nationally notifiable condition” in the United States in 2010). For several weeks in July and August of 2010, a massive heat wave affected western Russia, especially the area southeast of Moscow, and scientists have stated that climate change was a contributing factor. Temperatures soared to over 40°C, as much as 12°C above normal over a wide area, and wildfires raged in many parts of the country. Over 55,000 deaths are attributed to the heat and to respiratory problems associated with the fires. A summary of the impacts of climate change on natural disasters is given in Figure \(\PageIndex{7}\). The major types of disasters related to climate are floods and storms, but the health implications of extreme temperatures are also becoming a great concern. In the decade 1971 to 1980, extreme temperatures were the fifth most common natural disasters; by 2001 to 2010, they were the third most common.
*”Physical Geology” by Steven Earle used under a CC-BY 4.0 international license. Download this book for free at http://open.bccampus.ca