2.1: Front Matter
- Page ID
- 14777
\( \newcommand{\vecs}[1]{\overset { \scriptstyle \rightharpoonup} {\mathbf{#1}} } \)
\( \newcommand{\vecd}[1]{\overset{-\!-\!\rightharpoonup}{\vphantom{a}\smash {#1}}} \)
\( \newcommand{\id}{\mathrm{id}}\) \( \newcommand{\Span}{\mathrm{span}}\)
( \newcommand{\kernel}{\mathrm{null}\,}\) \( \newcommand{\range}{\mathrm{range}\,}\)
\( \newcommand{\RealPart}{\mathrm{Re}}\) \( \newcommand{\ImaginaryPart}{\mathrm{Im}}\)
\( \newcommand{\Argument}{\mathrm{Arg}}\) \( \newcommand{\norm}[1]{\| #1 \|}\)
\( \newcommand{\inner}[2]{\langle #1, #2 \rangle}\)
\( \newcommand{\Span}{\mathrm{span}}\)
\( \newcommand{\id}{\mathrm{id}}\)
\( \newcommand{\Span}{\mathrm{span}}\)
\( \newcommand{\kernel}{\mathrm{null}\,}\)
\( \newcommand{\range}{\mathrm{range}\,}\)
\( \newcommand{\RealPart}{\mathrm{Re}}\)
\( \newcommand{\ImaginaryPart}{\mathrm{Im}}\)
\( \newcommand{\Argument}{\mathrm{Arg}}\)
\( \newcommand{\norm}[1]{\| #1 \|}\)
\( \newcommand{\inner}[2]{\langle #1, #2 \rangle}\)
\( \newcommand{\Span}{\mathrm{span}}\) \( \newcommand{\AA}{\unicode[.8,0]{x212B}}\)
\( \newcommand{\vectorA}[1]{\vec{#1}} % arrow\)
\( \newcommand{\vectorAt}[1]{\vec{\text{#1}}} % arrow\)
\( \newcommand{\vectorB}[1]{\overset { \scriptstyle \rightharpoonup} {\mathbf{#1}} } \)
\( \newcommand{\vectorC}[1]{\textbf{#1}} \)
\( \newcommand{\vectorD}[1]{\overrightarrow{#1}} \)
\( \newcommand{\vectorDt}[1]{\overrightarrow{\text{#1}}} \)
\( \newcommand{\vectE}[1]{\overset{-\!-\!\rightharpoonup}{\vphantom{a}\smash{\mathbf {#1}}}} \)
\( \newcommand{\vecs}[1]{\overset { \scriptstyle \rightharpoonup} {\mathbf{#1}} } \)
\( \newcommand{\vecd}[1]{\overset{-\!-\!\rightharpoonup}{\vphantom{a}\smash {#1}}} \)
\(\newcommand{\avec}{\mathbf a}\) \(\newcommand{\bvec}{\mathbf b}\) \(\newcommand{\cvec}{\mathbf c}\) \(\newcommand{\dvec}{\mathbf d}\) \(\newcommand{\dtil}{\widetilde{\mathbf d}}\) \(\newcommand{\evec}{\mathbf e}\) \(\newcommand{\fvec}{\mathbf f}\) \(\newcommand{\nvec}{\mathbf n}\) \(\newcommand{\pvec}{\mathbf p}\) \(\newcommand{\qvec}{\mathbf q}\) \(\newcommand{\svec}{\mathbf s}\) \(\newcommand{\tvec}{\mathbf t}\) \(\newcommand{\uvec}{\mathbf u}\) \(\newcommand{\vvec}{\mathbf v}\) \(\newcommand{\wvec}{\mathbf w}\) \(\newcommand{\xvec}{\mathbf x}\) \(\newcommand{\yvec}{\mathbf y}\) \(\newcommand{\zvec}{\mathbf z}\) \(\newcommand{\rvec}{\mathbf r}\) \(\newcommand{\mvec}{\mathbf m}\) \(\newcommand{\zerovec}{\mathbf 0}\) \(\newcommand{\onevec}{\mathbf 1}\) \(\newcommand{\real}{\mathbb R}\) \(\newcommand{\twovec}[2]{\left[\begin{array}{r}#1 \\ #2 \end{array}\right]}\) \(\newcommand{\ctwovec}[2]{\left[\begin{array}{c}#1 \\ #2 \end{array}\right]}\) \(\newcommand{\threevec}[3]{\left[\begin{array}{r}#1 \\ #2 \\ #3 \end{array}\right]}\) \(\newcommand{\cthreevec}[3]{\left[\begin{array}{c}#1 \\ #2 \\ #3 \end{array}\right]}\) \(\newcommand{\fourvec}[4]{\left[\begin{array}{r}#1 \\ #2 \\ #3 \\ #4 \end{array}\right]}\) \(\newcommand{\cfourvec}[4]{\left[\begin{array}{c}#1 \\ #2 \\ #3 \\ #4 \end{array}\right]}\) \(\newcommand{\fivevec}[5]{\left[\begin{array}{r}#1 \\ #2 \\ #3 \\ #4 \\ #5 \\ \end{array}\right]}\) \(\newcommand{\cfivevec}[5]{\left[\begin{array}{c}#1 \\ #2 \\ #3 \\ #4 \\ #5 \\ \end{array}\right]}\) \(\newcommand{\mattwo}[4]{\left[\begin{array}{rr}#1 \amp #2 \\ #3 \amp #4 \\ \end{array}\right]}\) \(\newcommand{\laspan}[1]{\text{Span}\{#1\}}\) \(\newcommand{\bcal}{\cal B}\) \(\newcommand{\ccal}{\cal C}\) \(\newcommand{\scal}{\cal S}\) \(\newcommand{\wcal}{\cal W}\) \(\newcommand{\ecal}{\cal E}\) \(\newcommand{\coords}[2]{\left\{#1\right\}_{#2}}\) \(\newcommand{\gray}[1]{\color{gray}{#1}}\) \(\newcommand{\lgray}[1]{\color{lightgray}{#1}}\) \(\newcommand{\rank}{\operatorname{rank}}\) \(\newcommand{\row}{\text{Row}}\) \(\newcommand{\col}{\text{Col}}\) \(\renewcommand{\row}{\text{Row}}\) \(\newcommand{\nul}{\text{Nul}}\) \(\newcommand{\var}{\text{Var}}\) \(\newcommand{\corr}{\text{corr}}\) \(\newcommand{\len}[1]{\left|#1\right|}\) \(\newcommand{\bbar}{\overline{\bvec}}\) \(\newcommand{\bhat}{\widehat{\bvec}}\) \(\newcommand{\bperp}{\bvec^\perp}\) \(\newcommand{\xhat}{\widehat{\xvec}}\) \(\newcommand{\vhat}{\widehat{\vvec}}\) \(\newcommand{\uhat}{\widehat{\uvec}}\) \(\newcommand{\what}{\widehat{\wvec}}\) \(\newcommand{\Sighat}{\widehat{\Sigma}}\) \(\newcommand{\lt}{<}\) \(\newcommand{\gt}{>}\) \(\newcommand{\amp}{&}\) \(\definecolor{fillinmathshade}{gray}{0.9}\)How Do Geoscientists View the Earth?
There are many ways to image or view Earth. The most obvious way is to go outside and hike around in person, but that may not always be an option. Field work is one of many ways in which a geologist can investigate a particular location (Figure 2.1). Field work focuses on specific questions, requires extensive planning and preparation, and is often expensive. Therefore, any research that can be done in a laboratory or office in advance, such as, collecting imagery, is helpful in shortening the time in the field and reducing the cost. When representing the surface and sub-surface of Earth, geologists use aerial, landsat, or DEM imagery, or a variety of maps, including topographic and geologic maps.
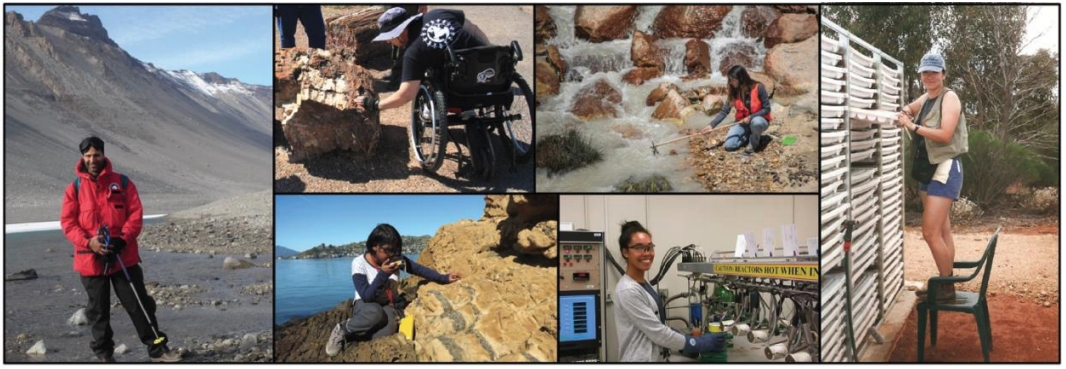
Figure 2.1: Field work examples. Clockwise, from left: Michael in Antarctica; Jen examining petrified wood in Petrified Forest National Park; Angelica sampling water; Tari examining core trays; Carina examining in the lab; Meghomita making measurements at an outcrop.
 Field work has evolved significantly during the centuries. Initially geologists were only able to rely on themselves to get to an area, usually by hiking, horseback, pack mule or boats. With the introduction of motorized transport, including trains, cars, and planes areas farther away became much easier to study. Technology has continued to be an important driving factor of field work evolution.
The phrase “I’m going to do field work” has expanded to include both work outdoors AND in the laboratory, whether with test tubes and beakers or coding and KMZ files. For many geology undergraduates, field work, in its many forms, is a fundamental component of their curriculum. For us, Google Earth ensures everyone is able to participate and is afforded the same opportunity.
All geoscientists use imagery, from paper maps to those generated via computer -- regardless of their discipline. Many are employed by universities, where they teach and/or do research, and state and federal agencies, including geological surveys like the California Geological Survey or United State Geological Survey (USGS). Additional career pathways include environmental policy and legislation and consulting, or science communication via the private sector or state and federal agencies. Many of these career options require a college degree and postgraduate work. If you are interested in geoscience talk to your geology instructor for advice. We recommend completing as many math and science courses as possible. Also, visit National Parks, CA State Parks, museums, gem & mineral shows, or join a local rock and mineral club. Typically, natural history museums will have wonderful displays of rocks, including those from your local region. Here in California, there are a number of large collections, including the San Diego Natural History Museum, Natural History Museum of Los Angeles County, Santa Barbara Museum of Natural History, and Kimball Natural History Museum. Many colleges and universities also have their own collections/museums.
Aerial Imagery
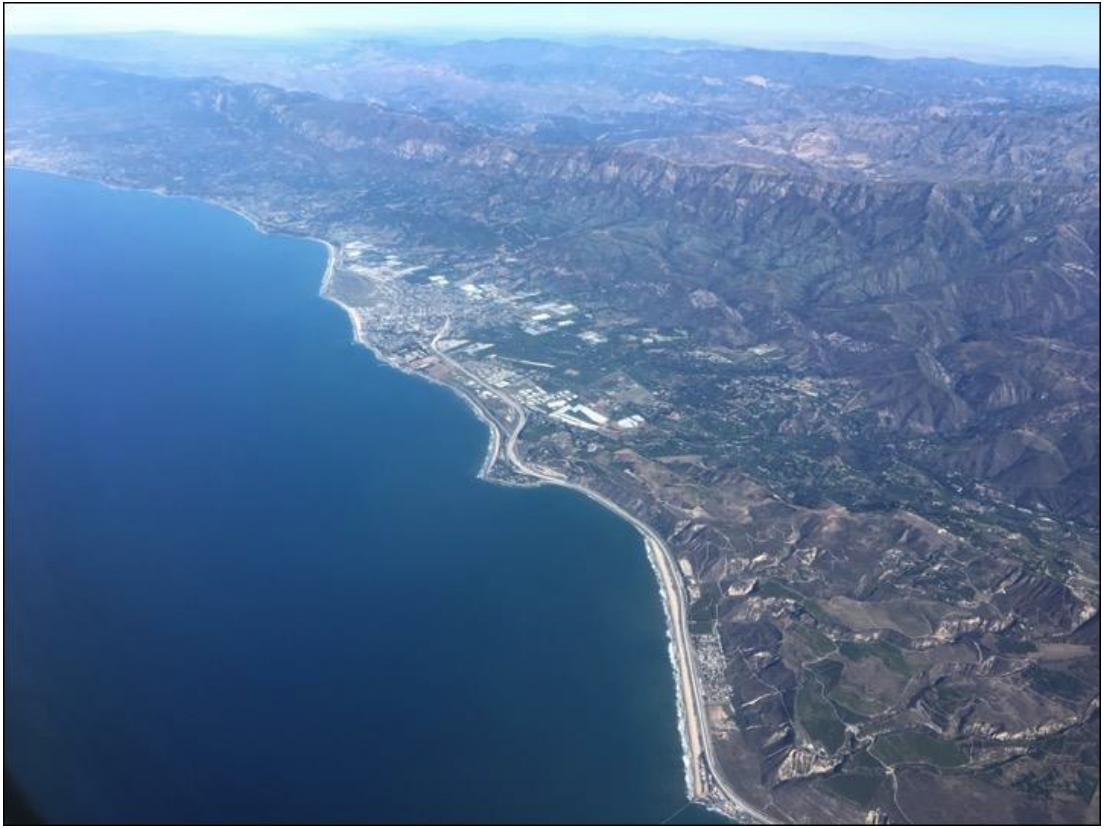
Aerial images are photographs taken from an aircraft, helicopter, airplane, blimp, or other flying object, like a drone (Figure 2.2). These photographs are typically taken by mounted cameras or by hand by the photographer. Next time you fly, sit by the window and snap a photograph of the ground below! There are many different types of aerial imagery including: an oblique aerial photograph, which are photographs taken at an angle; and vertical photographs, which are taken straight down. The earliest surviving aerial image is from the late 1800’s. Drones and other popular camera equipment continue to make access to these types of photos easy and quick, and relatively inexpensive.
Satellite Imagery
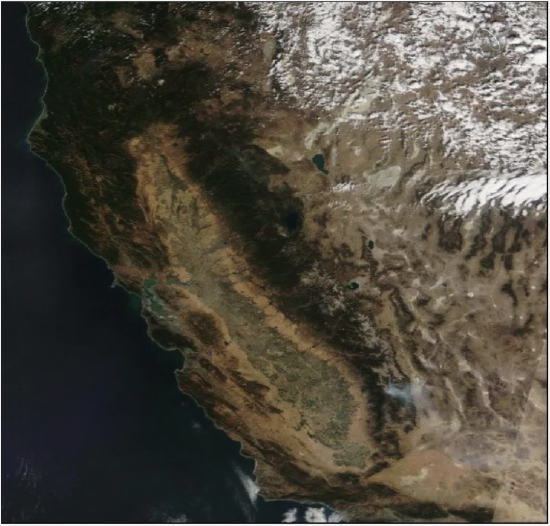
Satellite images are pictures of Earth or other solar system bodies collected by imaging satellites operated by governments and businesses around the world. Here in the US, all satellite images produced by NASA are published by NASA Earth Observatory and are freely available to the public (Figure 2.3). The first images taken from space were done in the 1940’s and the first satellite photograph was taken in 1959. In 1972, one of the most famous space photos, “The Blue Marble” was taken. This coincided with the beginning of the Landsat program here in the US, which is the largest program for acquisition of imagery of Earth from space.
Digital Elevation Model (DEM)
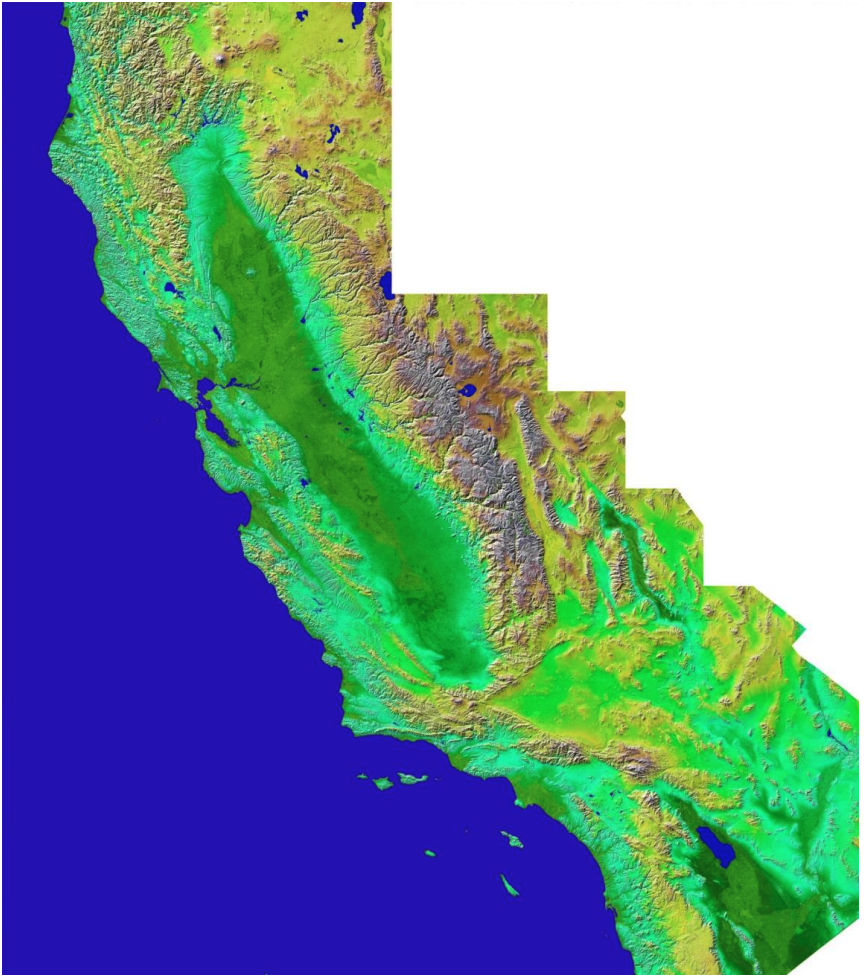
A digital elevation model (DEM) is a 3D computer generated representation of the surface of Earth, planetary body, moon, asteroid, etc. (Figure 2.4). DEMs are commonly built using data collected by remote sensing techniques, but they may also be built from land surveying.
Topographic Maps
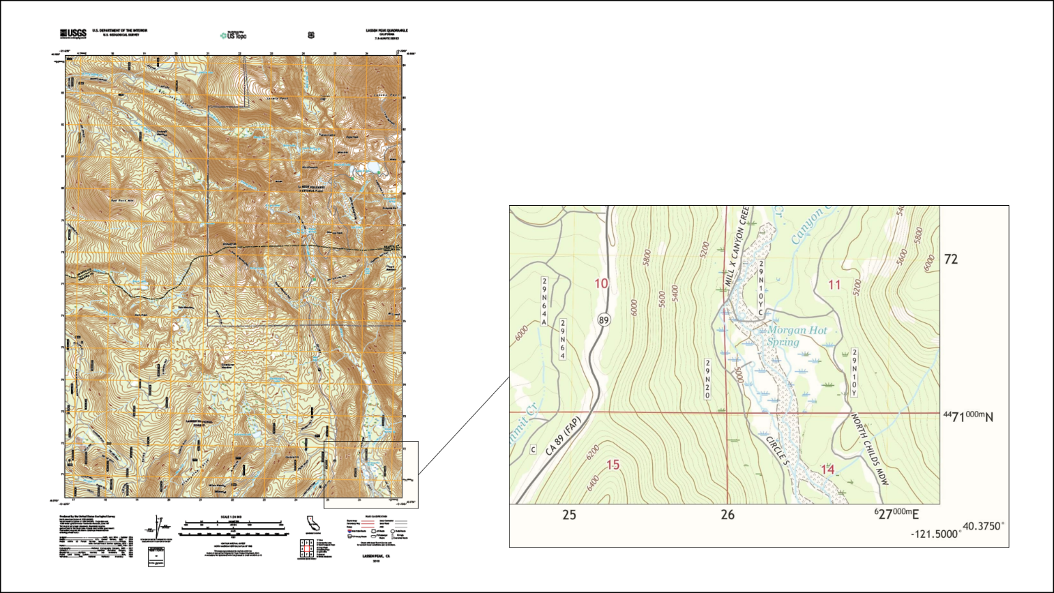
Maps were some of the first items used to represent the Earth, or a part of it. A topographic map represents topography, the shape and character of the Earth's surface, and depicts both natural and human-made features (Figure 2.5). This type of map uses contour lines to denote elevation, whereby each contour line connects points of equal elevation. Contours make it possible to measure the height of mountains, depths of the oceans, and steepness of slopes.
Map Reading Skills
Directions
Recall, cardinal directions are expressed as north (N), east (E), south (S), and west (W), with gradations in between, like northeast (NE), southwest (SW), north-northwest (NNW), etc. The most common way to describe direction is with a compass. The compass needle, which is magnetic, aligns itself with the Earth’s magnetic north pole. A common misconception is that if you follow the north needle on a compass you will end up at the North Pole (hi polar bears!). In reality, the magnetic north pole is offset from the geographic north pole location, which we will discuss more in the plate tectonics chapter (Figure 2.6). On a topographic map there will always be a north arrow to indicate where north is. If there is not an arrow on the map, it is OK to assume north is to the top of the page.
 Earth acts like a very large bar magnet with its south-seeking pole near the geographic North Pole. That is why the north needle of your compass is attracted toward the geographic north pole of Earth, because the magnetic pole that is near the geographic North Pole is actually a south magnetic pole! Confusion arises because the geographic term “North Pole” has come to be used (incorrectly) for the magnetic pole that is near the North Pole. Thus, “north magnetic pole” is actually a misnomer, it should be called the south magnetic pole.
Magnetic Declination
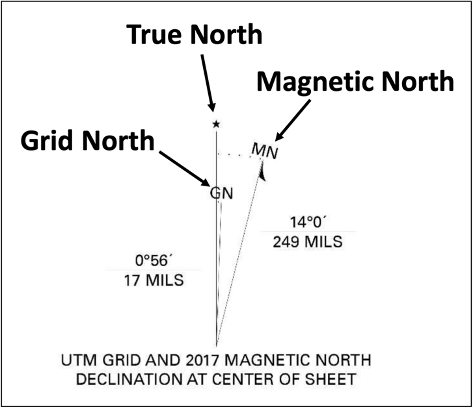
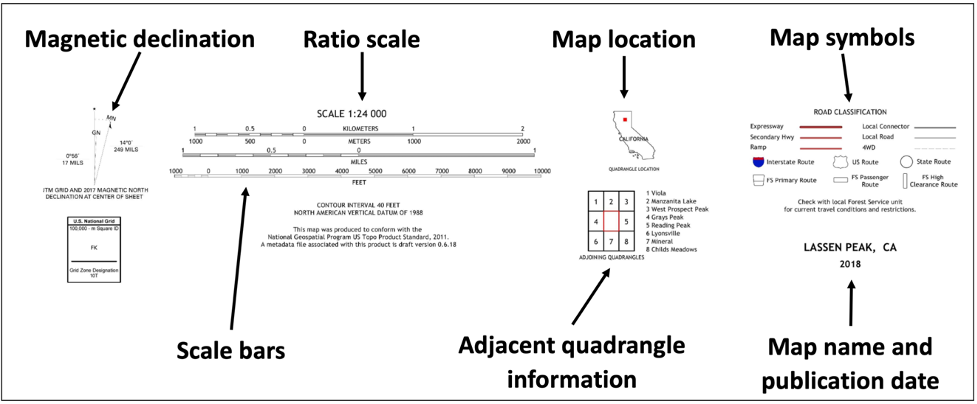
Alongside the north arrow, there is usually an associated magnetic declination. The symbol for this is used in conjunction with a compass for navigational purposes. The star represents the direction of the geographic north pole or true north. The GN represents grid north, which is associated with the map projection, typically the Mercator projection. The MN represents the direction of magnetic north, the direction a compass needle would point (Figure 2.7). The magnetic declination will allow the map reader to determine where the map is located relative to geographic north. The direction of magnetic north varies both with position on the earth's surface and over time, therefore magnetic declination values on old maps may no longer be accurate. Magnetic declination values can be obtained from NOAA’s National Centers for Environmental Information.
Map Scales
Map scale is the relationship between distance on the map and distance on the ground. A ratio scale usually is given as a fraction or a ratio, for example 1/24,000 or 1:24,000 (Figure 2.8). The first number (map distance) is always 1. The second number (ground distance) is different for each scale; the larger the second number is, the smaller the scale of the map. These "representative fraction" scales mean that 1 unit of measurement on the map, 1 inch or 1 centimeter, represents 24,000 of the same units on the ground. The scale 1:24,000, states 1 centimeter on the map would represent 24,000 centimeters on the ground. The scale used for most US topographic mapping is 1:24,000. USGS maps at this scale cover an area measuring 7.5 minutes of latitude and 7.5 minutes of longitude and are commonly called 7.5- minute quadrangle maps. A 7.5-minute quadrangle map covers an area of 49 to 70 square miles (130 to 180 km2). Other common quadrangles may represent 15 minutes of latitude and longitude.

Figure 2.8: Scales for the Lassen Peak Quadrangle (2018).
Latitude and Longitude
Latitude and longitude is a common geographic coordinate system which allows us to locate ourselves or other features on a map. It is used worldwide for navigational purposes on topographic maps, nautical maps, and road maps. It is also used in many GPS systems associated with phones, cars, boats, airplanes, military applications, firefighting, and tracking movement of tectonic plates, just to name a few. The latitude and longitude system is standardized so that a person from Mexico can easily communicate their location to a person in Africa or Europe, without any concern for potential language barriers.
Latitude, or parallels, represent how far north or south of the equator a point is on earth, measured in degrees, from 0° at the equator (00° 00’ 00”), to 90° at the poles (Figure 2.9). Each degree is divided into 60 minutes (‘), and each minute can be divided into 60 seconds (“). Lines of latitude remain the same distance apart as they circle the earth.
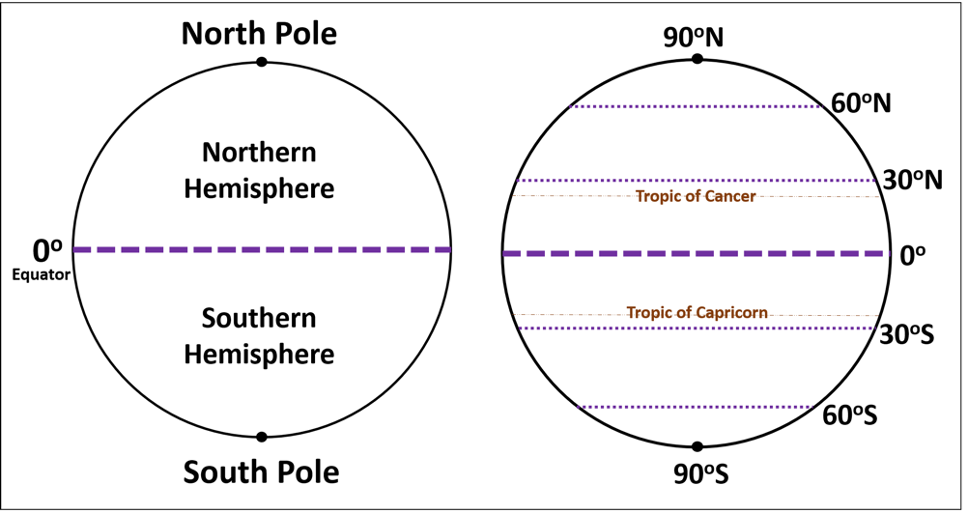
Figure 2.9: The equator divides the northern from the southern hemisphere. Additional lines of latitude are indicated.
When specifying a latitude, always state whether it is in the Northern Hemisphere (N) or Southern Hemisphere (S). For example, Half Dome in Yosemite National Park is located at 37° 44’ 46” N latitude, read as 37 degrees, 44 minutes, and 46 seconds North latitude. This latitude does not locate Half Dome exactly, since this line of latitude encircles the entire globe north of the equator; we need to examine the other half of the coordinate system, longitude.
Longitude, or meridians, represent how far east or west a point on earth is from the Prime Meridian (up to 180°). The Prime Meridian, 0° 00’, 00” longitude, is a north-south line that runs through Greenwich, England. As they near the poles, lines of longitude become closer and closer together (Figure 2.10). Much like lines of latitude, each degree is divided into 60 minutes (‘), and each minute can be divided into 60 seconds (“).
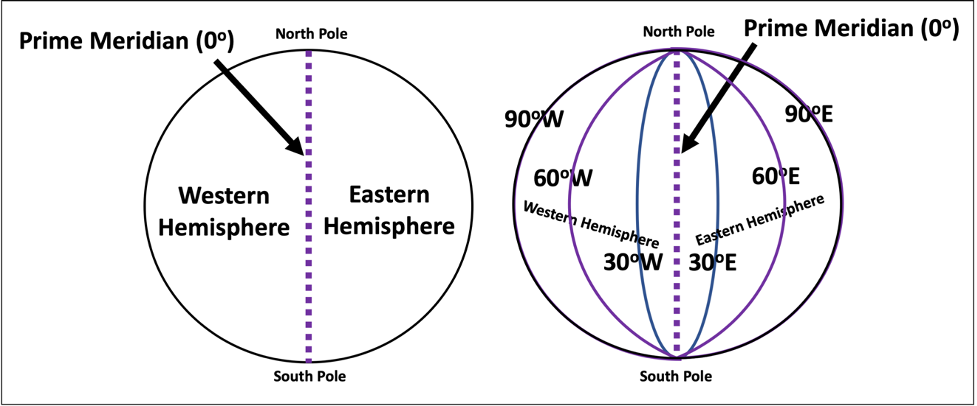
When specifying a longitude, always state whether it is in the Western Hemisphere (W) or Eastern Hemisphere (E). For Half Dome, the longitude is 119° 32’ 4” W longitude, read as 119 degrees, 32 minutes, and 4 seconds West. Half Dome is in the Western Hemisphere, between the Prime Meridian in the east and the 180th meridian in the west. Note that the International Date Line (IDL), where the day changes, roughly corresponds to the 180th meridian.
Together, Half Dome can precisely be located at, 37° 44’ 46” N, 119° 32’ 4” W. In fact, if you were to copy and paste that coordinate in the browser version of Google Earth, you would fly directly to Half Dome. Go ahead and give it a try now!
Universal Transverse Mercator (UTM)
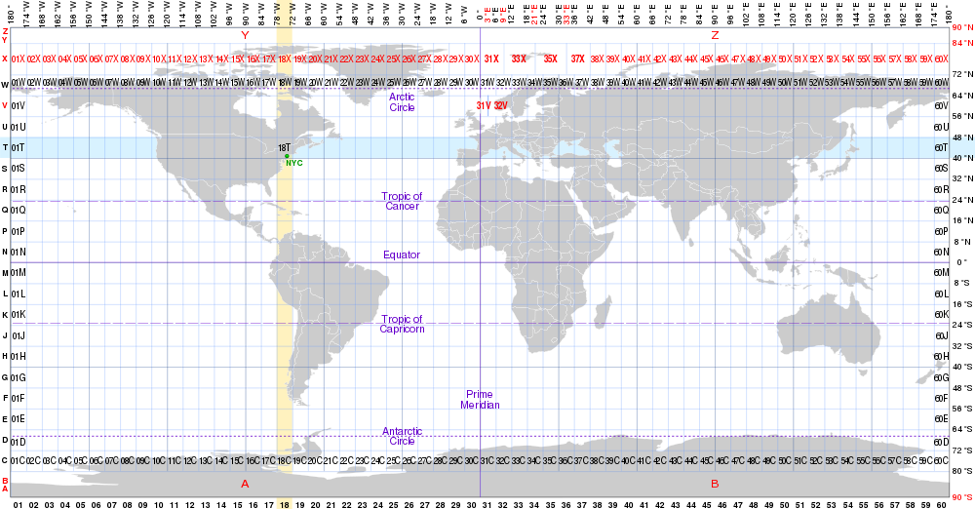
UTM is another coordinate system that can be used to determine a location. It is most commonly used for military, research and survey applications. The UTM system divides the earth’s surface into a grid. Each grid is identified by a number across the top called the zone number and a letter down the right hand side called the zone designator (Figure 2.11). For example: Los Angeles, CA is in UTM grid 11S.
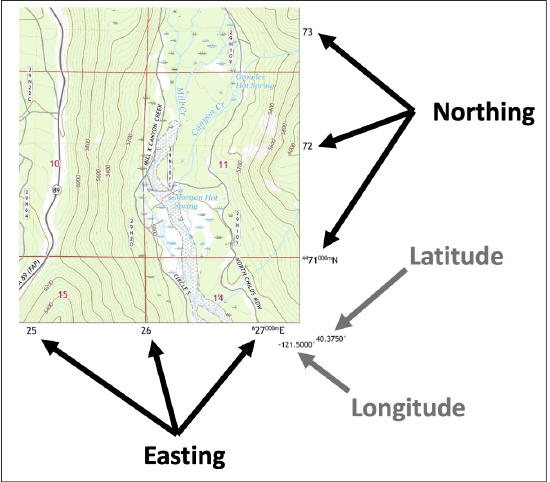
Every spot within a zone can be defined by a coordinate system that uses meters. Your vertical position is defined in terms of meters north (Northing) and your horizontal position is given as meters east (Easting) shown in Figure 2.12. Along the borders of a topographic map you will find both latitude and longitude, and the northing and easting coordinates. The UTM coordinates can be identified by their unique formatting and mixture of font sizes.
Note that in Figure 2.12, the latitude and longitude are designated by positive and negative numbers, with a positive latitude indicating position in the northern hemisphere and a negative latitude indicating position in the southern hemisphere. Similarly, a positive longitude indicates the eastern hemisphere and a negative longitude represents the western hemisphere.)
How Do I Read a Topographic Map?
Topographic maps contain a significant amount of information, both within the map and along the margins. Before investigating a map, always look in the margins, including the area below the map, for information regarding title, location, scale and authorship (Figure 2.13).
Many features on a topo map are shown by lines that may be straight, curved, solid, dashed, dotted, or in any combination. Topographic contours are shown in brown by lines of different widths. Each contour is a line of equal elevation; therefore, contours never cross. They show the general shape of the terrain. To help the user determine elevations, index contours are wider. Elevation values are printed in several places along these lines. The narrower intermediate and supplementary contours found between the index contours help to show more details of the land surface shape (Figure 2.14).
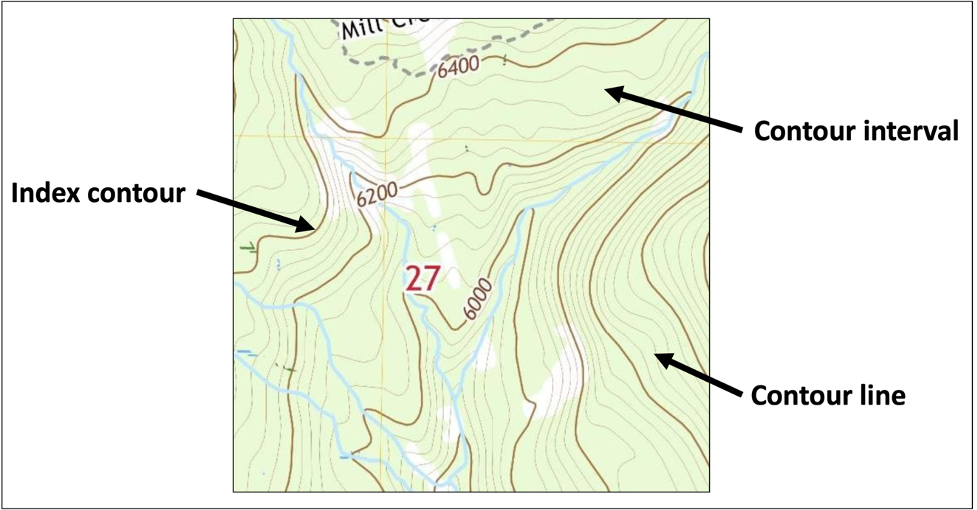
Contours that are very close together represent steep slopes. Widely spaced contours or an absence of contours means that the ground slope is relatively level. The elevation difference between adjacent contour lines, called the contour interval, is selected to best show the general shape of the terrain. The contour interval is printed in the margin of each USGS map (Figure 2.15). Bathymetric contours are shown in blue or black, depending on their location. They show the shape and slope of the ocean bottom surface. The bathymetric contour interval may vary on each map and is explained in the map margin.

Rules of Topographic Maps
Contour lines connect points of equal elevation; therefore, every point along a contour line is the exact same elevation.
Contour lines always separate points of higher elevation (uphill) from lower elevation (downhill).
Contour lines never cross or intersect. A point on the surface of the earth cannot be at two different elevations. An exception to this rule is, an overhanging cliff, and will be represented as dashed contour lines.
Contour lines never split or divide. An exception to this rule is, a vertical cliff where contour lines appear to merge together, but are actually stacked on top of each other.
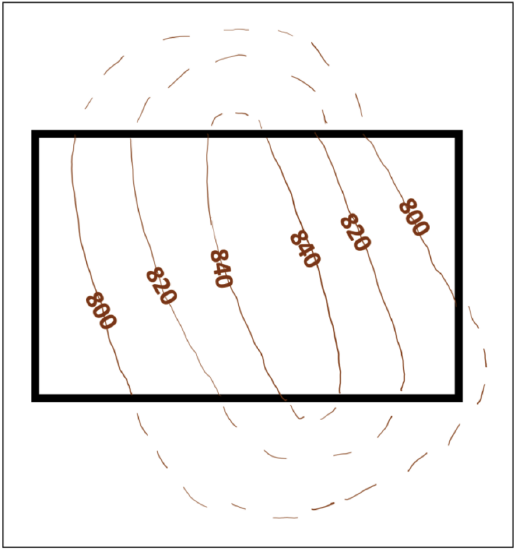
Contour lines always close to form a shape, usually an irregular circle. Note that sometimes contour lines extend beyond the area on a map so you may not see the entire closed circle (Figure 2.16).
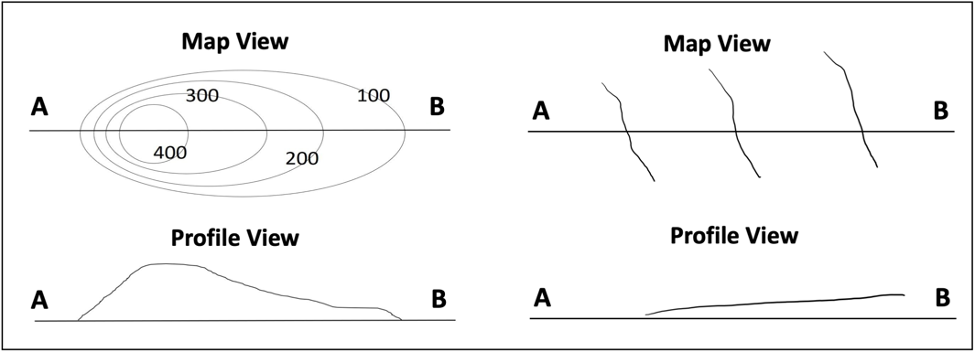
Closely spaced contour lines indicate a steeper slope. Contours which are further apart indicate a gentle slope (Figure 2.17).
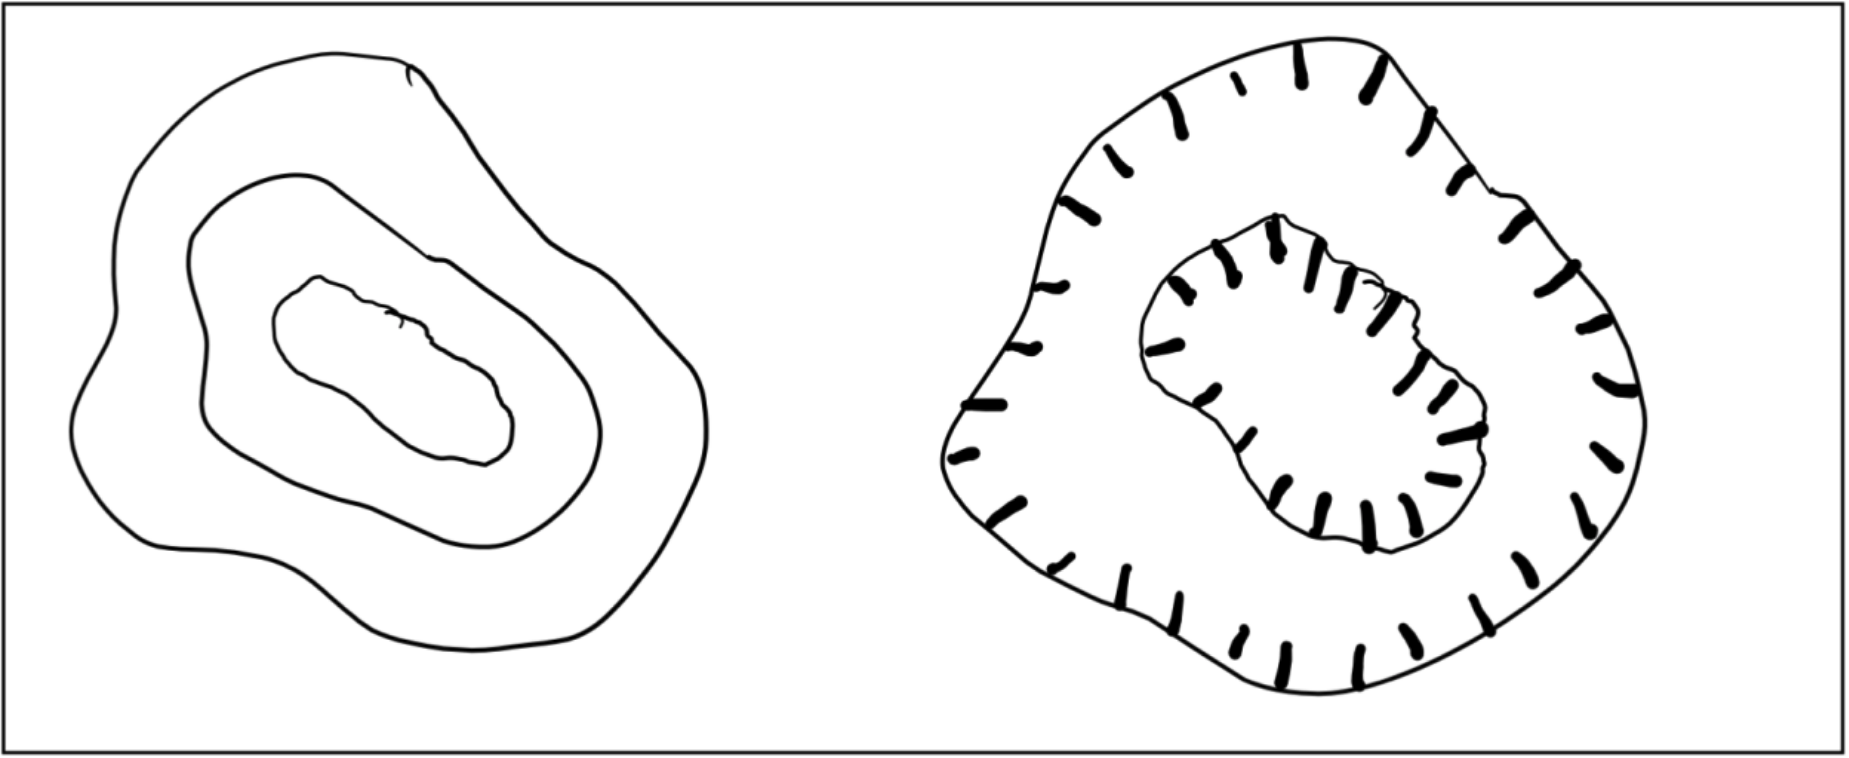
A hill is represented by a concentric series of closed contours (Figure 2.17). The “rule of halves” can be used to interpolate the high points: add half of the contour interval to the elevation of the highest contour line.
Depression contours are indicated by hachure marks on the downhill side (Figure 2.18). The “rule of halves” can be used to interpolate the low points within craters: subtract half of the contour interval from the lowest depression contour.
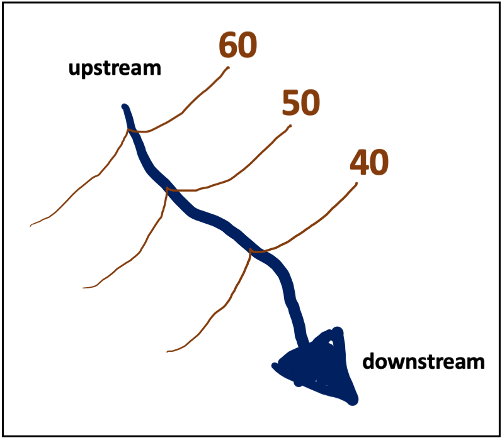
Contour lines “V” upstream when crossing a stream. The point of the “V” points uphill (Figure 2.19).
Topographic Map Legends and Symbology
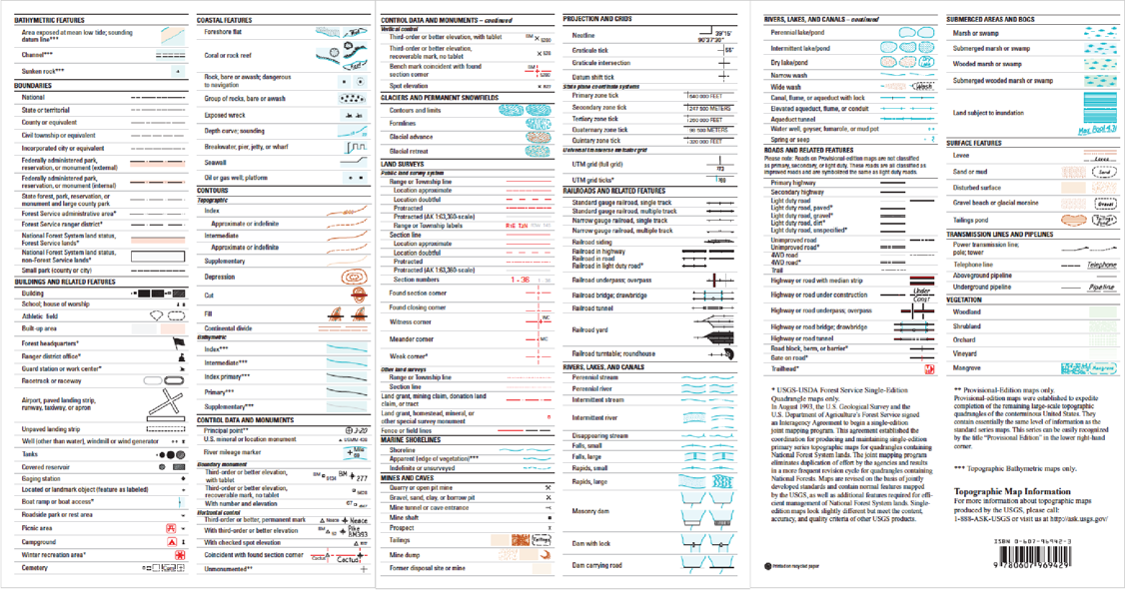
Topographic map symbols represent features such as streets, buildings, streams, and vegetation. These symbols are often updated to improve the appearance or readability of the map. Here in the US, the United States Geological Survey (USGS) uses standard symbols across their maps, and will likely be important in this course.
Determining Gradient
One of the most basic topographic observations that can be made is the gradient, or slope, of the ground surface. High, or steep, gradients occur in areas where there is a large change in elevation over a short distance. Low, or gentle, gradients occur where there is little change in elevation over the same distance. Steep versus gentle are relative terms, meaning, what would be considered steep in some parts of the country might be considered gentle in another part. However, gradients can still be compared between different parts of a map. The gradient can be determined through interpretation of the contour line spacing. For example, contour lines that are very close together signify steep terrain, whereas contours lines that are further apart indicate a flatter land surface (Figure 2.17). Gradient can also be determined mathematically using the following formula:
(elevation of point A - elevation of point B) / (distance from point A to point B)
Gradient typically has units in feet per mile (ft/mi).
Topographic Profiles
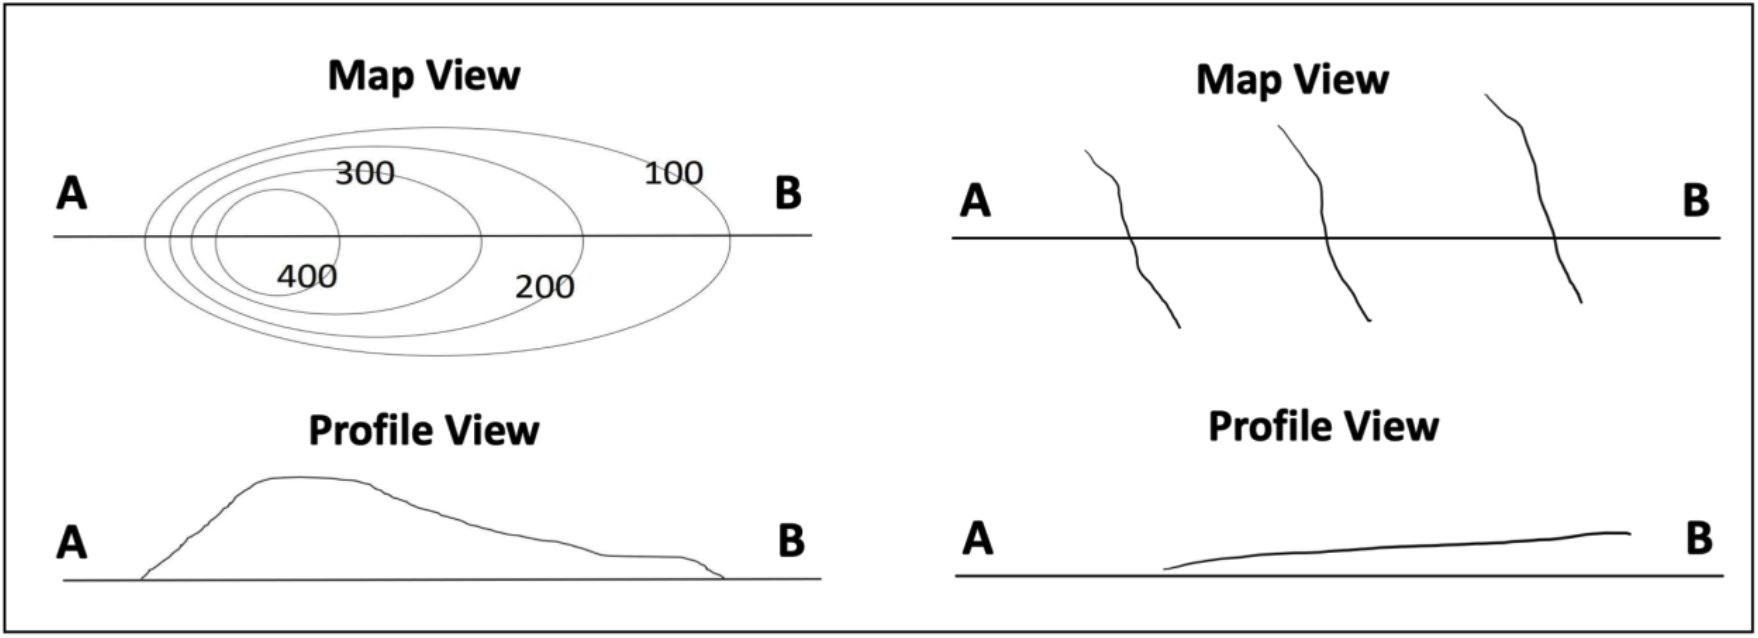
Construction of a topographic profile allows you to visualize the vertical component of a landscape. A topographic profile is similar to the view you have of a landscape while standing on earth, looking at hills and valleys from the side rather than from above.
To successfully draw a topographic profile, follow these simple steps or visit How do I construct a Topographic Profile? for additional help.
- Locate a line on a map that is interesting. In many cases, this line is given to you (often labeled A-A' or A-B). Grab a piece of blank paper and place the edge along this line. Mark the starting and ending points of the line. Be sure you label them appropriately, as A and A', or A and B, or however the original line on the map is identified.
- Start at one end, for example the A end, and move along the edge of the paper, making a mark on the paper every time a contour line touches the edge of the paper. Make sure you label each mark with the right elevation so that you can transfer that point to the correct elevation on your profile. It is important to write neatly to ensure your labels can be read during a later step. Note the highest and lowest elevation.
- Use a piece of graph paper (or horizontally lined paper) that is at least as long as your profile line. If needed, tape paper together to a long enough sheet; make sure the grid lines line up.
- On the graph paper, draw a horizontal line the length of the profile line. Draw vertical lines above your starting and ending points. Label the y-axis (vertical lines) with elevation. It is important to consider the scale, using the noted highest and lowest elevations from Step 2. For example, if the lowest elevation is 7,200 feet and the highest is 10,600 feet, you’d likely want to label your axis from 7,000 to 11,000 feet.
- Line up your original tick marked paper with the line drawn on your graph paper. Beginning with the elevation on the left-hand side of the paper, go directly up from that tick mark to make a small dot at the corresponding elevation. Note that the point does not need to be on a vertical line on the graph paper.
- Once you have transferred all of your tick marks to your graph paper, connect the dots using a smooth curve. When connecting dots, recall you are interpreting the land surface between contour lines and therefore want smooth and consistent lines, and not straight lines. If you compare your profile with a fellow classmate, you may notice slight differences; overall, however, they should be a similar shape.
Attributions
- Figure 2.1: “Geoscientists in the Field” (CC-BY 4.0; Chloe Branciforte, own work)
- Figure 2.2: “The Rincon in Southern California” (CC-BY 4.0; Matthew Sauter, own work)
- Figure 2.3: “NASA Satellites See California”; (CC-BY 2.0; NASA Goddard Space Flight Center via Flickr)
- Figure 2.4: “Shaded Relief with Color as Height, California Mosaic” (Public Domain; NASA/JPL/NIMA)
- Figure 2.5: “Lassen Peak Quadrangle” (Public Domain; USGS)
- Figure 2.6: Derivative of “North Magnetic Pole” (CC-BY 4.0; Cavit via Wikimedia Commons) and “Universal Characteristics of Magnets and Magnetic Poles” (CC-BY 4.0; OpenStax) by Chloe Branciforte
- Figure 2.7: Derivative of “Lassen Peak Quadrangle” (Public Domain; USGS) by Chloe Branciforte
- Figure 2.8: Derivative of “Lassen Peak Quadrangle” (Public Domain; USGS) by Chloe Branciforte
- Figure 2.9: “Lines of Latitude” (CC-BY 4.0; Chloe Branciforte and Cynthia Lampe, own work)
- Figure 2.10: “Lines of Longitude” (CC-BY 4.0; Chloe Branciforte and Cynthia Lampe, own work)
- Figure 2.11: “Universal Transverse Mercator Zones” (CC-BY-SA 4.0; cmglee, STyx, Wikialine and Goran tex-en via Wikimedia Commons)
- Figure 2.12: Derivative of “Lassen Peak Quadrangle” (Public Domain; USGS) by Chloe Branciforte
- Figure 2.13: Derivative of “Lassen Peak Quadrangle” (Public Domain; USGS) by Chloe Branciforte
- Figure 2.14: Derivative of “Lassen Peak Quadrangle” (Public Domain; USGS) by Chloe Branciforte
- Figure 2.15: Derivative of “Lassen Peak Quadrangle” (Public Domain; USGS) by Chloe Branciforte
- Figure 2.16: “Closing a Shape” (CC-BY 4.0; Chloe Branciforte, own work)
- Figure 2.17: “Steep vs. Gentle Slope” (CC-BY 4.0; Chloe Branciforte, own work)
- Figure 2.18: “Hill vs. Depression in map-view” (CC-BY 4.0; Chloe Branciforte, own work)
- Figure 2.19: “Rule of V’s” (CC-BY 4.0; Chloe Branciforte, own work)
- Figure 2.20: “Topographic map symbols” (Public Domain; USGS)


