
10.2: The Hydrologic Cycle
- Page ID
- 16113

\( \newcommand{\vecs}[1]{\overset { \scriptstyle \rightharpoonup} {\mathbf{#1}} } \)
\( \newcommand{\vecd}[1]{\overset{-\!-\!\rightharpoonup}{\vphantom{a}\smash {#1}}} \)
\( \newcommand{\dsum}{\displaystyle\sum\limits} \)
\( \newcommand{\dint}{\displaystyle\int\limits} \)
\( \newcommand{\dlim}{\displaystyle\lim\limits} \)
\( \newcommand{\id}{\mathrm{id}}\) \( \newcommand{\Span}{\mathrm{span}}\)
( \newcommand{\kernel}{\mathrm{null}\,}\) \( \newcommand{\range}{\mathrm{range}\,}\)
\( \newcommand{\RealPart}{\mathrm{Re}}\) \( \newcommand{\ImaginaryPart}{\mathrm{Im}}\)
\( \newcommand{\Argument}{\mathrm{Arg}}\) \( \newcommand{\norm}[1]{\| #1 \|}\)
\( \newcommand{\inner}[2]{\langle #1, #2 \rangle}\)
\( \newcommand{\Span}{\mathrm{span}}\)
\( \newcommand{\id}{\mathrm{id}}\)
\( \newcommand{\Span}{\mathrm{span}}\)
\( \newcommand{\kernel}{\mathrm{null}\,}\)
\( \newcommand{\range}{\mathrm{range}\,}\)
\( \newcommand{\RealPart}{\mathrm{Re}}\)
\( \newcommand{\ImaginaryPart}{\mathrm{Im}}\)
\( \newcommand{\Argument}{\mathrm{Arg}}\)
\( \newcommand{\norm}[1]{\| #1 \|}\)
\( \newcommand{\inner}[2]{\langle #1, #2 \rangle}\)
\( \newcommand{\Span}{\mathrm{span}}\) \( \newcommand{\AA}{\unicode[.8,0]{x212B}}\)
\( \newcommand{\vectorA}[1]{\vec{#1}} % arrow\)
\( \newcommand{\vectorAt}[1]{\vec{\text{#1}}} % arrow\)
\( \newcommand{\vectorB}[1]{\overset { \scriptstyle \rightharpoonup} {\mathbf{#1}} } \)
\( \newcommand{\vectorC}[1]{\textbf{#1}} \)
\( \newcommand{\vectorD}[1]{\overrightarrow{#1}} \)
\( \newcommand{\vectorDt}[1]{\overrightarrow{\text{#1}}} \)
\( \newcommand{\vectE}[1]{\overset{-\!-\!\rightharpoonup}{\vphantom{a}\smash{\mathbf {#1}}}} \)
\( \newcommand{\vecs}[1]{\overset { \scriptstyle \rightharpoonup} {\mathbf{#1}} } \)
\(\newcommand{\longvect}{\overrightarrow}\)
\( \newcommand{\vecd}[1]{\overset{-\!-\!\rightharpoonup}{\vphantom{a}\smash {#1}}} \)
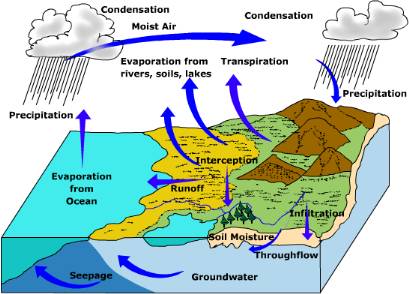
\(\newcommand{\avec}{\mathbf a}\) \(\newcommand{\bvec}{\mathbf b}\) \(\newcommand{\cvec}{\mathbf c}\) \(\newcommand{\dvec}{\mathbf d}\) \(\newcommand{\dtil}{\widetilde{\mathbf d}}\) \(\newcommand{\evec}{\mathbf e}\) \(\newcommand{\fvec}{\mathbf f}\) \(\newcommand{\nvec}{\mathbf n}\) \(\newcommand{\pvec}{\mathbf p}\) \(\newcommand{\qvec}{\mathbf q}\) \(\newcommand{\svec}{\mathbf s}\) \(\newcommand{\tvec}{\mathbf t}\) \(\newcommand{\uvec}{\mathbf u}\) \(\newcommand{\vvec}{\mathbf v}\) \(\newcommand{\wvec}{\mathbf w}\) \(\newcommand{\xvec}{\mathbf x}\) \(\newcommand{\yvec}{\mathbf y}\) \(\newcommand{\zvec}{\mathbf z}\) \(\newcommand{\rvec}{\mathbf r}\) \(\newcommand{\mvec}{\mathbf m}\) \(\newcommand{\zerovec}{\mathbf 0}\) \(\newcommand{\onevec}{\mathbf 1}\) \(\newcommand{\real}{\mathbb R}\) \(\newcommand{\twovec}[2]{\left[\begin{array}{r}#1 \\ #2 \end{array}\right]}\) \(\newcommand{\ctwovec}[2]{\left[\begin{array}{c}#1 \\ #2 \end{array}\right]}\) \(\newcommand{\threevec}[3]{\left[\begin{array}{r}#1 \\ #2 \\ #3 \end{array}\right]}\) \(\newcommand{\cthreevec}[3]{\left[\begin{array}{c}#1 \\ #2 \\ #3 \end{array}\right]}\) \(\newcommand{\fourvec}[4]{\left[\begin{array}{r}#1 \\ #2 \\ #3 \\ #4 \end{array}\right]}\) \(\newcommand{\cfourvec}[4]{\left[\begin{array}{c}#1 \\ #2 \\ #3 \\ #4 \end{array}\right]}\) \(\newcommand{\fivevec}[5]{\left[\begin{array}{r}#1 \\ #2 \\ #3 \\ #4 \\ #5 \\ \end{array}\right]}\) \(\newcommand{\cfivevec}[5]{\left[\begin{array}{c}#1 \\ #2 \\ #3 \\ #4 \\ #5 \\ \end{array}\right]}\) \(\newcommand{\mattwo}[4]{\left[\begin{array}{rr}#1 \amp #2 \\ #3 \amp #4 \\ \end{array}\right]}\) \(\newcommand{\laspan}[1]{\text{Span}\{#1\}}\) \(\newcommand{\bcal}{\cal B}\) \(\newcommand{\ccal}{\cal C}\) \(\newcommand{\scal}{\cal S}\) \(\newcommand{\wcal}{\cal W}\) \(\newcommand{\ecal}{\cal E}\) \(\newcommand{\coords}[2]{\left\{#1\right\}_{#2}}\) \(\newcommand{\gray}[1]{\color{gray}{#1}}\) \(\newcommand{\lgray}[1]{\color{lightgray}{#1}}\) \(\newcommand{\rank}{\operatorname{rank}}\) \(\newcommand{\row}{\text{Row}}\) \(\newcommand{\col}{\text{Col}}\) \(\renewcommand{\row}{\text{Row}}\) \(\newcommand{\nul}{\text{Nul}}\) \(\newcommand{\var}{\text{Var}}\) \(\newcommand{\corr}{\text{corr}}\) \(\newcommand{\len}[1]{\left|#1\right|}\) \(\newcommand{\bbar}{\overline{\bvec}}\) \(\newcommand{\bhat}{\widehat{\bvec}}\) \(\newcommand{\bperp}{\bvec^\perp}\) \(\newcommand{\xhat}{\widehat{\xvec}}\) \(\newcommand{\vhat}{\widehat{\vvec}}\) \(\newcommand{\uhat}{\widehat{\uvec}}\) \(\newcommand{\what}{\widehat{\wvec}}\) \(\newcommand{\Sighat}{\widehat{\Sigma}}\) \(\newcommand{\lt}{<}\) \(\newcommand{\gt}{>}\) \(\newcommand{\amp}{&}\) \(\definecolor{fillinmathshade}{gray}{0.9}\)The hydrologic cycle, or water cycle, is the cycling of water through the earth system. Not only is the hydrologic cycle a cycle of water, it is a cycle of energy as well. Over the next several pages we'll trace water as it passes through the earth system and the energy that accompanies it.
Evaporation and Condensation
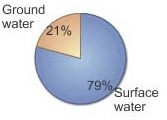
Evaporation is the phase change of liquid water into a vapor (gas). Evaporation is an important means of transferring energy between the surface and the air above. The energy used to evaporate water is called "latent energy". Latent energy is "locked up" in the water molecule when water undergoes the phase change from a liquid to a gas. Eighty-eight percent of all water entering the atmosphere originates from the ocean between 60o north and 60o south latitude. Most of the water evaporated from the ocean returns directly back to the ocean. Some water is transported over land before it is precipitated out. When water vapor condenses back into a liquid it releases latent heat, which is converted into sensible heat warming the surrounding air. The warming of the surrounding air fuels uplift to help promote adiabatic cooling and further condensation. As droplets of water coalesce into larger droplets they attain a size big enough to fall towards the earth as precipitation. Located high in the troposphere, rain drops possess a high degree of potential energy that is converted into kinetic energy once they begin to fall toward the surface. Impacting the surface they convert this kinetic energy into work done on the surface (erosion for example).
Interception and Infiltration
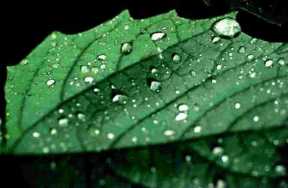
As water reaches the surface in various forms of precipitation, it is intercepted by plants or falls directly to the surface. Precipitation that collects on the leaves or stems of plants is known as interception. The amount of water intercepted by a plant largely depends on plant form. Water is held on the leaf surface until it either drips off as through fall or trickles down the leaf stem finally reaching the ground as stem flow. Interception of falling rain buffers the surface against erosion. Coniferous trees tend to intercept more water than deciduous trees on an annual basis because deciduous trees drop their leaves for a period of time.
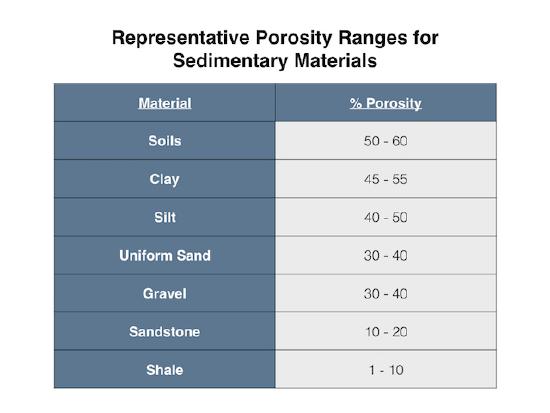
Upon reaching the ground, some water infiltrates into the soil, possibly percolating down to the groundwater zone or it may run across the surface as runoff. Infiltration refers to water that penetrates into the surface of soil. Infiltration is controlled by soil texture, soil structure, vegetation and soil moisture status. High infiltration rates occur in dry soils, with infiltration slowing as the soil becomes wet. Coarse textured soils with large well-connected pore spaces tend to have higher infiltration rates than fine textured soils. However, coarse textured soils fill more quickly than fine textured soils due to a smaller amount of total pore space in a unit volume of soil. Runoff is generated quicker than one might have with a finer textured soil.
Vegetation also affects infiltration. For instance, infiltration is higher for soils under forest vegetation than bare soils. Tree roots loosen and provide conduits through which water can enter the soil. Foliage and surface litter reduce the impact of falling rain keeping soil passages from becoming sealed.
Subsurface water
Groundwater and soil water together comprise approximately .5% of all water in the hydrosphere. Water beneath the surface can essentially be divided into two zones (Figure \(\PageIndex{3}\)), the unsaturated zone (also known as the "zone of aeration") which includes soil water zone, and zone of saturation which includes ground water. Air and water occupies the pore spaces between earth materials in the zone of aeration. Sometimes, especially during times of high rainfall, these pore spaces are filled with water. The water table divides the zone of aeration from the zone of saturation. The height of the water table will fluctuate with precipitation, increasing in elevation during wet periods and decreasing during dry. Note how the water table intersects the level of the stream surface in Figure \(\PageIndex{3}\). Seepage of groundwater into a stream provides a base flow of water for perennial streams.
Soil Water
Soil water is held in the pore spaces between particles of soil. Soil water is the water that is immediately available to plants. Soil water can be further sub-divided into three categories, 1) hygroscopic water, 2) capillary water, and 3) gravitational water. Hygroscopic water is found as a microscopic film of water surrounding soil particles. This water is tightly bound to a soil particle by molecular attraction so powerful that it cannot be removed by natural forces. Hygroscopic water is bound to soil particles by adhesive forces that exceed 31 bars and may be as great as 10,000 bars (Recall that sea level pressure is equal to 1013.2 millibars which is just about 1 bar!). Capillary water is held by cohesive forces between the films of hygroscopic water. The binding pressure for capillary water is much less than hygroscopic water. This water can be removed by air drying or by plant absorption, but cannot be removed by gravity. Plants extract this water through their roots until the soil capillary force (force holding water to the particle) is equal to the extractive force of the plant root. At this point the plant cannot pull water from the plant-rooting zone and it wilts (called the wilting point). Gravity water is water moved through the soil by the force of gravity. The amount of water held in the soil after excess water has drained is called the field capacity of the soil. The amount of water in the soil is controlled by the soil texture. Soils dominated by clay-sized particles have more total pore space in a unit volume than soils dominated by sand. As a result, fine grained soils have higher field capacities than coarse-grained soils.
The diagram below shows the relationship between soil texture, wilting point, field capacity, and available water. The difference between the wilting point and the field capacity is the available water.
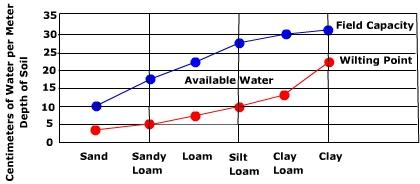
Note that the smallest amount of available water is associated with the coarsest soil texture, sand. The amount of available water increases toward the center of the graph where soils with a mixture of different sized particles (loamy soils) are found. The available water then drops off toward the fine textured soils on the right. How does one explain the relationship between available water and soil texture? Coarse soil does not have much available water because it doesn't hold much water to begin with. At the other end of the spectrum, low available water in fine soils is due to strong bond between soil particles and water. Plants have a harder time pulling water away from the soil particle under these conditions.
Groundwater
Groundwater occupies the zone of saturation. As depicted in the hydrologic cycle diagram, ground water moves downward through the soil by percolation and then toward a stream channel or large body of water as seepage. The water table separates the zone of saturation from the zone of aeration. The water table fluctuates with moisture conditions, during wet times the water table will rise as more pore spaces are occupied with water. Groundwater is found in aquifers, bodies of earth material that have the ability to hold and transmit water. Aquifers can be either unconfined or confined. Unconfined (open) aquifers are "connected" to the surface above. Confined (closed) aquifers are sandwiched in between dense impermeable layers of earth material called an aquiclude. Ground water is replenished by percolation of water from the zone of aeration downward to the zone of saturation, or in the recharge zone of a confined aquifer. The recharge zone is where the confined aquifer is exposed at the surface and water can enter it.
Aquifers replenish their supply of water very slowly. The rate of groundwater flow depends on the permeability of the aquifer and the hydraulic gradient. Permeability is affected by the size and connectivity of pore spaces. Larger, better connected pore spaces creates highly permeable earth material. The hydraulic gradient is the difference in elevation between two points on the water table divided by the horizontal distance between them. The rate of ground water flow is expressed by the equation:
Ground water flow rate = permeability X hydraulic gradient
Groundwater flow rates are usually quite slow. Average ground water flow rate of 15 m per day is common. Highly permeable materials like gravels can have flow velocities of 125 m per day.
Groundwater in an aquifer is under pressure called hydrostatic pressure. Hydrostatic pressure in a confined aquifer pushes water upward when a well is drilled into the aquifer. The height to which the water rises is called the peizometeric surface. If the hydrostatic pressure is great enough to push the peizometeric surface above the elevation of the surface, water readily flows out as an artesian well.
Groundwater and Human Activities
Groundwater is an important source of water for human activities such as agriculture and domestic drinking water. In 2000, 68% of fresh ground water was used for irrigation while another 19% was extracted for public-supply purposes, mostly drinking water. For those who supply their own water for domestic use, over 98 percent is from ground water.
In dry regions and in places where soils are highly permeable, agriculture uses large amounts of ground water for irrigation. The high rate of water use for agriculture has fueled tensions between urban and rural interests. A Dec. 4, 1998 "Talk of the Nation - Science Friday" segment, "San Antonio: Water Rights", discusses the competing demands of urban and rural populations using the Edwards Aquifer in south Texas.
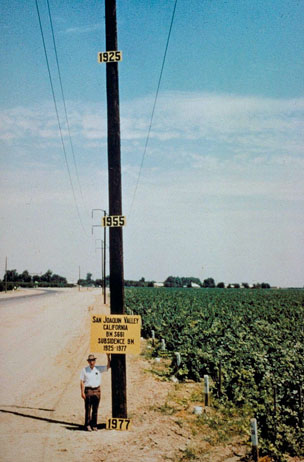
However, the rate of groundwater removal by humans sometimes exceeds the recharge of the aquifer. Such is the case of the High Plains Aquifer of Arizona, Colorado, New Mexico, and Utah. Over pumping of ground water reserves can lead to compaction and degradation of the aquifer. As the water is removed, the aquifer often collapses causing the surface to subside. Aquifer compaction reduces pore space, making recharge more difficult. One of the most striking examples is that which has occurs in the San Joaquin Valley of California. An August 6, 2013 NPR All Things Considered segment An NPR Morning Edition segment from July 2, 2013 "Wells Are Running Dry in Parts of Kansas" describes the plight of farmers and ranchers in Kansas where groundwater supplies are getting scarce.
Surface Water
Once precipitation reaches the surface, water can infiltrate into the soil or move across the surface as runoff. Surface runoff generally occurs when the rainfall intensity exceeds the rate of infiltration, or if the soil is at its water holding capacity. Infiltration and water holding capacity are both a function of soil texture and structure. Soil composed of a high percentage of sand allows water to infiltrate through it quite rapidly because it has large, well-connected pore spaces. Soils dominated by clay have low infiltration rates due to their smaller sized pore spaces. However, there's actually less total pore space in a unit volume of coarse, sandy soil than that of soil composed mostly of clay. As a result, sandy soils fill rapidly and commonly generate runoff sooner than clay soils.
If the rainfall intensity exceeds the infiltration capacity of the soil, or if the soil has reached its field capacity, surface runoff occurs. Water runs across the surface as either confined or unconfined flow. Unconfined flow moves across the surface in broad sheets of water often creating sheet erosion. Confined flow refers to water confined to channels. Stream flow is a form of confined flow.
Water that runs along the surface may become trapped in depressions and held as depression storage. Here water may either evaporate back into the air, infiltrate into the ground or, spill out of the depression as it fills.
Stream flow is measured in a variety of ways, one of which is stream discharge. Stream discharge is the volume of water passing through a particular cross-section of a stream in a unit of time. Stream discharge is measure in cubic feet per second or cubic meters per second. The "normal" or base flow a stream is provided by seepage of groundwater into the stream channel. This seepage is what keeps perennial flowing streams going all year. When precipitation from a storm occurs, the stream discharge increases as water is added to the stream, either from direct precipitation into the channel or runoff.
A stream hydrograph (right) illustrates the relationship between discharge and runoff. The blue bar graph is precipitation and the line graph represents discharge. As time passes (measured along the x-axis) discharge increases as precipitation falls. Notice that the time of peak precipitation occurs before peak discharge. This is because it takes time for the water to flow across the surface and enter the stream.
The size, shape, land use, vegetation, and geology of the watershed all determine runoff and the shape of the discharge graph.
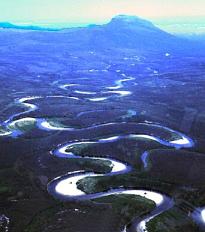
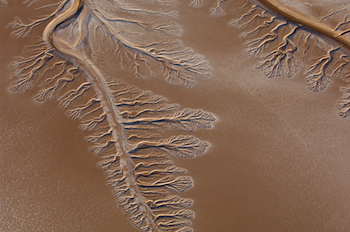
Surface water is an important source of water supplies, especially in the southwestern United States. Ever increasing population and development is straining regional water resources. As the Colorado River winds its way through the desert it loses half its flow to evaporation and the rest to irrigation and municipal water supplies. Recent drought and warmer temperatures predicted in the future will put a greater demand on this precious commodity. The lower course rarely reaches the Gulf of California as it did in times past. Now this once might river usually ends as a small stream or dry channel.
Some feel that we have reached maximum extraction rate for oil. In other words, we have reaches "peak" in our ability to extract oil and the rate of production will continue to decline. Can the same be said for our use of water? View the video below to explore the answer to this question.