
1.3.3: Geographic Information System
- Page ID
- 15336

Advanced computer technology has placed new tools in the hands of geographers to not only create maps much more efficiently, but to analyze spatial data in map form as well. A geographic information system is a computer-based technology that enters, analyzes, manipulates, and displays geographic information. It is a marriage between computer-based cartography and database management.
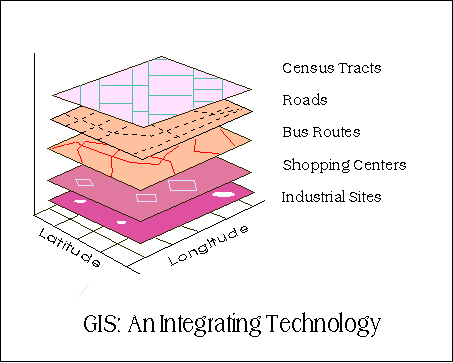
A simple way of visualizing a geographic information system is to think of a set of overhead transparencies. On each transparency is a map of a particular set of data. Examine Figure \(\PageIndex{1}\). The bottom transparency is the most important as it has the coordinate system (latitude and longitude) upon which we can align or register the other layers of information. The second layer is a map of industrial sites, the third shopping centers and so on. By layering the information one on top of the other, a geographer can show the relationship and degree of connectivity between various land uses and transportation routes. Transportation geographers can then plan new routes between population centers found on the census tract map layer and business locations. Geographic Information Systems are being employed to study a number of geographic issues like flood hazard mapping, earthquake hazard studies, economic market area analysis, etc.
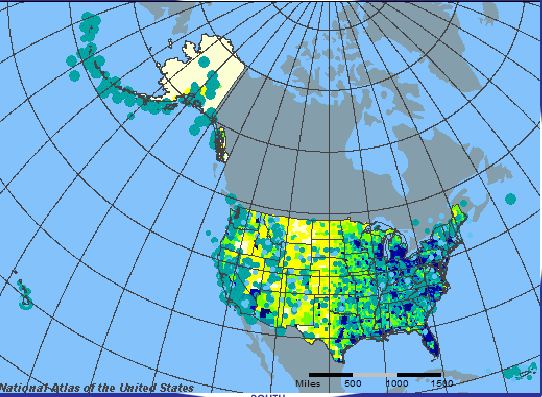
Figure \(\PageIndex{2}\) is a map constructed using a GIS from the online National Atlas of the United States. Layers of data, earthquakes 1568 - 1996 and population density 2000, are turned on and off with digital buttons. The map product from the GIS permits us to visualize those population centers most threatened by earthquake activity.
Video: GIS Specialists at Work (Courtesy of GadBall.com)