
3.2: Map Orientation and Scale
- Page ID
- 5469

\( \newcommand{\vecs}[1]{\overset { \scriptstyle \rightharpoonup} {\mathbf{#1}} } \)
\( \newcommand{\vecd}[1]{\overset{-\!-\!\rightharpoonup}{\vphantom{a}\smash {#1}}} \)
\( \newcommand{\id}{\mathrm{id}}\) \( \newcommand{\Span}{\mathrm{span}}\)
( \newcommand{\kernel}{\mathrm{null}\,}\) \( \newcommand{\range}{\mathrm{range}\,}\)
\( \newcommand{\RealPart}{\mathrm{Re}}\) \( \newcommand{\ImaginaryPart}{\mathrm{Im}}\)
\( \newcommand{\Argument}{\mathrm{Arg}}\) \( \newcommand{\norm}[1]{\| #1 \|}\)
\( \newcommand{\inner}[2]{\langle #1, #2 \rangle}\)
\( \newcommand{\Span}{\mathrm{span}}\)
\( \newcommand{\id}{\mathrm{id}}\)
\( \newcommand{\Span}{\mathrm{span}}\)
\( \newcommand{\kernel}{\mathrm{null}\,}\)
\( \newcommand{\range}{\mathrm{range}\,}\)
\( \newcommand{\RealPart}{\mathrm{Re}}\)
\( \newcommand{\ImaginaryPart}{\mathrm{Im}}\)
\( \newcommand{\Argument}{\mathrm{Arg}}\)
\( \newcommand{\norm}[1]{\| #1 \|}\)
\( \newcommand{\inner}[2]{\langle #1, #2 \rangle}\)
\( \newcommand{\Span}{\mathrm{span}}\) \( \newcommand{\AA}{\unicode[.8,0]{x212B}}\)
\( \newcommand{\vectorA}[1]{\vec{#1}} % arrow\)
\( \newcommand{\vectorAt}[1]{\vec{\text{#1}}} % arrow\)
\( \newcommand{\vectorB}[1]{\overset { \scriptstyle \rightharpoonup} {\mathbf{#1}} } \)
\( \newcommand{\vectorC}[1]{\textbf{#1}} \)
\( \newcommand{\vectorD}[1]{\overrightarrow{#1}} \)
\( \newcommand{\vectorDt}[1]{\overrightarrow{\text{#1}}} \)
\( \newcommand{\vectE}[1]{\overset{-\!-\!\rightharpoonup}{\vphantom{a}\smash{\mathbf {#1}}}} \)
\( \newcommand{\vecs}[1]{\overset { \scriptstyle \rightharpoonup} {\mathbf{#1}} } \)
\( \newcommand{\vecd}[1]{\overset{-\!-\!\rightharpoonup}{\vphantom{a}\smash {#1}}} \)
\(\newcommand{\avec}{\mathbf a}\) \(\newcommand{\bvec}{\mathbf b}\) \(\newcommand{\cvec}{\mathbf c}\) \(\newcommand{\dvec}{\mathbf d}\) \(\newcommand{\dtil}{\widetilde{\mathbf d}}\) \(\newcommand{\evec}{\mathbf e}\) \(\newcommand{\fvec}{\mathbf f}\) \(\newcommand{\nvec}{\mathbf n}\) \(\newcommand{\pvec}{\mathbf p}\) \(\newcommand{\qvec}{\mathbf q}\) \(\newcommand{\svec}{\mathbf s}\) \(\newcommand{\tvec}{\mathbf t}\) \(\newcommand{\uvec}{\mathbf u}\) \(\newcommand{\vvec}{\mathbf v}\) \(\newcommand{\wvec}{\mathbf w}\) \(\newcommand{\xvec}{\mathbf x}\) \(\newcommand{\yvec}{\mathbf y}\) \(\newcommand{\zvec}{\mathbf z}\) \(\newcommand{\rvec}{\mathbf r}\) \(\newcommand{\mvec}{\mathbf m}\) \(\newcommand{\zerovec}{\mathbf 0}\) \(\newcommand{\onevec}{\mathbf 1}\) \(\newcommand{\real}{\mathbb R}\) \(\newcommand{\twovec}[2]{\left[\begin{array}{r}#1 \\ #2 \end{array}\right]}\) \(\newcommand{\ctwovec}[2]{\left[\begin{array}{c}#1 \\ #2 \end{array}\right]}\) \(\newcommand{\threevec}[3]{\left[\begin{array}{r}#1 \\ #2 \\ #3 \end{array}\right]}\) \(\newcommand{\cthreevec}[3]{\left[\begin{array}{c}#1 \\ #2 \\ #3 \end{array}\right]}\) \(\newcommand{\fourvec}[4]{\left[\begin{array}{r}#1 \\ #2 \\ #3 \\ #4 \end{array}\right]}\) \(\newcommand{\cfourvec}[4]{\left[\begin{array}{c}#1 \\ #2 \\ #3 \\ #4 \end{array}\right]}\) \(\newcommand{\fivevec}[5]{\left[\begin{array}{r}#1 \\ #2 \\ #3 \\ #4 \\ #5 \\ \end{array}\right]}\) \(\newcommand{\cfivevec}[5]{\left[\begin{array}{c}#1 \\ #2 \\ #3 \\ #4 \\ #5 \\ \end{array}\right]}\) \(\newcommand{\mattwo}[4]{\left[\begin{array}{rr}#1 \amp #2 \\ #3 \amp #4 \\ \end{array}\right]}\) \(\newcommand{\laspan}[1]{\text{Span}\{#1\}}\) \(\newcommand{\bcal}{\cal B}\) \(\newcommand{\ccal}{\cal C}\) \(\newcommand{\scal}{\cal S}\) \(\newcommand{\wcal}{\cal W}\) \(\newcommand{\ecal}{\cal E}\) \(\newcommand{\coords}[2]{\left\{#1\right\}_{#2}}\) \(\newcommand{\gray}[1]{\color{gray}{#1}}\) \(\newcommand{\lgray}[1]{\color{lightgray}{#1}}\) \(\newcommand{\rank}{\operatorname{rank}}\) \(\newcommand{\row}{\text{Row}}\) \(\newcommand{\col}{\text{Col}}\) \(\renewcommand{\row}{\text{Row}}\) \(\newcommand{\nul}{\text{Nul}}\) \(\newcommand{\var}{\text{Var}}\) \(\newcommand{\corr}{\text{corr}}\) \(\newcommand{\len}[1]{\left|#1\right|}\) \(\newcommand{\bbar}{\overline{\bvec}}\) \(\newcommand{\bhat}{\widehat{\bvec}}\) \(\newcommand{\bperp}{\bvec^\perp}\) \(\newcommand{\xhat}{\widehat{\xvec}}\) \(\newcommand{\vhat}{\widehat{\vvec}}\) \(\newcommand{\uhat}{\widehat{\uvec}}\) \(\newcommand{\what}{\widehat{\wvec}}\) \(\newcommand{\Sighat}{\widehat{\Sigma}}\) \(\newcommand{\lt}{<}\) \(\newcommand{\gt}{>}\) \(\newcommand{\amp}{&}\) \(\definecolor{fillinmathshade}{gray}{0.9}\)Overview
All topographic maps produced by the U.S. Geological Survey (U.S.G.S) are oriented with north at the top of the map. Therefore if you locate a position on the map, and move towards the top of the map you are moving in a northerly direction, and if you are moving to the bottom of the map, you are moving towards the south. Any movement to the right will be towards the east and a movement towards the left will be towards the west. These maps are oriented with their sides oriented parallel to lines of longitude, which are imaginary lines that circle the globe and are oriented so that they pass through the north and south geographic poles. Starting with the 0° longitude line (known as the Prime Meridian) that passes through the town of Greenwich, England, these lines increase up to 180° in both directions east and west of the Prime Meridian (Figure 3.1). It may help to visualize longitude lines if you think of an orange, which when peeled will show the sections of orange oriented like longitude lines that section the Earth. All longitude lines converge at the navel of the orange (or the geographic north and south poles of the Earth).
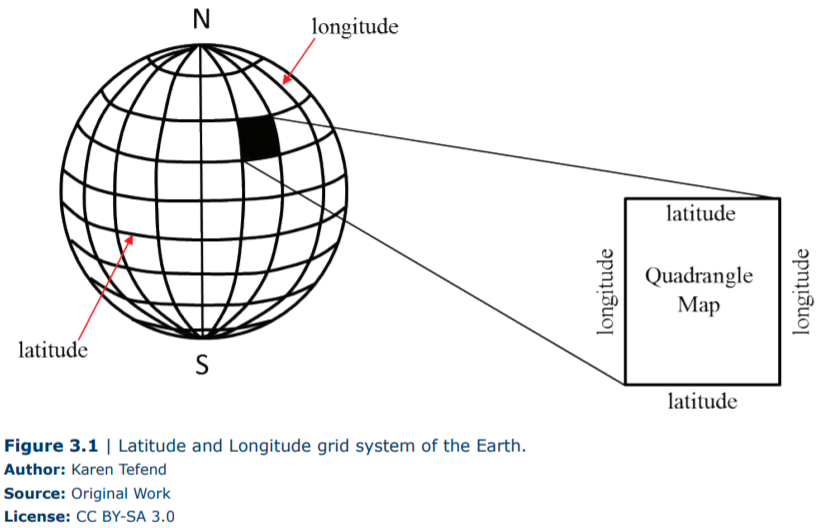
The top edge and bottom edges of a topographic map are oriented so that they are parallel to lines of latitude, which are imaginary lines that circle the globe and are oriented at right angles to the Earth’s axis. The 0° latitude line is the Earth’s Equator; latitude lines increase up to 90° north or 90° south of the Equator, so that the North Pole has a latitude of 90°N, and the South Pole has a latitude of 90°S.
This grid system of latitude and longitude allows a position on the Earth to be uniquely defined, provided that the values for latitude are always identified by their position N or S of the Equator, and longitude is identified as E or W of the Prime Meridian. A degree of latitude or longitude represents a large distance on the Earth, therefore degrees have been further subdivided into minutes (a minute of distance is not the same as a minute of time!), and these minutes of distance are further subdivided into seconds. There are 60 minutes (60’) of distance in 1° of latitude or longitude, and there are 60 seconds (60”) of distance in one minute. An example of a precise location on the Earth’s surface would be 33°34’22”N, 85°05’46”W (the author’s location at the time of writing this chapter!), which is read as “33 degrees, 34 minutes, 22 seconds north latitude, and 85 degrees, 5 minutes, 46 seconds west longitude.”
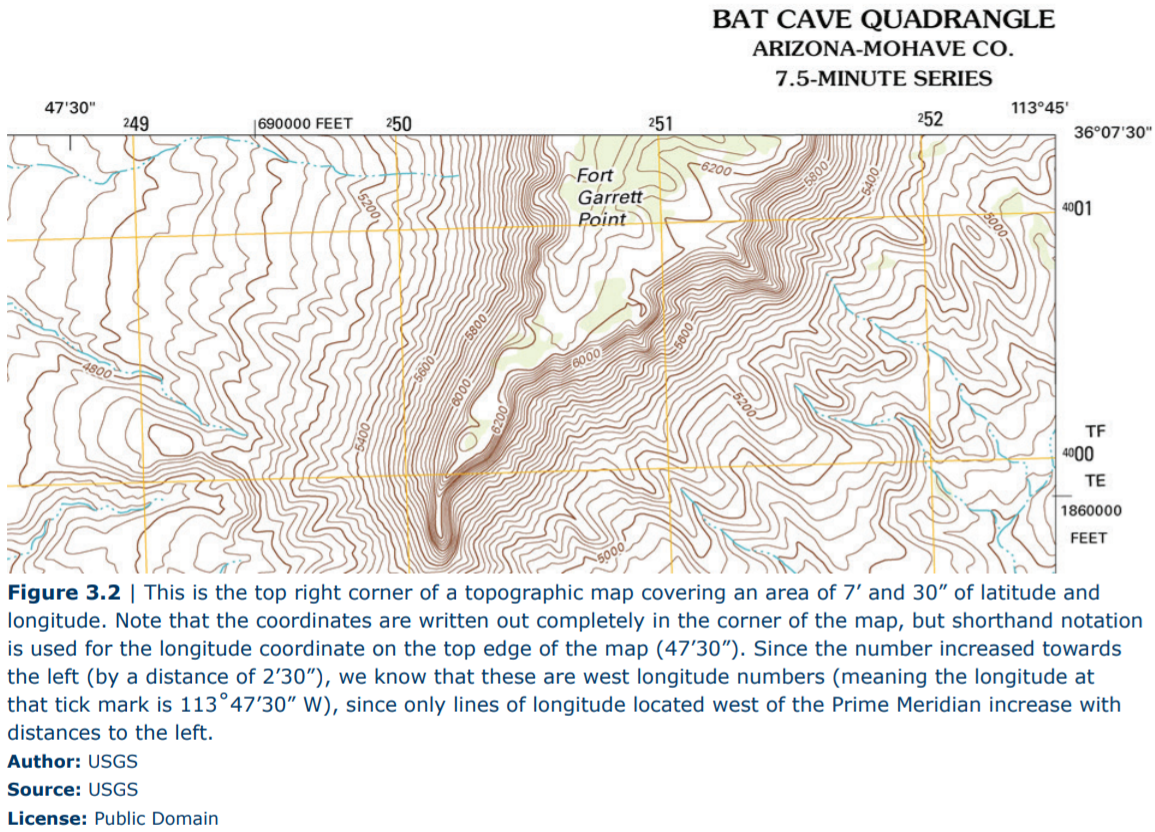
The latitude and longitude coordinates of each topographic map are found at the corners of the map. Often these maps represent an area of the Earth that is smaller than one degree of distance. For example a common topographic map will show only 7.5 minutes of distance (7’ 30”) for both latitude and longitude; in this case, the top and bottom edges of a map will represent a distance of 7.5 minutes of latitude, and the left and right edges of the map will represent a distance of 7.5 minutes of longitude. Because the degree of distance is unchanging on the map, a shorthand notation of just the change in minutes and seconds is labeled at certain positions on the map’s edge. Only at the corners of the map will the degrees be included for the latitude and longitude coordinates. See the example above, which shows the top right corner of a 7.5-minute map or 7.5-minute quadrangle (the shape of most topographic maps). Additional numbers other than latitude and longitude are also shown on the edges of the map; these are a different grid system and will not be explained here.
Remember that the top and bottom edges of a topographic map are oriented parallel to lines of latitude. In Figure 3.2, the top edge of the map is a latitude line. So, the coordinates that are changing as you move along the top of the map (in an East-West direction) must be longitude coordinates since the latitude should not change. The bottom edge of this map is not shown but you can predict what the latitude on the bottom edge should be: this map is of a region in Arizona and since Arizona is located north of the Equator, the latitude lines should increase from the bottom of the map towards the top of the map (as all latitude lines increase as you move north of the Equator). For a 7.5-minute map, the increase in latitude from the bottom corner to the top corner should be exactly 0°7’30” N. This gives the bottom corner of the map a latitude of 36°00’00” N.
All maps are a scaled-down version of the region of the world that they depict; if this were not the case, then the map that a person must carry would be the exact same size as a city (if it is a city map) or the size of a state (if it is a state map). Imagine trying to carry around with you a map of the entire country! The word “scale” refers to the amount of reduction, and all maps provide a map scale to indicate how much the area on the map has been reduced. Map scales are provided so that a map reader can determine exactly how much distance is actually represented on their map, or to measure the distance between two points on a map, or even to calculate the gradient of a hill or river. The two commonly used map scales on a topographic map are the bar scale (or graphical scale) and the fractional scale (also known as a ratio scale).
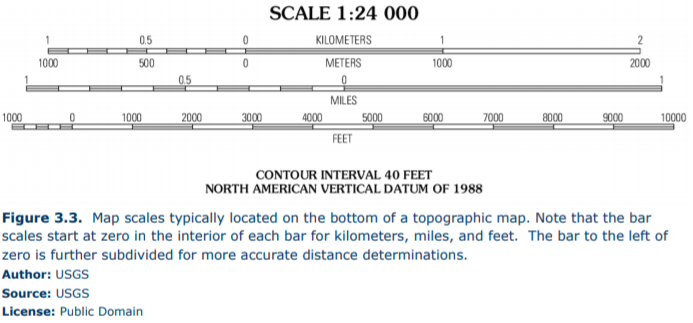
In Figure 3.3 there are three bar scales; each bar is a graphical representation of distance on the map, and it is up to the map reader to decide if they want to measure distances in kilometers, meters, miles, or feet. To find the distance between any two points on a map, a person could use a piece of paper to transfer the two points down to the bar scale and read the distance directly from the bar scale. Notice that each bar scale has the starting point (zero) within the interior of the scale, and not on the end of each scale (Figure 3.3).
The other type of map scale is the fractional scale; in Figure 3.3 the fractional scale is 1:24,000. No units are reported as this ratio of 1 to 24,000 is valid for any unit of measure, provided that it is the same unit. For example, if using inches, then this map scale indicates that 1 inch on the map is actually covering 24,000 inches of ground (the distance between two locations in the real world). Or if using centimeters, then 1 centimeter on the map is actually covering 24,000 centimeters of the ground. If our map was the same size as the area that it is representing (say, for example, a map of the room you are currently sitting in), then the fractional scale of your map would be 1:1, and your map would be the exact same size as your room! This brings us again to the definition of a map, which is a scaled-down version of a region that it is made to represent; maps that are greatly scaled-down (greatly reduced) are called small scale maps even though they represent large sections of the Earth. For example, a 1:500,000 map will show a large section of the Earth, but small details are lost (such as building locations or small streets), whereas a 1:12,000 map is a large scale map even though it shows a much smaller region of the Earth’s surface, but details can be seen (such as buildings, roads, and other landmarks). Placing your fingertip on the surface of a small scale map may cover an area of several miles, but placing your fingertip on a large scale map (such as 1:12,000) may cover only \(\frac{1}{10}\) of a mile.
One advantage of using a fractional or ratio scale is that any unit of measure can be used, and conversions are easy to make when needed. For example, for a 1:12,000 map 1 inch on the map is equal to 12,000 inches on the Earth’s surface, and since there are 12 inches in 1 foot, we can also say that 1 inch on the map is equal to 1000 feet on the Earth’s surface (convert the 12,000 inches to feet by multiplying by the conversion factor \(\frac{1\;ft}{12\;in}\)). Simply verbalizing this scale by saying “on this map, 1 inch represents 1000 feet” is the third type of map scale, which for obvious reasons is called a verbal scale. Writing the phrase “1 inch equals 1000 feet” is a way of adding a verbal scale to your map.
| Table 3.1: Some Useful Conversion Factors | |
| 1 foot = 12 inches | 1 meter = 3.28 feet |
| 1 mile = 5280 feet | 1 mile = 63,360 inches |
| 1 kilometer = 1000 meters | 1 kilometer = 0.62 miles |
Remember that since conversion factors are equalities, such as 1 foot = 12 inches, then dividing one by the other (\(\frac{1\;ft}{12\;in}\)) gives you 1, and since multiplying anything by 1 does not change any value, all we really are doing is changing the units. Therefore the calculation 5.5 ft x (\(\frac{12\;in}{1\;foot}\)) will allow 5.5 ft to be expressed as inches, which in this case would be 66 inches.