
2.6: Cascadia Subduction Zone
- Page ID
- 6749
\( \newcommand{\vecs}[1]{\overset { \scriptstyle \rightharpoonup} {\mathbf{#1}} } \)
\( \newcommand{\vecd}[1]{\overset{-\!-\!\rightharpoonup}{\vphantom{a}\smash {#1}}} \)
\( \newcommand{\id}{\mathrm{id}}\) \( \newcommand{\Span}{\mathrm{span}}\)
( \newcommand{\kernel}{\mathrm{null}\,}\) \( \newcommand{\range}{\mathrm{range}\,}\)
\( \newcommand{\RealPart}{\mathrm{Re}}\) \( \newcommand{\ImaginaryPart}{\mathrm{Im}}\)
\( \newcommand{\Argument}{\mathrm{Arg}}\) \( \newcommand{\norm}[1]{\| #1 \|}\)
\( \newcommand{\inner}[2]{\langle #1, #2 \rangle}\)
\( \newcommand{\Span}{\mathrm{span}}\)
\( \newcommand{\id}{\mathrm{id}}\)
\( \newcommand{\Span}{\mathrm{span}}\)
\( \newcommand{\kernel}{\mathrm{null}\,}\)
\( \newcommand{\range}{\mathrm{range}\,}\)
\( \newcommand{\RealPart}{\mathrm{Re}}\)
\( \newcommand{\ImaginaryPart}{\mathrm{Im}}\)
\( \newcommand{\Argument}{\mathrm{Arg}}\)
\( \newcommand{\norm}[1]{\| #1 \|}\)
\( \newcommand{\inner}[2]{\langle #1, #2 \rangle}\)
\( \newcommand{\Span}{\mathrm{span}}\) \( \newcommand{\AA}{\unicode[.8,0]{x212B}}\)
\( \newcommand{\vectorA}[1]{\vec{#1}} % arrow\)
\( \newcommand{\vectorAt}[1]{\vec{\text{#1}}} % arrow\)
\( \newcommand{\vectorB}[1]{\overset { \scriptstyle \rightharpoonup} {\mathbf{#1}} } \)
\( \newcommand{\vectorC}[1]{\textbf{#1}} \)
\( \newcommand{\vectorD}[1]{\overrightarrow{#1}} \)
\( \newcommand{\vectorDt}[1]{\overrightarrow{\text{#1}}} \)
\( \newcommand{\vectE}[1]{\overset{-\!-\!\rightharpoonup}{\vphantom{a}\smash{\mathbf {#1}}}} \)
\( \newcommand{\vecs}[1]{\overset { \scriptstyle \rightharpoonup} {\mathbf{#1}} } \)
\( \newcommand{\vecd}[1]{\overset{-\!-\!\rightharpoonup}{\vphantom{a}\smash {#1}}} \)
\(\newcommand{\avec}{\mathbf a}\) \(\newcommand{\bvec}{\mathbf b}\) \(\newcommand{\cvec}{\mathbf c}\) \(\newcommand{\dvec}{\mathbf d}\) \(\newcommand{\dtil}{\widetilde{\mathbf d}}\) \(\newcommand{\evec}{\mathbf e}\) \(\newcommand{\fvec}{\mathbf f}\) \(\newcommand{\nvec}{\mathbf n}\) \(\newcommand{\pvec}{\mathbf p}\) \(\newcommand{\qvec}{\mathbf q}\) \(\newcommand{\svec}{\mathbf s}\) \(\newcommand{\tvec}{\mathbf t}\) \(\newcommand{\uvec}{\mathbf u}\) \(\newcommand{\vvec}{\mathbf v}\) \(\newcommand{\wvec}{\mathbf w}\) \(\newcommand{\xvec}{\mathbf x}\) \(\newcommand{\yvec}{\mathbf y}\) \(\newcommand{\zvec}{\mathbf z}\) \(\newcommand{\rvec}{\mathbf r}\) \(\newcommand{\mvec}{\mathbf m}\) \(\newcommand{\zerovec}{\mathbf 0}\) \(\newcommand{\onevec}{\mathbf 1}\) \(\newcommand{\real}{\mathbb R}\) \(\newcommand{\twovec}[2]{\left[\begin{array}{r}#1 \\ #2 \end{array}\right]}\) \(\newcommand{\ctwovec}[2]{\left[\begin{array}{c}#1 \\ #2 \end{array}\right]}\) \(\newcommand{\threevec}[3]{\left[\begin{array}{r}#1 \\ #2 \\ #3 \end{array}\right]}\) \(\newcommand{\cthreevec}[3]{\left[\begin{array}{c}#1 \\ #2 \\ #3 \end{array}\right]}\) \(\newcommand{\fourvec}[4]{\left[\begin{array}{r}#1 \\ #2 \\ #3 \\ #4 \end{array}\right]}\) \(\newcommand{\cfourvec}[4]{\left[\begin{array}{c}#1 \\ #2 \\ #3 \\ #4 \end{array}\right]}\) \(\newcommand{\fivevec}[5]{\left[\begin{array}{r}#1 \\ #2 \\ #3 \\ #4 \\ #5 \\ \end{array}\right]}\) \(\newcommand{\cfivevec}[5]{\left[\begin{array}{c}#1 \\ #2 \\ #3 \\ #4 \\ #5 \\ \end{array}\right]}\) \(\newcommand{\mattwo}[4]{\left[\begin{array}{rr}#1 \amp #2 \\ #3 \amp #4 \\ \end{array}\right]}\) \(\newcommand{\laspan}[1]{\text{Span}\{#1\}}\) \(\newcommand{\bcal}{\cal B}\) \(\newcommand{\ccal}{\cal C}\) \(\newcommand{\scal}{\cal S}\) \(\newcommand{\wcal}{\cal W}\) \(\newcommand{\ecal}{\cal E}\) \(\newcommand{\coords}[2]{\left\{#1\right\}_{#2}}\) \(\newcommand{\gray}[1]{\color{gray}{#1}}\) \(\newcommand{\lgray}[1]{\color{lightgray}{#1}}\) \(\newcommand{\rank}{\operatorname{rank}}\) \(\newcommand{\row}{\text{Row}}\) \(\newcommand{\col}{\text{Col}}\) \(\renewcommand{\row}{\text{Row}}\) \(\newcommand{\nul}{\text{Nul}}\) \(\newcommand{\var}{\text{Var}}\) \(\newcommand{\corr}{\text{corr}}\) \(\newcommand{\len}[1]{\left|#1\right|}\) \(\newcommand{\bbar}{\overline{\bvec}}\) \(\newcommand{\bhat}{\widehat{\bvec}}\) \(\newcommand{\bperp}{\bvec^\perp}\) \(\newcommand{\xhat}{\widehat{\xvec}}\) \(\newcommand{\vhat}{\widehat{\vvec}}\) \(\newcommand{\uhat}{\widehat{\uvec}}\) \(\newcommand{\what}{\widehat{\wvec}}\) \(\newcommand{\Sighat}{\widehat{\Sigma}}\) \(\newcommand{\lt}{<}\) \(\newcommand{\gt}{>}\) \(\newcommand{\amp}{&}\) \(\definecolor{fillinmathshade}{gray}{0.9}\)“Then there were lightning flashes, rumblings, and peals of thunder, and a great earthquake. It was such a violent earthquake that there has never been one like it since the human race began on Earth.”
Book of Revelation 16:18
“Earthquake said, ‘Well, I shall tear up the earth.’ Thunder said, ‘That’s why I say we will be companions, because I shall go over the whole world and scare them. …’ So [Thunder] began to run, and leaped on trees and broke them down. Earthquake stayed still to listen to his running. Then he said to him, ‘Now you listen: I shall begin to run.’ He shook the ground. He tore it and broke it in pieces. . . All the trees shook; some fell.”
Yurok legend told by Tskerkr of Espeu, recorded by A. L. Kroeber
1. Discoveries Beneath the Sea
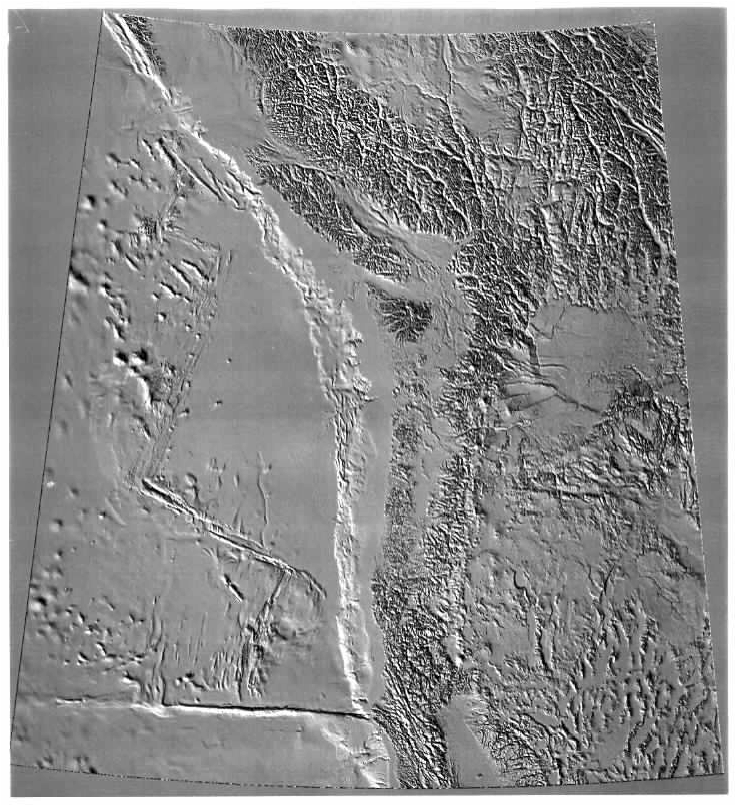
It is late summer of 1989. Chris Goldfinger and Bruce Appelgate, graduate students at Oregon State University, and electronics technician Kevin Redman of Williamson and Associates, are in the science lab of OSU’s research ship Wecoma, looking on the TV monitor at side-scan sonar imagery taken as the Wecoma cruises above the base of the continental slope along the Cascadia Subduction Zone off central Oregon. The ship tows a “fish,” an instrument gliding thousands of feet beneath the sea surface and emitting sound signals that echo back from the sea floor to the fish and are then transmitted to the lab aboard ship. On the video screen, these images look like aerial photos, showing the ocean floor in in black and white in unprecedented clarity and detail. But these “photos” are created from reflected sound waves, not reflected light. The experience is like being in a balloon drifting slowly through the sky, and looking down at a hitherto-unseen landscape. It is late summer of 1989,
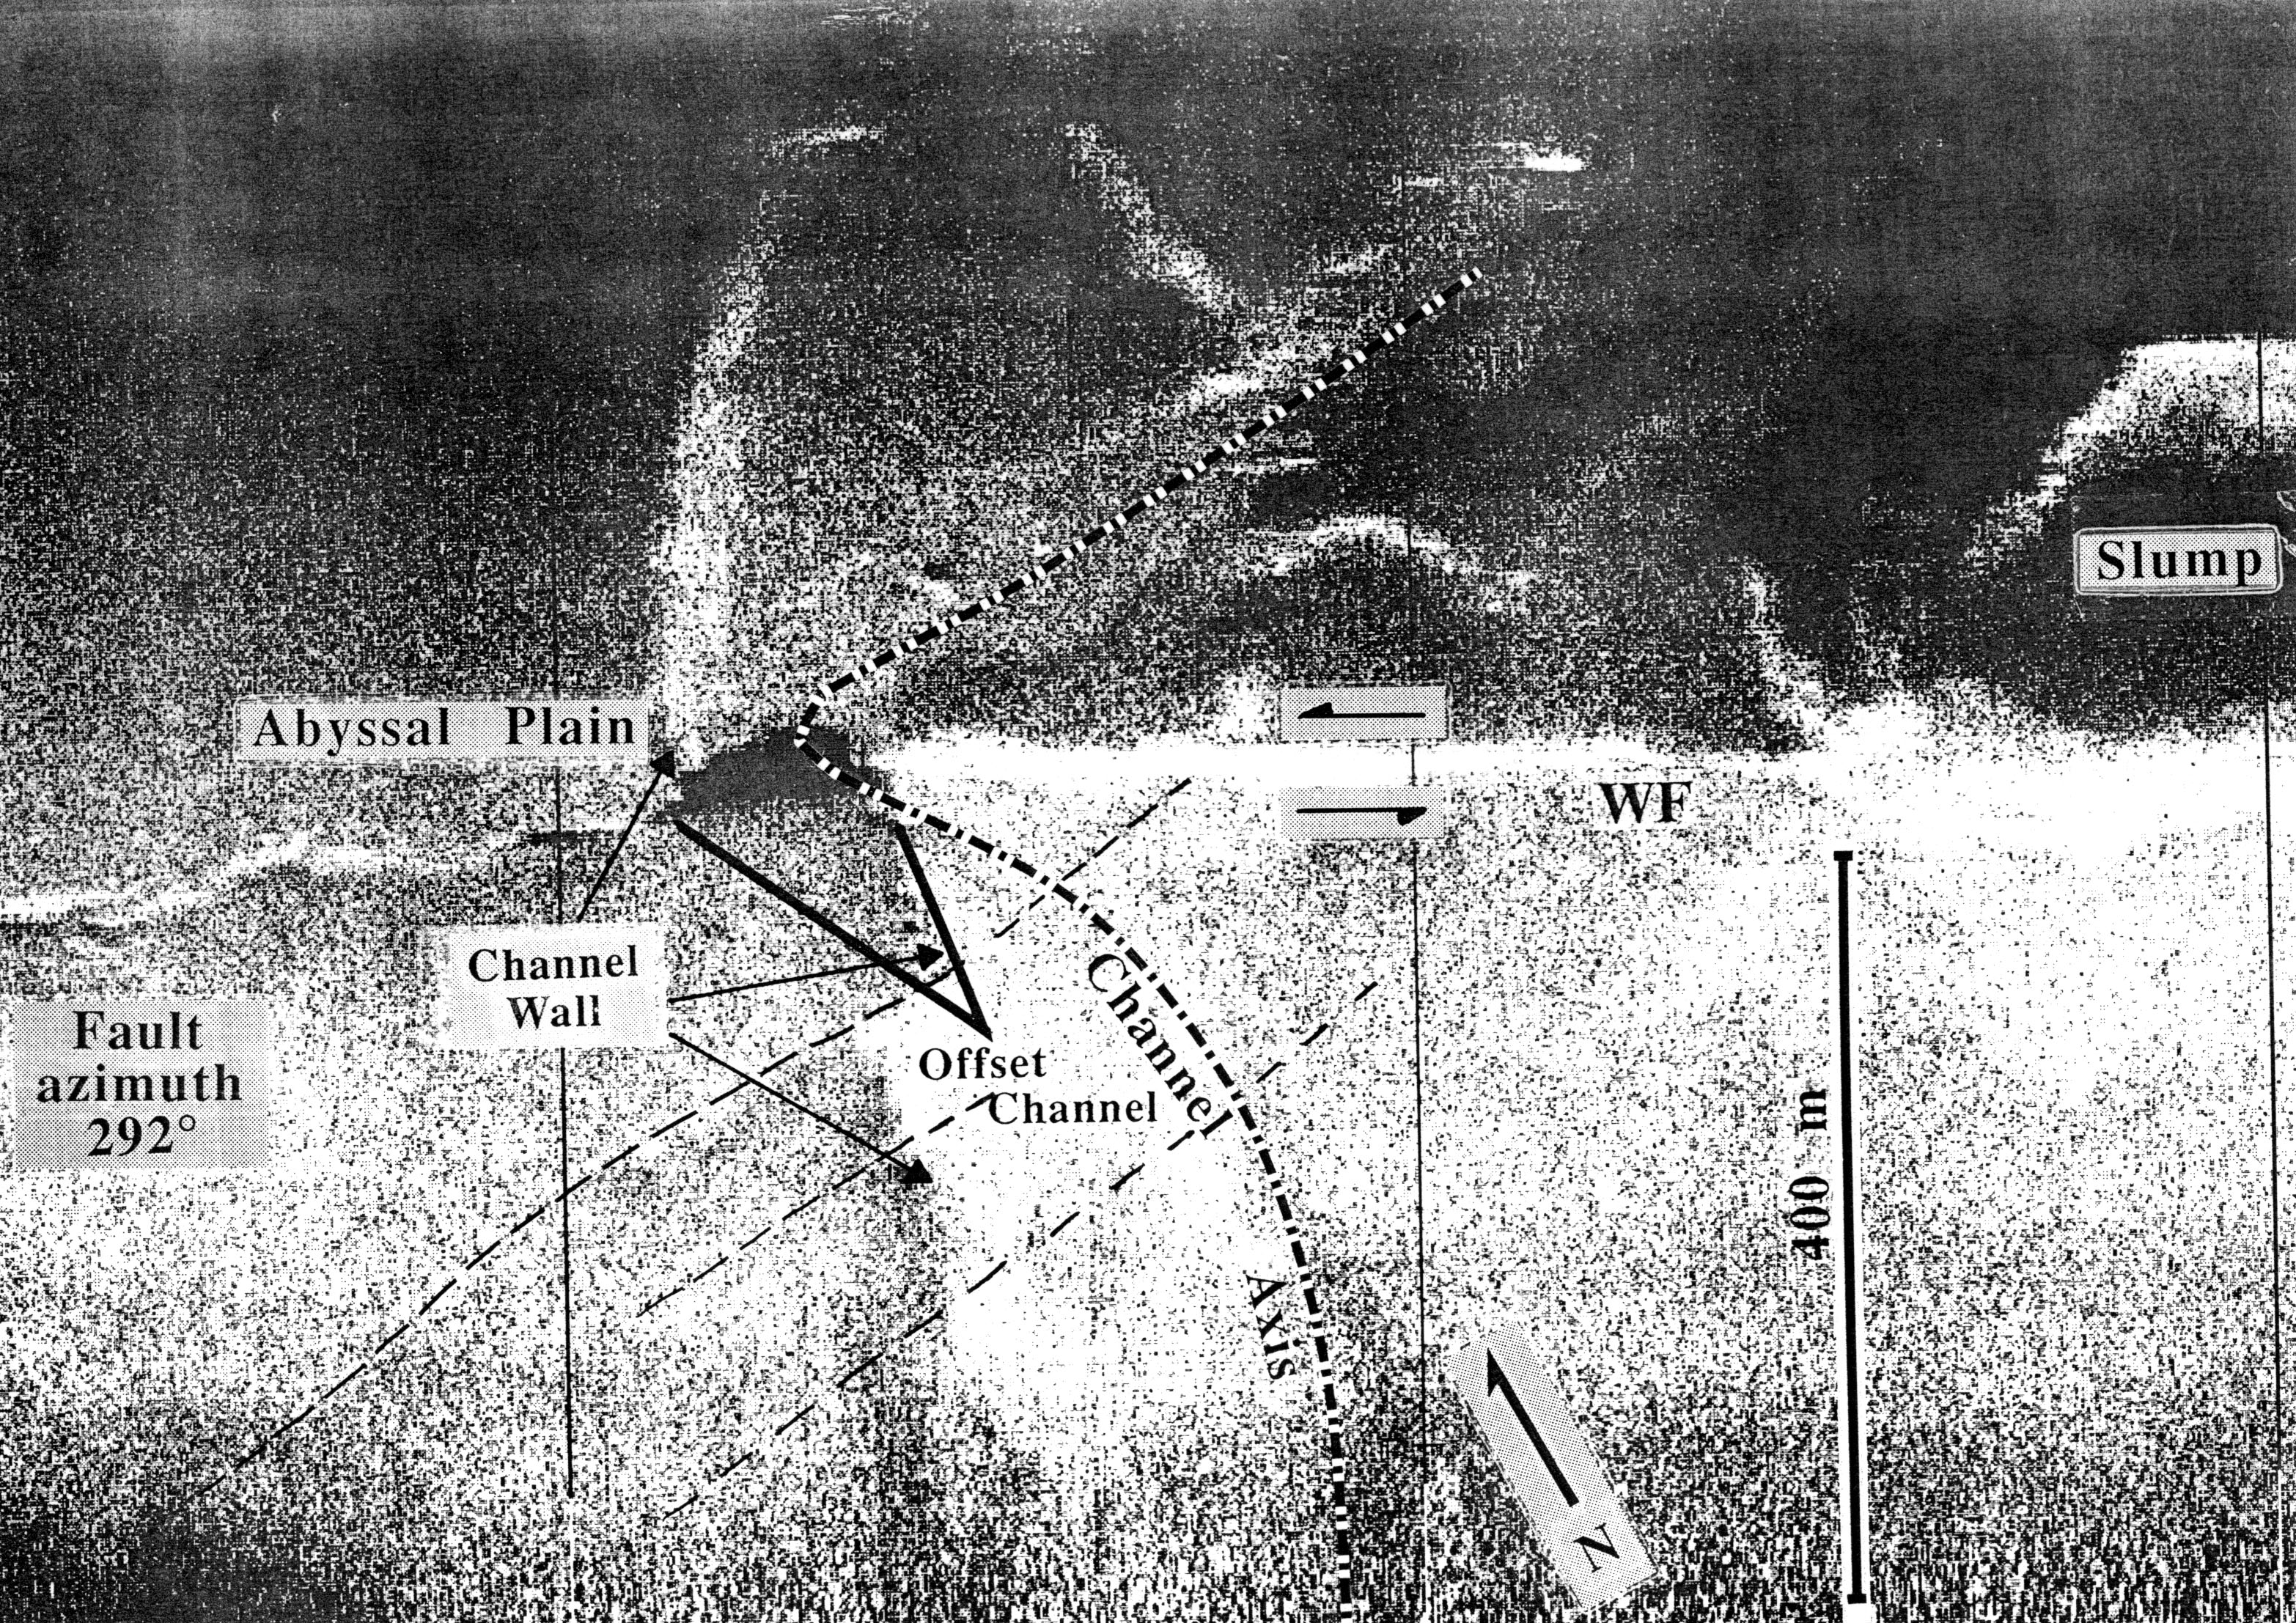
Suddenly Goldfinger sees a fault. Crossing the screen in a straight line, it offsets by strike slip a sea-floor channel and a landslide, and it buckles the sea floor into a low hill. The image of the faulted channel on the video screen looks oddly like a man with a guitar, so naturally it becomes known as “Elvis” (Figure 4-1). Unfortunately, that name doesn’t stick, and it is formally named the Wecoma Fault for the ship that found it.
Later, the research submarine Alvin would descend to the pitch-black base of the continental slope, and scientists in the crowded cockpit of the sub would locate the fault zone in the glare of the headlights of the sub and sample it. The rocks are strongly sheared, with linear grooves, proof that this is a place where rock grinds against rock.
Using side-scan sonar imagery and topographic mapping of the sea floor by the National Oceanic and Atmospheric Administration (NOAA), Goldfinger would find at least nine of these strike-slip faults off the Washington and Oregon coast, cutting both the Juan de Fuca Plate and the adjacent North American continental slope. He and Mary MacKay of the University of Hawaii would find active folds buckled up as the Juan de Fuca Plate drives beneath the North American continent (Figure 4-2). Their conclusion: the lower part of the North American continent close to the subduction zone is everywhere being crushed and deformed into faults and folds, like snow on the front of a snowplow blade. The source of the destruction: a much larger fault, previously hidden, which slopes gently landward beneath this highly deformed zone, as shown by a seismic-reflection profile similar to those acquired by the petroleum industry (Figure 4-2).
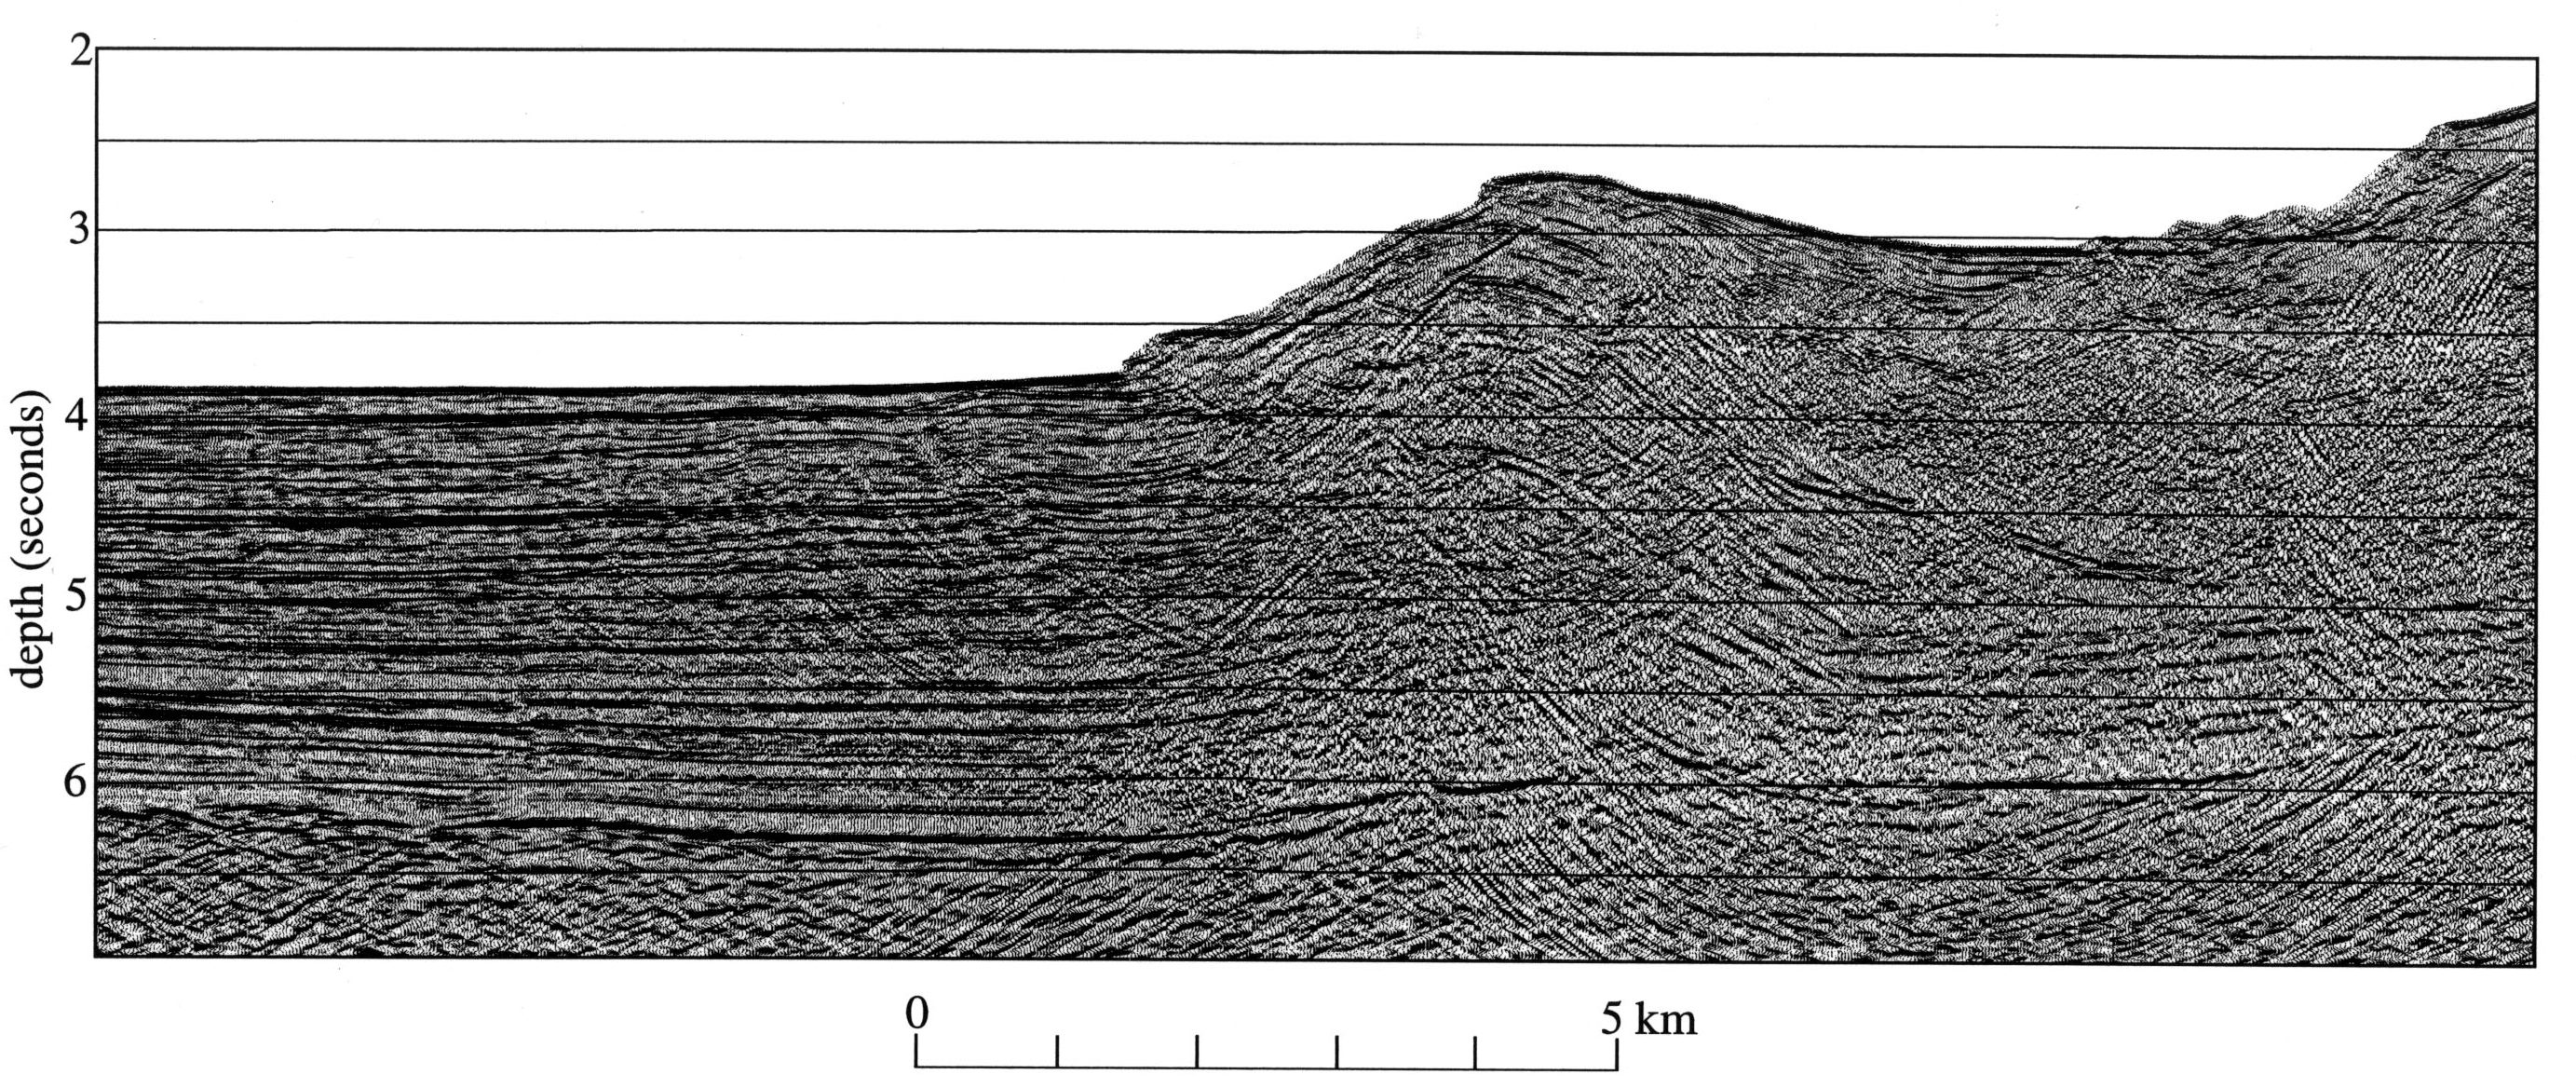
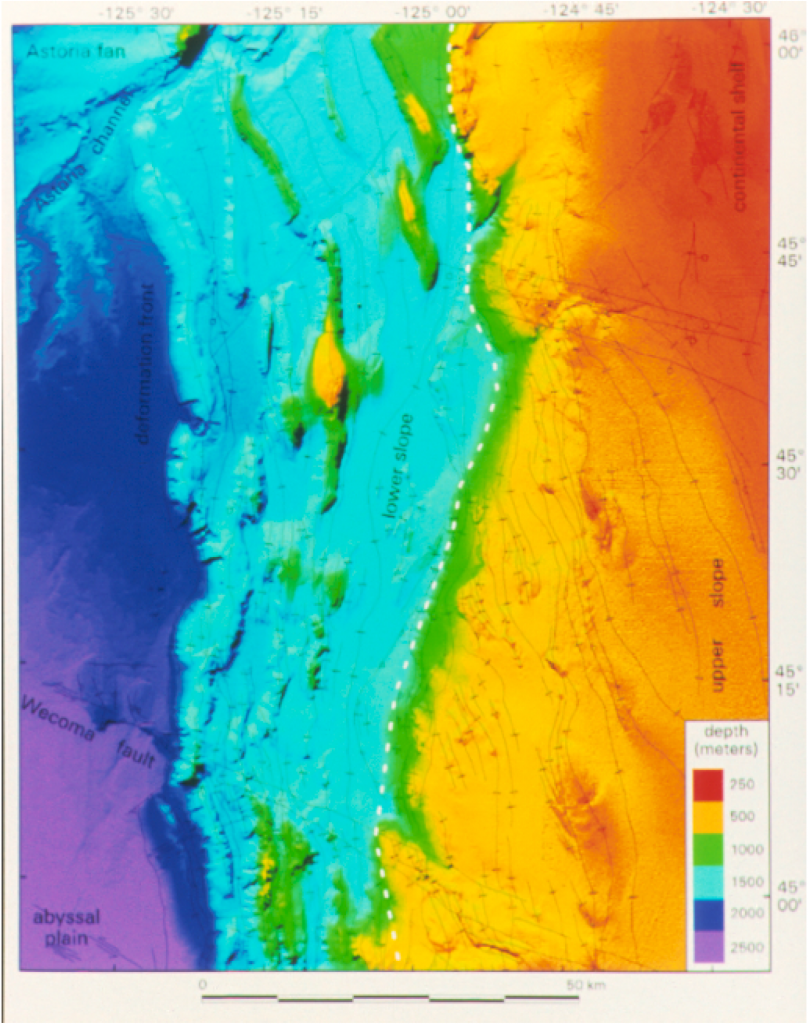
In oceanographic expeditions criss-crossing the base of the continental slope, one of the world’s great earthquake faults is slowly coming into view (Figure 4-3), a fault that carries the North American continent on its back as it crushes the deep-sea sediment of the Juan de Fuca Plate beneath it. For three decades after the first discovery that Cascadia is an active subduction zone, the fault itself could only be viewed by seismic-reflection profiles (Figure 4-2) and by relatively crude depth soundings. With new technology developed by NOAA, the fault can be imaged at the base of the continental slope from Vancouver Island to northern California. On the west side of the fault is the broad sediment-covered plain of the Juan de Fuca Plate, marked only by long, meandering channels carved by sand-laden currents that flow along the sea floor (Figure 4-4). This plain stretches away westward to the Juan de Fuca Ridge (Figures 2-4, 4-5), where new oceanic crust is formed by volcanoes at rifts along the ridge axis.
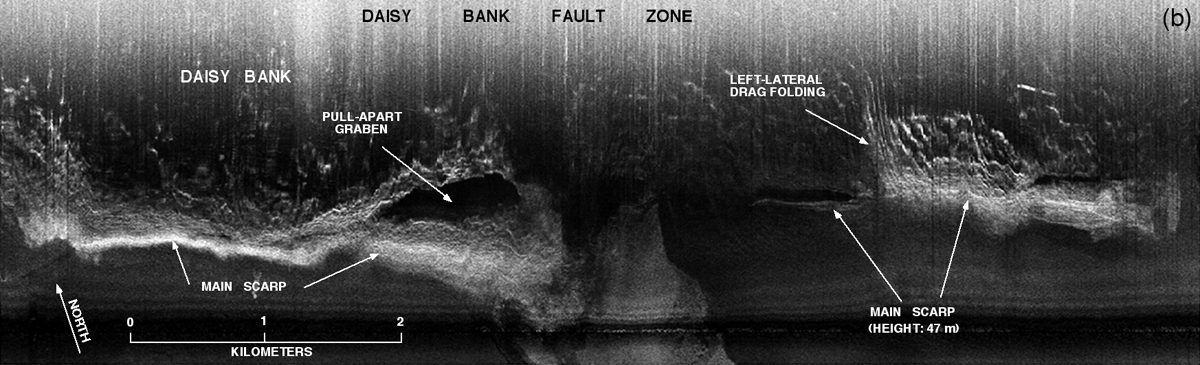
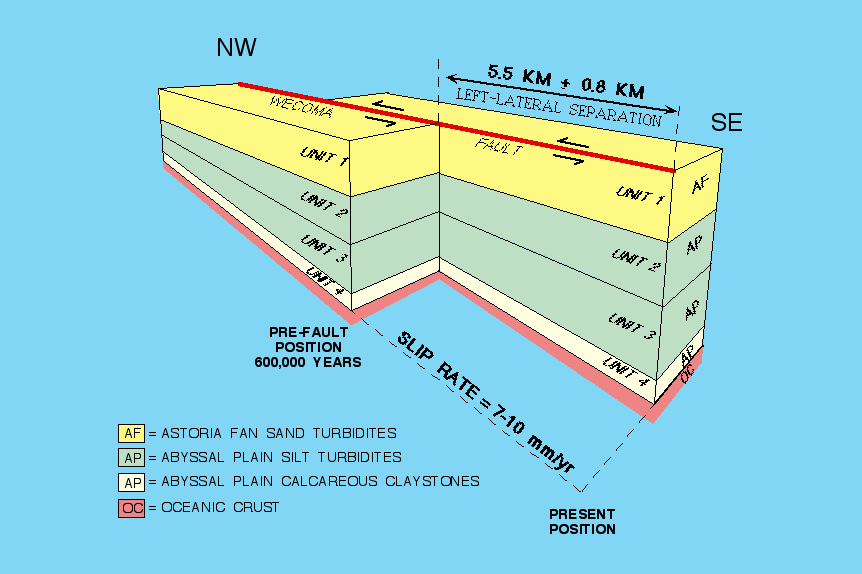
East of the subduction-zone fault, the continental slope rises as a rugged mountain wall, with fold ridges heaved up where the plates converge (Figures 4-4, 4-5). The lower part of the continental block is cut by west-northwest-trending strike-slip faults (Figures 4-1, 4-3a, b), formed because the Juan de Fuca Plate intersects North America obliquely, and North America is deformed like a stack of books on a shelf. Figure 4-3a shows the Daisy Bank fault west of Newport, showing structures similar to those formed by strike-slip faults in California. If the ages of sedimentary layers are known, the strike-slip rate on the fault may be determined (Figure 4-3b). Landslides off southern Oregon, also related to subduction, are tens of miles across. Off Washington, the continental slope is carved into great submarine canyons, including the Astoria Canyon off the coast of norther Oregon, west of the mouth of the Columbia River (Figure 4-4). North of the Astoria Canyon is another canyon, then another and another, cutting deeply into the slope off Washington (Figure 4-5). At the top of the slope is the continental shelf, a flat surface carved during lower sea-levels of the Ice Ages. East of that, finally, is the shoreline itself (Figure 4-5).
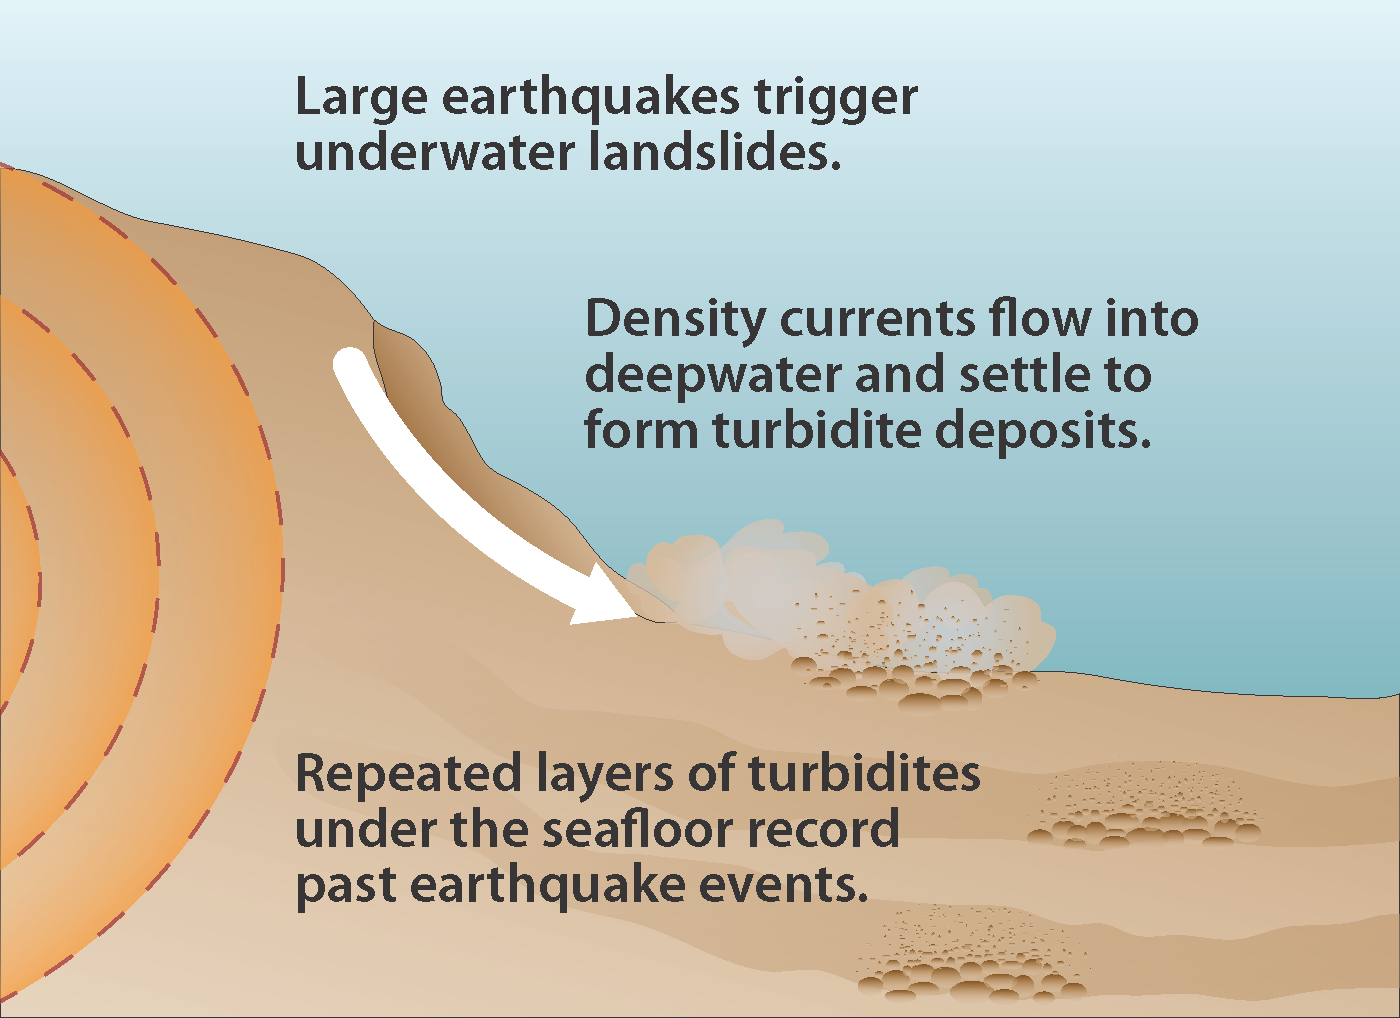
These submarine canyons were not eroded by running water, as canyons on land are, because the continental slope was never above sea level. They were cut during the last few hundred thousand years, in the Pleistocene, by slurries of water and sand brought to the sea by the Columbia River, swollen with floodwater from melting ice sheets in British Columbia and the Rocky Mountains, and by other major rivers draining melting glaciers in Puget Sound and surrounding mountains and flowing west through the present Strait of Juan de Fuca and down a broad valley south of the Olympic Mountains of southwest Washington. The muddy and sandy water was heavier than clear seawater, so it churned violently down the continental slope like great snow avalanches, carving the submarine canyons in the process (Fig. 4-6). The avalanches traveled for hundreds of miles, far out onto the Juan de Fuca Abyssal Plain. When the currents finally stopped, the sediment settled out as turbidites, sand and mud deposits named for the turbid water that carried them.
In the ten thousand years since the Pleistocene, the Columbia River floods have been smaller, more like they are today, and they no longer have the energy to generate the sediment avalanches that carved the submarine canyons and deposited the thick turbidite layers in the Pleistocene. However, Hans Nelson and Gary Griggs, when they were graduate students at OSU working under the direction of Professor LaVerne Kulm, found thinner turbidite layers deposited within the Pleistocene channels, even far out on the abyssal plain. Interspersed among these turbidites is a layer of ash deposited on land by the cataclysmic eruption of Mt. Mazama to form Crater Lake 7,700 years ago (Figure 4-7), then washed into the Columbia River by its tributaries and carried out to sea. These turbidites were clearly not related to the melting of Pleistocene glaciers, so how could they have formed?

John Adams had been an invited guest at a meeting of the Oregon Academy of Sciences in 1987 debating the paradigm change of great earthquakes in the Pacific Northwest (discussed in the Introduction). After the meeting, Adams visited the core lab at OSU to study the cores that Kulm’s students had taken many years before to test his hypothesis that these turbidites had been triggered by great earthquakes.
Adams found that three of the cores taken along the length of the Cascadia deep-sea channel contained thirteen turbidites deposited since the eruption of Mazama Ash (Figure 4-7). Other cores from Juan de Fuca submarine canyon, below the confluence of several submarine canyons carving the continental slope off Washington, had the same number of turbidites above the Mazama Ash as in these canyons upstream from the confluence (inset, Figure 4-5). If turbidites in the upper canyons had been deposited by local events limited to an individual stream flood, the Juan de Fuca Canyon should have contained a much larger number of turbidites because they would all have collected downstream past the confluence. This convinced Adams that the turbidites had not been triggered by a local event within a single canyon but a regional event that affected the entire Washington and Oregon offshore as far south as the Rogue River submarine canyon (which also had thirteen turbidites above the Mazama Ash).
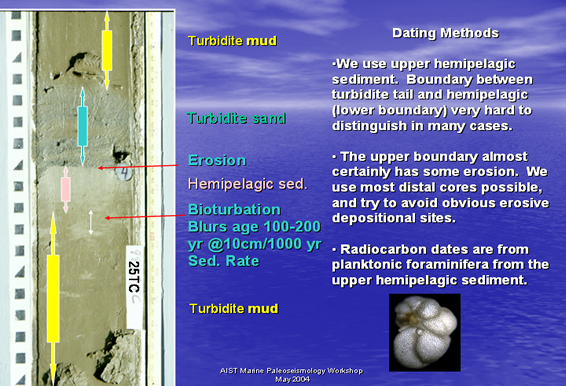
Chris Goldfinger and Hans Nelson continued the study of the turbidites, collecting additional cores and subjecting them to radiocarbon dating. They dated the shells of microscopic organisms within the layers of fine-grained sediment that rained down into the canyons, clay that was interrupted by each turbidite (Figure 4-8). As in other paleoseismological work, they could not date the turbidite directly, and thus the earthquake that generated it. The turbidite would be dated only as younger than one fine-grained sediment layer and older than another.
Because thirteen turbidites had accumulated in the 7,700 years since the eruption of Mt. Mazama in most of the submarine channels (some channels had fewer turbidite layers), Adams had been able to determine the average recurrence interval of Cascadia turbidites as about six hundred years. Goldfinger and Nelson were able to confirm this recurrence interval using the large number of radiocarbon dates they obtained and, in addition, to date older turbidites back to ten thousand years ago. Just as a consistent thirteen turbidites had accumulated since the Mazama Ash, eighteen turbidites (Figure 4-9) had been deposited in the past ten thousand years, a recurrence interval of more than five hundred and fifty years. The presence of thirteen post-Mazama turbidites in the Juan de Fuca, Cascadia, Willapa, Grays, Astoria, and Rogue canyons demonstrated to Goldfinger and Nelson that all turbidites had been deposited by events that had affected most, if not all, of the Cascadia Subduction Zone. The only trigger that made sense was a subduction-zone earthquake affecting the entire Washington and Oregon offshore.
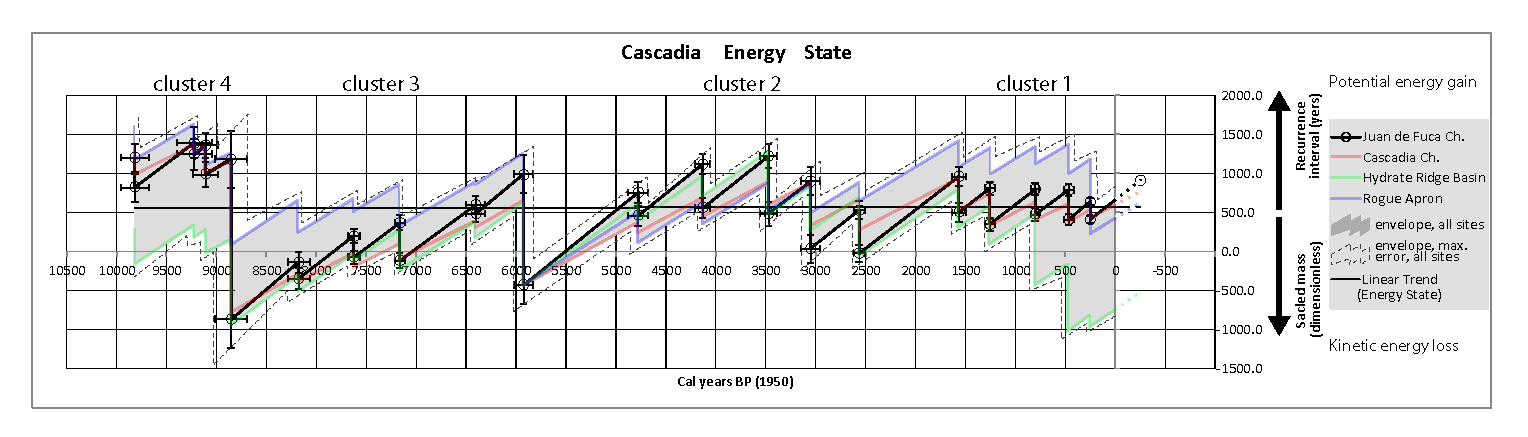
Figure 4-9 identifies Cascadia earthquakes that have occurred in the past 10,000 years based on the turbidite evidence illustrated in Figures 4-6, 4-7 and 4-8. It is clear from Figure 4-9 that earthquake recurrence is not periodic, meaning that the earthquake history does not have value in predicting the next one except in a very general way. Earthquake recurrence intervals vary from 200 years to more than a thousand years. In addition, the earthquakes varied in magnitude, with the largest events 5900 and 8800 years ago, considerably larger than the magnitude 9 earthquake dated at 1700 A.D. (Figure 4-9) and described in greater detail below.
2. Earthquakes in the Estuaries
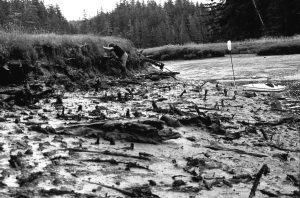 Figure 4-10a. Niawiakum estuary in Willapa Bay, Washington, at very low tide, showing roots of a coastal forest drowned by sudden subsidence during earthquakes in 1700 AD and around 1600 years ago. Photo by Brian Atwater, USGS. b. Same exposure examined by paleoseismologist Jim McCalpin. Forest is similar to living forest in background. Photo by Robert Yeats. | 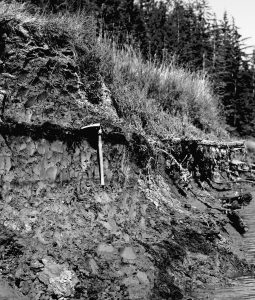 Figure 4-10b. In this close-up view of the Niawiakum exposure, the three-hundred-year soil is marked by the shovel blade. Note the exposed tree root at the right edge of the photo. A marsh similar to the one at the top of the picture was overwhelmed by the ocean, and gray clay with fossils was deposited on top. Photo by Brian Atwater, USGS. |
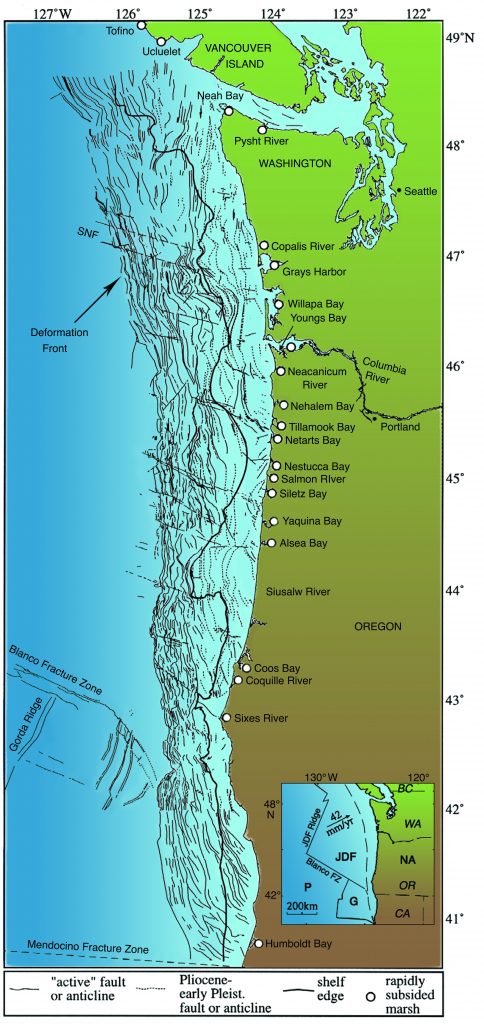
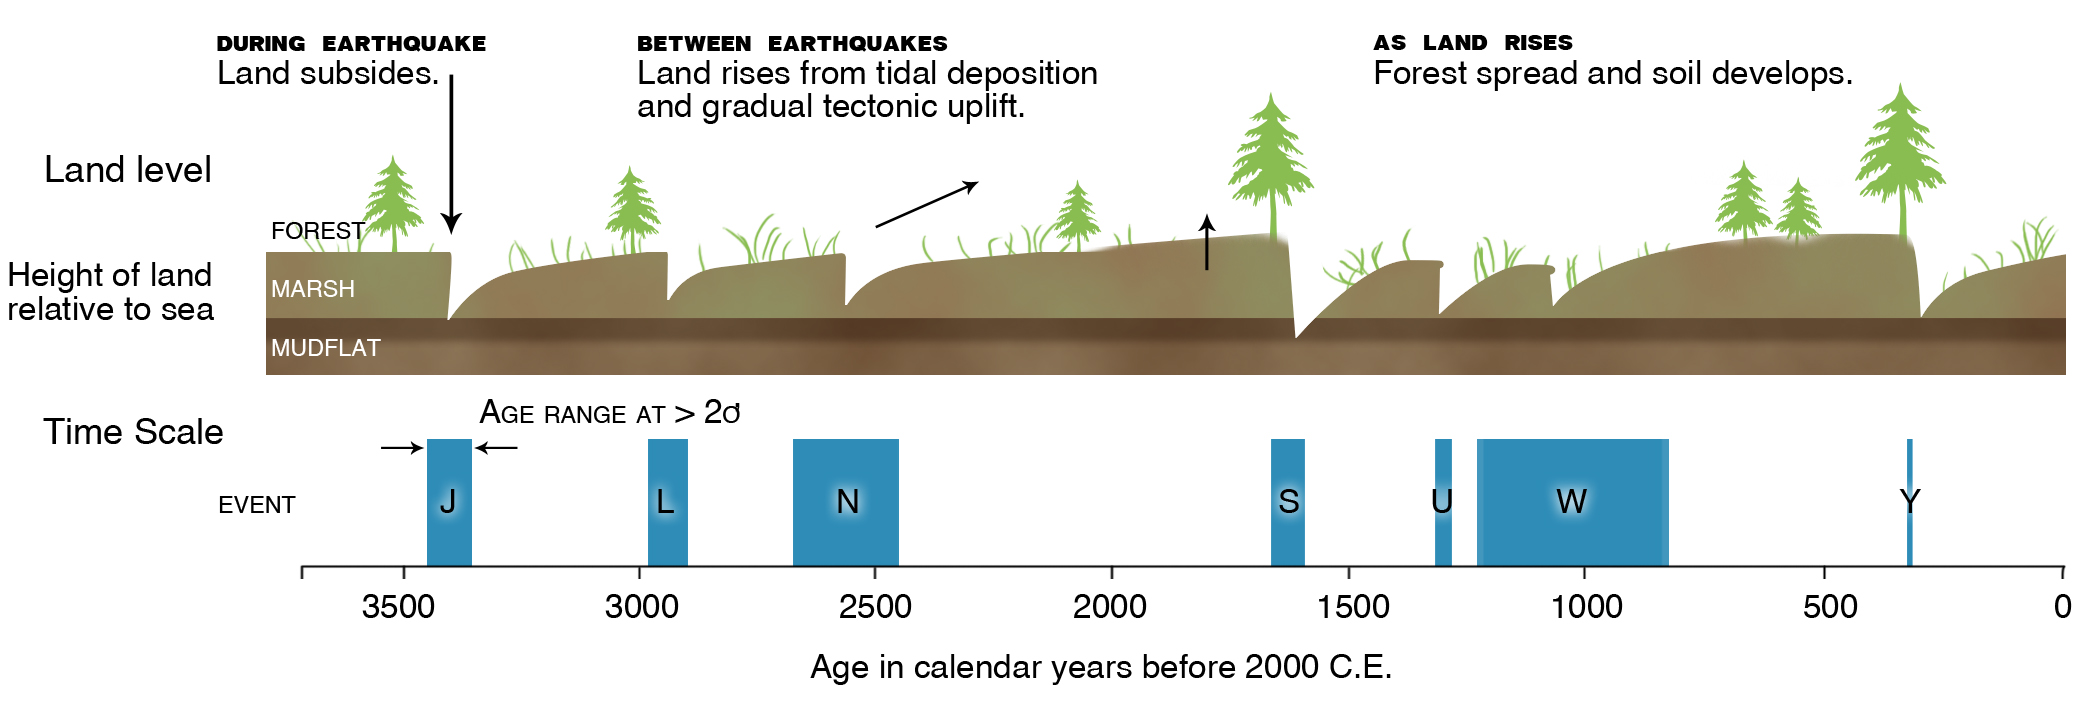
It was in the bays and estuaries along the coastline that the most conclusive evidence for great earthquakes was found by Brian Atwater and his American and Canadian colleagues, as stated in the Introduction (Figures 4-10a, b, 4-11). From Port Alberni, at the end of a deep fjord on the west coast of Vancouver Island, to Sixes River in southern Oregon, and at many bays and estuaries in between (Figure 4-12), the sediments give evidence of sudden drops in the land level. The marshes and forests were found to be overlain directly by gray clay with marine microfossils (Figure 4-10), which Atwater could explain only by sudden subsidence of the coastline. Some of these drops appeared to have been accompanied by great waves from the sea that deposited sand on the marsh deposits (Figure 8-12). The last of these waves struck about three hundred years ago. Atwater’s explanation was the catastrophic explanation: great earthquakes on the subduction zone.
Scientists from Japan, England, and New Zealand, including specialists in the ecology of marshes and estuaries, critically scrutinized this evidence to look for defects in Atwater’s earthquake hypothesis and to search for another, less apocalyptic, explanation. They were unable to find support for a non-seismic explanation for any of seven marsh soils buried at Willapa Bay in southwest Washington. For some of the buried marsh deposits, however, the evidence is ambiguous. These could have other origins such as gigantic Pacific storms or changes in the configuration of the estuary itself. But all soon agreed that the burial of marshes that took place three hundred and sixteen hundred years ago, at least, was caused by sudden submergences of the coast at the time of two great Cascadia earthquakes (Figure 4-10 and 4-11). Later, other burials would also be blamed on earthquakes.
3. The Bad News
The new discoveries went against the long-held view that the Cascadia Subduction Zone was not a seismic hazard. Most subduction zones around the world are shaken by frequent earthquakes, some of magnitude 9 or greater. But not Cascadia, which has been as seismically quiet as Kansas. At first, it was believed that the apparent absence of recorded earthquakes might be because the Juan de Fuca Plate is no longer subducting beneath North America. The eruption of Mt. St. Helens on May 18, 1980, was a dramatic demonstration that subduction is still going on.
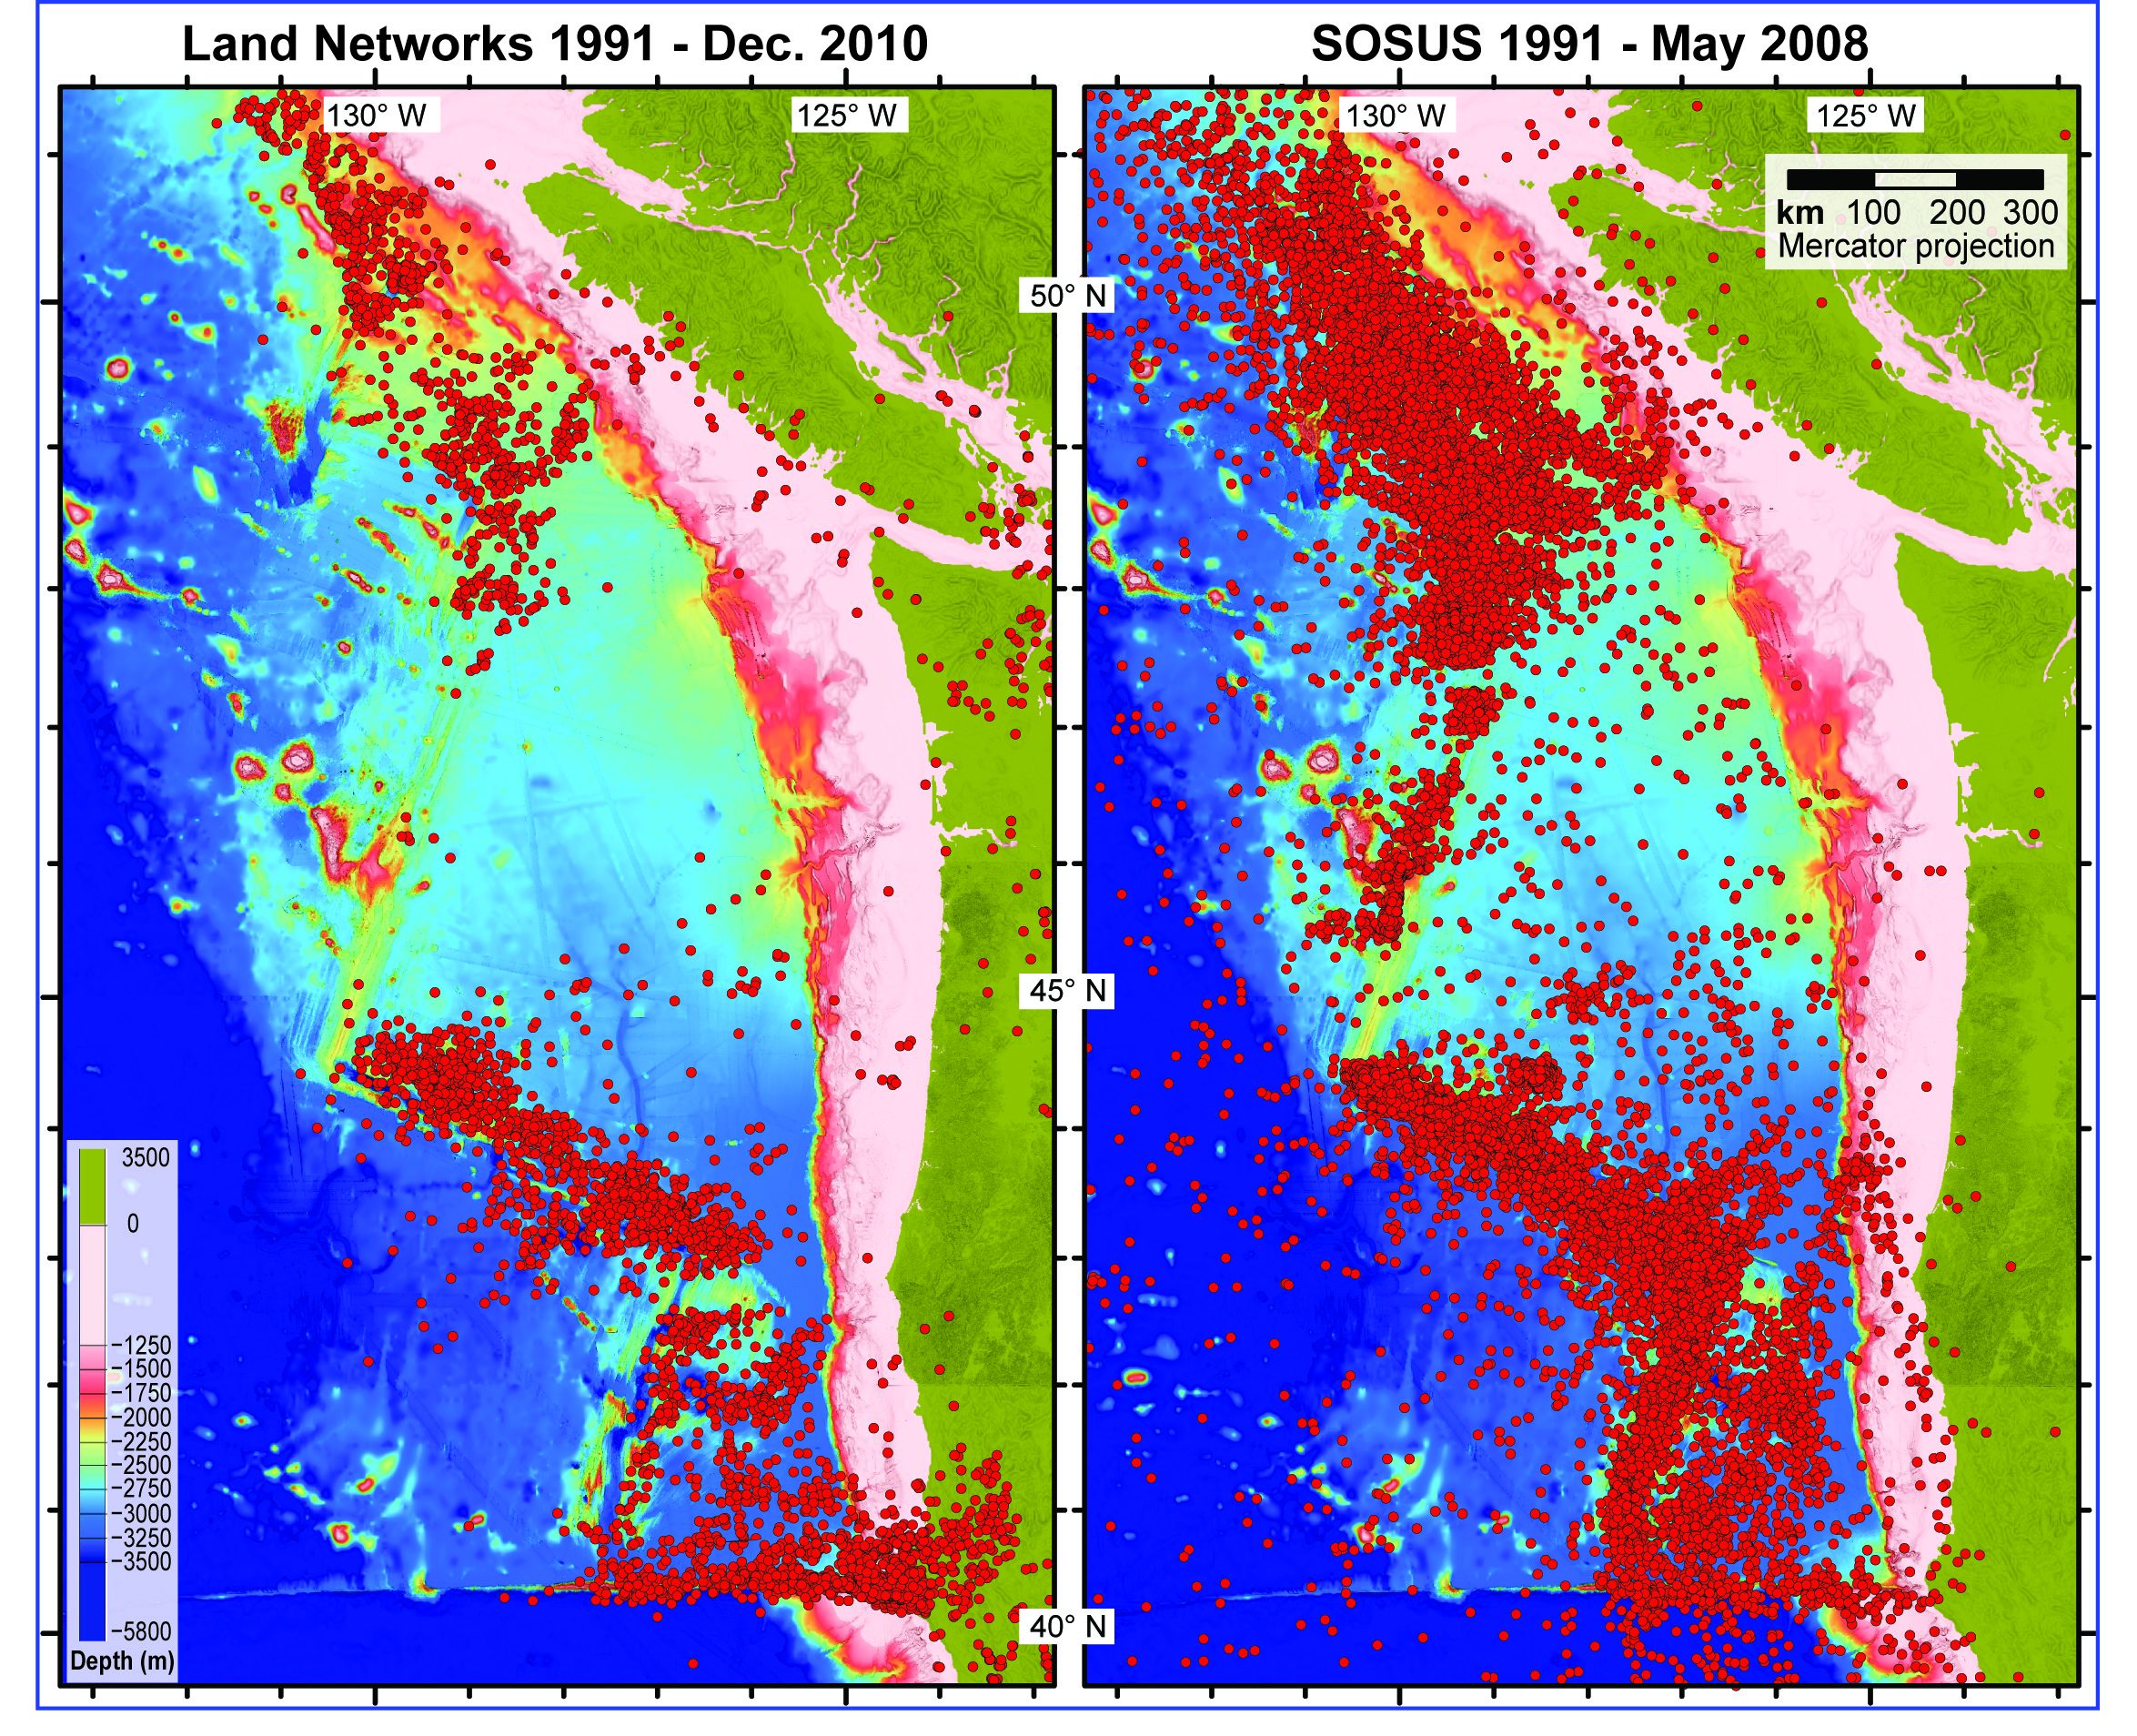
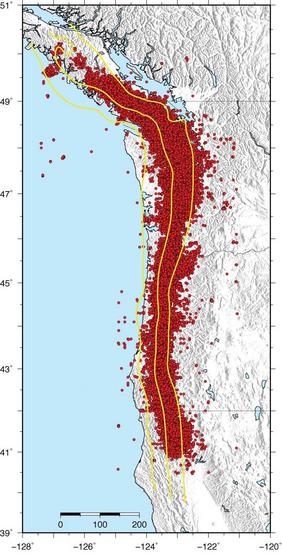
Then it was suggested that the absence of recorded earthquakes is due to relatively few seismographs in the Pacific Northwest. But in the last thirty years, the University of Washington, the USGS, and the Geological Survey of Canada have deployed an extensive network of seismographs throughout the region. This sophisticated network recorded many earthquakes in the continental crust and within the subducting Juan de Fuca Plate, but almost none precisely on the subduction zone itself (Figure 4-13, left). Are land-based seismic network sensitive enough to record smaller earthquakes on the subduction zone?
In the past decade, the U. S. Navy has opened access to the hydrophone arrays it had established to monitor enemy submarines by recording the sound waves from their engines. These hydrophone arrays record not only submarine-engine noise, but also record volcanic activity at sea-floor spreading centers, whale calls—and earthquakes. Research by Bob Dziak and his colleagues at NOAA shows that SOSUS arrays reveal unprecedented details about the seismicity of the Juan de Fuca spreading ridge and other sea floor features. But even at those listening levels, the subduction zone remains quiet (Figure 4-13, right). Why?
For a long time, it was thought (perhaps “hoped” is a better word) that the absence of earthquakes meant that the slippery subduction zone slides smoothly beneath the continent. Subduction without earthquakes was still being suggested in a paper in a major scientific journal as recently as 1979. But in 1980, as mentioned in the preceding chapter, Jim Savage of the USGS and his colleagues began repeated measurements of networks of surveying benchmarks around Seattle, in Olympic National Park (Figures 3-19, 3-20), and the Hanford Nuclear Reservation. Their conclusion: these networks show that the crust is being slowly deformed in a way that is best explained by elastic strain building up in the crust, like the examples in Figures 3-2 and 3-3. The obvious source of this strain: the Cascadia Subduction Zone. The reason that there have been no earthquakes on the subduction zone is an ominous one: the subduction zone is locked. Completely locked! If this is the case, then strain must ultimately build up along the subduction-zone fault, inexorably, at 1.6 inches per year, until eventually the subduction zone will rupture in a massive earthquake.
At about the same time (as already reported in the Introduction), John Adams, then of Cornell University, was studying the resurveys of highway benchmarks and discovering that the coastal regions of Oregon and Washington are being slowly tilted eastward. A few years later, Heaton and Kanamori showed that the geophysical setting of Cascadia is like that of southern Chile, where the largest earthquake of the twentieth century struck in 1960. A short time after that, in 1986, Brian Atwater paddled up the Niawiakum River estuary in his kayak and discovered the submerged marshes and forests of Willapa Bay (located in Figure 4-10).
For about ten years, starting in the late 1970s, the argument raged among scientists about whether or not the Cascadia Subduction Zone poses an earthquake threat, triggered by a major economic and political issue: was it safe to build and operate nuclear power plants in western Washington and Oregon and northern California? Proponents of the big-earthquake hypothesis were led by scientists of the USGS, influenced by geodesists such as Jim Savage who were re-surveying benchmarks, and later by geologists like Brian Atwater. As described in the Introduction, it was only in 1987 that the controversy was finally resolved at the Oregon Academy of Sciences meeting in Monmouth, Oregon, where it was recognized that the paradigm change had occurred, at least among scientists. Most of the leading Cascadia earthquake researchers agreed at this meeting that the Cascadia Subduction Zone does indeed pose a major earthquake threat. When a paradigm change takes place, particularly for a topic that has such an impact on society, scientists take on a new mission: to inform the general public of the consequences and implications of this new discovery. This book is part of that missions
Even though there was general agreement that there would be huge earthquakes on the Cascadia Subduction Zone, a new debate began over how big the expected earthquake would be. Would it be of magnitude 8 or 9? This difference is not, as some have suggested, analogous to being struck by a tractor-trailer or a compact car!
Although there is agreement that the absence of seismicity on the subduction zone cannot be used as evidence for an absence of subduction-zone earthquakes, the question arises: why does Cascadia lack any seismicity on the subduction zone itself? Figure 4-13 shows that the northern and southern ends of the subduction zone in the Explorer and Gorda plates have seismicity, probably due to internal plate deformation. In addition, the southern end of the subduction zone was struck by an earthquake of magnitude 7.1 on April 25, 1992. Only the central part between southern Vancouver Island and northern California lacks seismicity on the subduction zone. Ivan Wong, a consulting seismologist with Oregon roots, examined this problem and pointed out that the only part of the subduction zone that lacks earthquakes contains a huge slab of basalt crust many kilometers thick called Siletzia. This thick slab serves as an insulator against the high temperatures of young incoming crust of the Juan de Fuca Plate. Is this why there are no earthquakes on the subduction zone in this part of Cascadia? This problem needs further work, and I return to it later in the chapter.
4. Instant of Catastrophe or Decade of Terror?
After Atwater’s discovery at Willapa Bay, other scientists found evidence of marshes buried by sudden subsidence accompanying earthquakes at South Slough near Coos Bay in southern Oregon, at Salmon River near Lincoln City, Oregon, at Nehalem Bay and Netarts Bay in northern Oregon, at the mouth of the Copalis River in Washington, and at Port Alberni and Ucluelet on the Pacific coast of Vancouver Island (Figure 4-12). Carbon from buried soils and from drowned tree trunks was sent to radiocarbon labs for dating. The result: the youngest marsh burial occurred about three hundred years ago at nearly all sites along the Cascadia Subduction Zone from British Columbia to southern Oregon. If this was caused by a single earthquake, as the similarity in radiocarbon ages would suggest, that earthquake would have a moment magnitude (Mw) of 9, close to the size of the great Alaskan earthquake of 1964. It would rank among the largest ever recorded.
A common saying among geologists is that what has happened, can happen. If the earthquake three hundred years ago was a magnitude 9, the next subduction-zone earthquake could also be a 9. If this were to happen, what would be the impact on our society?
All of western Washington and Oregon, southwesternmost British Columbia, and Del Norte and Humboldt counties in north-coastal, California would be devastated by a magnitude 9 earthquake, so that emergency response teams would have to come from inland cities or from central and southern California. Intense shaking from a magnitude 9 event would last two to three minutes or longer; a magnitude 8 event would have strong shaking for about half that time. A building might survive strong shaking lasting a minute, but not two or three times as long. For comparison, the strong shaking for the Kobe and Northridge earthquakes each lasted less than thirty seconds. Some of the shaking during these smaller earthquakes was as strong as that expected for a great subduction-zone earthquake; it just didn’t last as long.
This shaking would trigger landslides throughout the Coast Range, Olympic Mountains, and Vancouver Island, in Puget Sound and the Willamette Valley, and even on the continental slope, where landslides could trigger tsunamis. For even a magnitude 8 event, large sand bars like those at Long Beach, Washington, or at the mouth of Siletz Bay, Oregon, could become unstable, as would low-lying islands in the tidal reaches of the lower Columbia River. The Pacific coastline would drop permanently, as shown in Figures 4-10 and 4-11, as much as two to four feet, inundating low-lying areas such as Coos Bay, Yaquina Bay, Siletz Bay, Tillamook Bay, Cannon Beach, Seaside, and Astoria, Oregon, and Long Beach and Grays Harbor in Washington.
Seismic sea waves, or tsunamis, could be as high as thirty to forty feet with a magnitude 9 earthquake, but less than half that with an 8. Fifteen to thirty minutes after the mainshock had died away, the first of several tsunami waves would strike. In some cases, the water would first rush out to sea, exposing sea floor never before seen as dry land, but a short time later, a wall of water would rush inland, sweeping the sand from barrier bars inland, overwhelming beach houses and bayfront boutiques and restaurants as far as several blocks away from the sea. These destructive waves would be repeated several times.
The mainshock would be followed by aftershocks, some with magnitudes greater than 7, large earthquakes in their own right. These aftershocks would continue at a diminishing rate for many years. For a magnitude 8 earthquake, aftershocks would affect a limited part of the Pacific Northwest perhaps two to three hundred miles long, but for a magnitude 9 event, the entire Northwest from Vancouver Island to northern California would be shaken.
Because a magnitude 9 earthquake would devastate such a large area, it would have catastrophic effects on the economy of the Northwest, the ability of government to serve the people, and the ability of insurance companies to pay their claims. The economic effects of a magnitude 8 event would be great, but not as cataclysmic as those of a magnitude 9 because a much smaller area would be affected. If a magnitude 8 earthquake originated west of the mouth of the Columbia River, it would severely damage the Portland metropolitan area, but would have lesser effects on the cities of Puget Sound or the southern Willamette Valley. Emergency response teams from those areas could come to the aid of Portland and adjacent communities in Oregon and Washington. There would be less damage, fewer insurance claims, less destructive effects on the overall economy of the United States and Canada than from a magnitude 9 earthquake. I return to the effects on society in a later chapter.
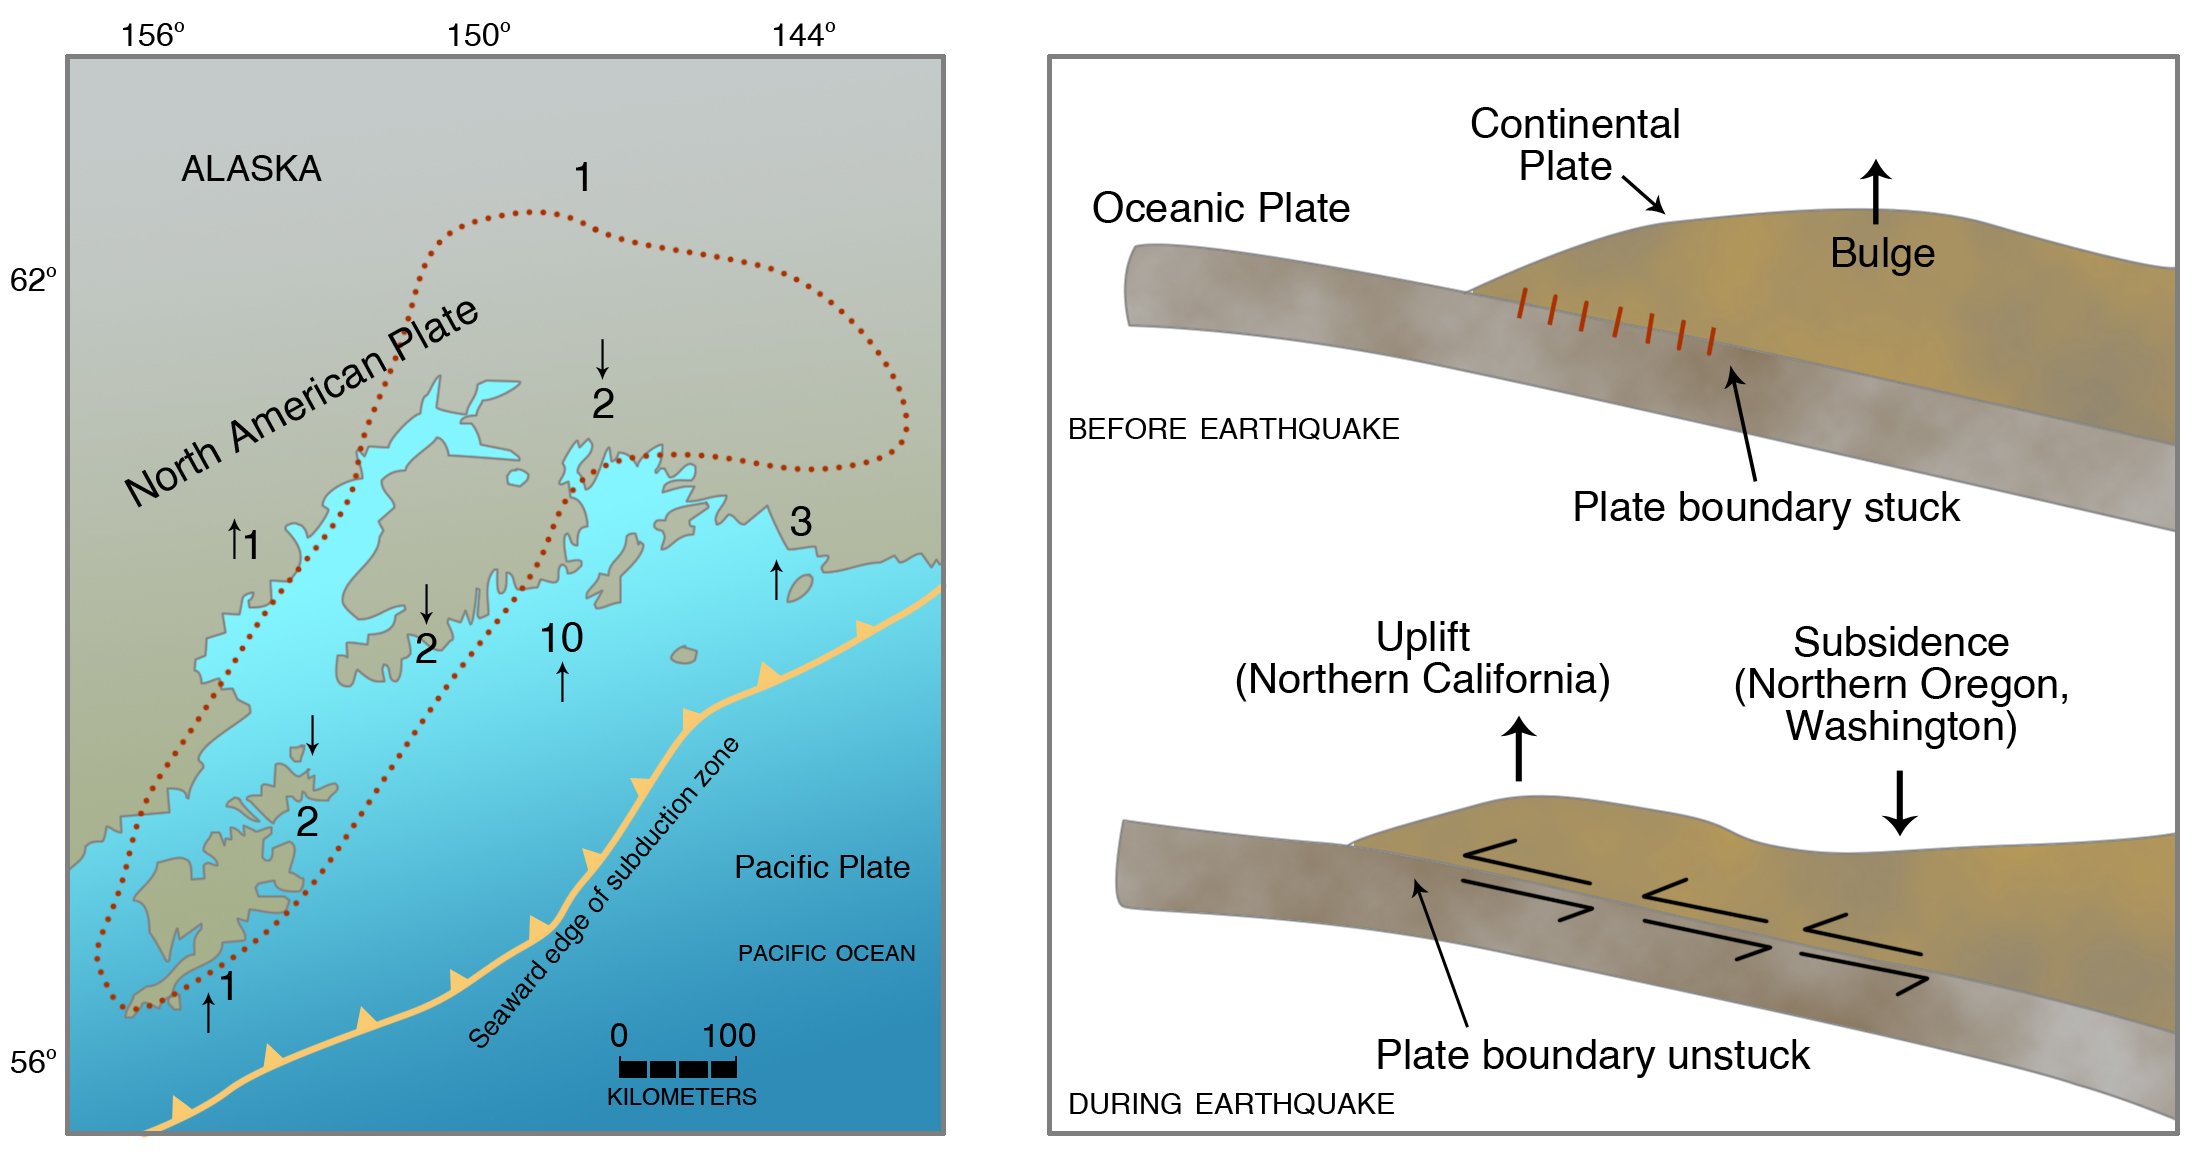
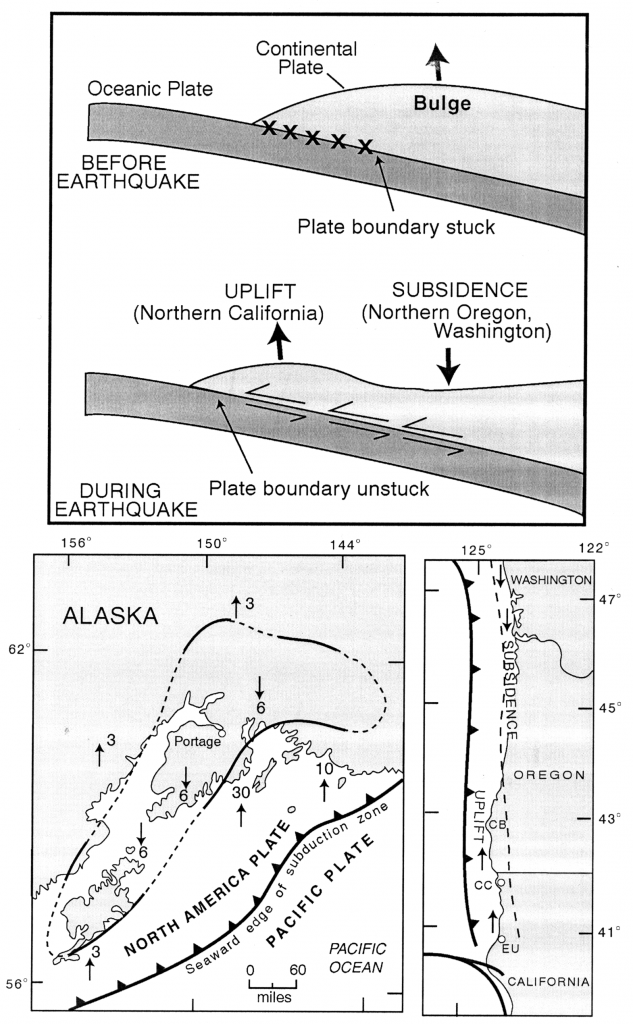
A diagram illustrating the buildup and release of strain in the next great Cascadia earthquake is shown as Figure 4-14.
A video element has been excluded from this version of the text. You can watch it online here: http://pb.libretexts.org/earry/?p=226
How do we learn whether the last earthquake was a magnitude 8 or a 9? Radiocarbon dates can provide accuracy to within a few decades, which is not proof that all the marshes and estuaries were buried at the same time from Vancouver Island to southern Oregon. In southwest Japan, the Nankai Subduction Zone broke in two magnitude 8 earthquakes, one in 1944, while Japan was in the throes of World War II, and one in 1946, when the country was trying to rebuild after the end of the war. If these earthquakes had not been recorded historically, radiocarbon dating could not have provided evidence that these were two separate earthquakes; the numbers could just as likely have documented one great earthquake rather than the two that actually occurred. Gary Carver of Humboldt State University points out the dilemma: one gigantic earthquake (“instant of catastrophe”) versus a series of smaller ones (“decade of terror”) about three hundred years ago.
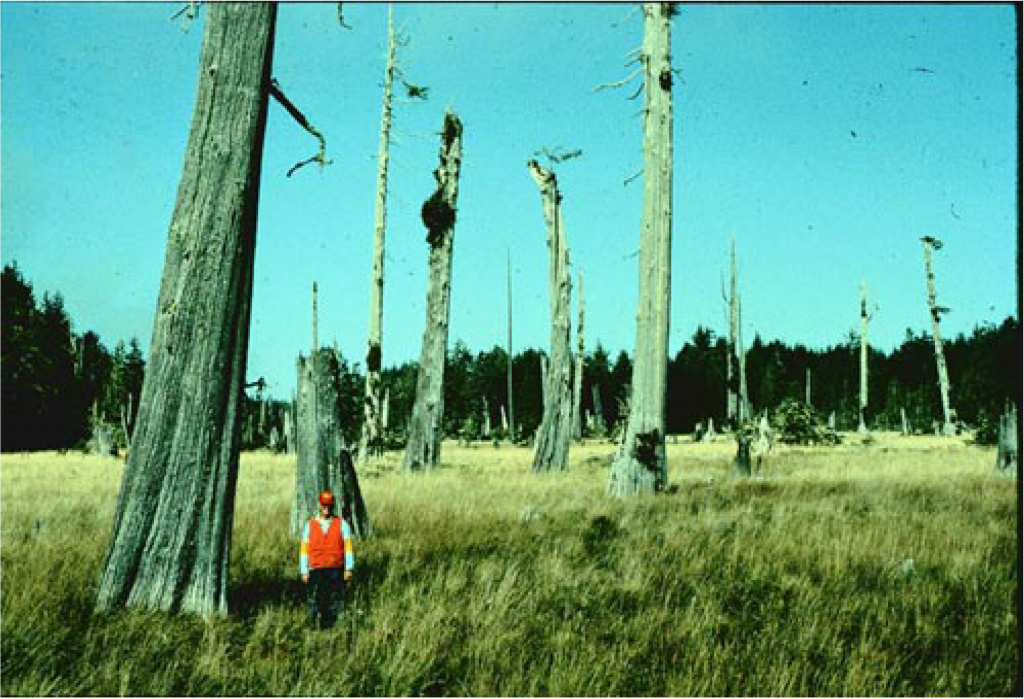
Tree-ring dating can get closer to a true date than radiocarbon dating can (Figure 4-15. Gordon Jacoby of Columbia University and Dave Yamaguchi of the University of Washington compared the pattern of growth rings of trees killed in several estuaries in southwest Washington. Variations in the growth patterns of trees from year to year, related to unusual wet seasons or drought years, allowed these scientists to use radiocarbon dating to conclude that trees in four of these estuaries were inundated some time between August 1699 and May 1700, strong evidence that the estuaries were downdropped at the same time by an earthquake of magnitude greater than 8. However, at that time, these correlations had not been extended north to Vancouver Island or south to California, which would strengthen the case for a single magnitude 9 earthquake.
Clifton Mitchell and Ray Weldon of the University of Oregon studied re-levelings of U. S. Highway 101 along the coast from Crescent City, California, to Neah Bay, Washington, taking advantage of a more accurate leveling survey carried out after John Adams had published his results. They found that over the past fifty years, southern Oregon, the mouth of the Columbia River, and northwest Washington have been rising at about an inch or more every ten years (Figure 4-16, map on left side). But the central Oregon coast around Newport and the area around Grays Harbor, Washington, are hardly uplifting at all. This suggested to them that only some parts of the Cascadia Subduction Zone are building up elastic strain. Imagine irregular hang-ups or strong points (called asperities) along the subduction zone that concentrate all the strain and localize the uplift, separated by other regions where strain is not accumulating. The zones of little or no strain around Newport and Grays Harbor could have terminated the rupture, preventing it from shearing off the next asperity to the north or south. This line of reasoning supported the “decade of terror” hypothesis of several smaller earthquakes rather than one humongous one.
But Roy Hyndman and Kelin Wang of the Pacific Geoscience Centre at Sidney, B. C., argued that the earthquake is more likely to be a 9 rather than an 8. Using temperature estimates in the crust on Vancouver Island and offshore, they calculated which parts of the subduction zone would be stuck and which parts would slide freely due to higher temperature at greater depth. They also measured the changes in leveling lines across Vancouver Island and the Georgia Strait. They compared their leveling data with uplift of the land with respect to sea level, taking advantage of the fact that they could use three coastlines: both sides of Vancouver Island and the mainland coast northwest of Vancouver. Hyndman and Wang calculated where the brittle-ductile transition would be, together with a deeper transition zone that would be brittle under rapid strain and ductile under slow strain (like Silly Putty). This can be seen in Figure 2-1, except that the brittle-ductile transition would be along the subduction-zone fault itself. Their model predicted that the next great earthquake would rupture the entire subduction zone from Canada to California, a magnitude 9 rather than an 8 (Figure 4-16, right-hand map).
Chris Goldfinger had long been an advocate of the smaller-earthquake hypothesis. However, his study of the Holocene turbidites convinced him otherwise. There are the same number of turbidites in Rogue River submarine canyon off southern Oregon as there are in the submarine canyons off the coast of Washington, which provided support for an earthquake of magnitude 9. However, further dating of turbidites showed that some turbidites were limited to the southern part of the subduction zone, evidence that some of the subduction-zone earthquakes were limited to the southern part of the subduction zone. This means that the recurrence interval estimated for subduction-zone earthquakes in southern Oregon and northern California would be shorter than for magnitude 9 earthquakes rupturing the entire subduction zone. Goldfinger suggests that the average recurrence interval for smaller southern Cascadia earthquakes has already exceeded the historical record.
Additional evidence for the most recent earthquake came from Japan.
5. A Japanese Tsunami from Cascadia: A Detective Story
The difficulty in figuring out the maximum size of a Cascadia earthquake, of course, is the lack of local historical records at the time the last great subduction-zone earthquake struck the Pacific Northwest. But there is one last chance. Suppose the earthquake generated a tsunami that was recorded somewhere else around the Pacific Rim where people were keeping records. This leads us to Japan, the first country on the Pacific Ring of Fire to develop a civilization that kept written records.
A video element has been excluded from this version of the text. You can watch it online here: http://pb.libretexts.org/earry/?p=226 |
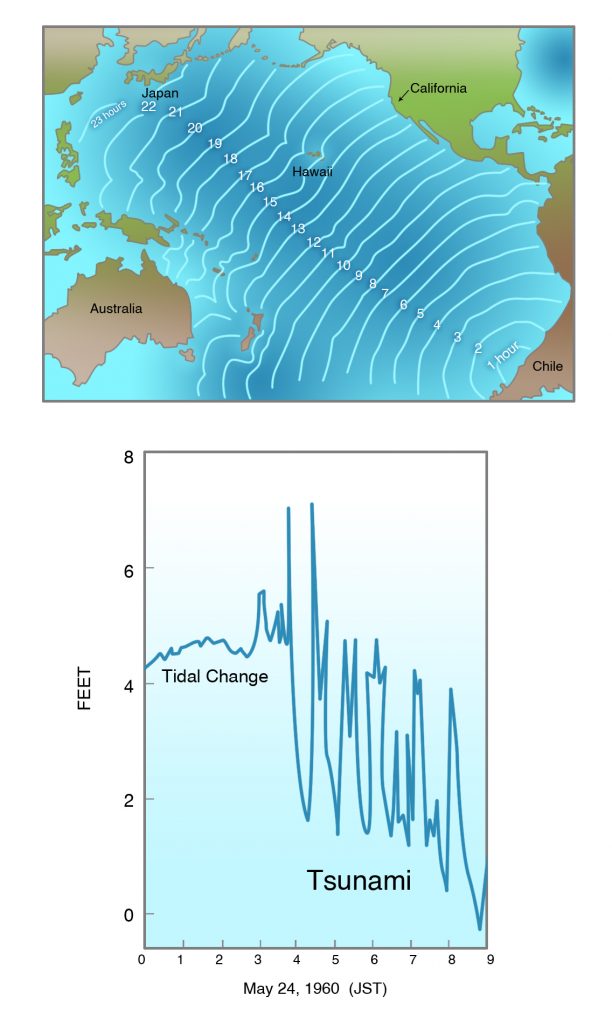 Figure 4-17. (Top) Wave fronts of tsunami accompanying the 1960 Chilean Earthquake (Mw 9.5) in hours, as tsunami crossed Pacific. (Bottom) Tide gauge record of 1960 tsunami recorded at Miyako, Japan, in hours. From K. Satake, University of Tokyo. |
In May 1960, an earthquake of moment magnitude 9.5, the greatest earthquake of the twentieth century, struck the coast of southern Chile. This earthquake generated a large tsunami that traveled northwestward across the Pacific Ocean and struck Japan twenty-two hours later, causing one hundred forty deaths and great amounts of damage (Figure 4-17). Cascadia is closer to Japan than Chile, and if a magnitude 9 earthquake ruptured the Cascadia Subduction Zone, a resulting tsunami might have been recorded in Japan. The height of the tsunami wave might give evidence about whether the magnitude was 9 or only 8.
The southwestern part of Japan, closer to the ancient civilization of China, developed first, and its first local subduction-zone earthquake was recorded in A.D. 684. Records of earthquakes, tsunamis (tsunami is derived from the Japanese characters for “harbor wave”), and volcanic eruptions were kept at temples and villages, principally in southwest Japan until A.D. 1192, when the government was moved to the fishing village of Kamakura on Tokyo Bay, leaving the emperor in isolated splendor far to the west, in Kyoto. In A.D. 1603, the Tokugawa rulers moved the administrative capital farther north to Edo, another small outpost which would become the modern capital of Tokyo. By this time, the entire Pacific coast of Honshu, which faces Cascadia, had been settled, and written records were being kept throughout Japan.
At the time, the Japanese did not necessarily make a connection between earthquakes and tsunamis, but compilation of these ancient records by Japanese scientists and historians in recent years shows that most of the tsunamis recorded from the earliest times were related to the great subduction-zone earthquakes that frequently struck the Japanese Home Islands. But a few tsunamis did not accompany a local earthquake. Japanese investigators were able to correlate most of these mysterious “orphan” tsunamis to subduction-zone earthquakes in South America, where local records were kept. Earthquakes in Peru in A.D. 1586 and 1687, before the Cascadia earthquake, and in Chile in A.D. 1730 and 1751, after the event, produced tsunamis that were recorded in Japan.
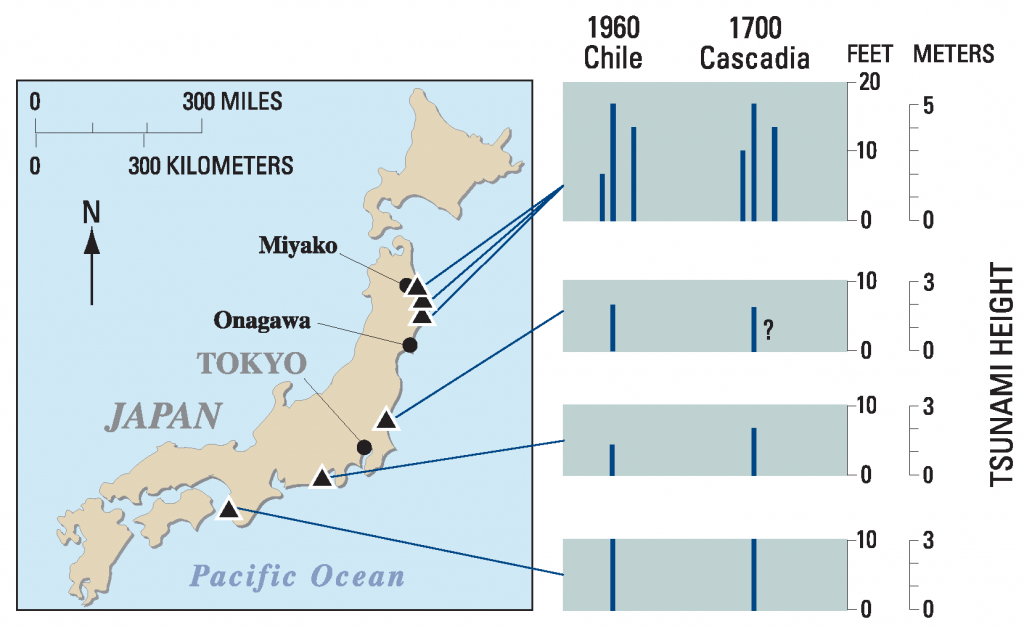
But Kenji Satake, then at the University of Michigan and now at the University of Tokyo, found records written in classical Japanese for one tsunami that could not be correlated to a local Japanese earthquake and had no apparent source in other subduction zones around the Pacific where records were kept, including South and Central America and the Kamchatka Peninsula north of Japan. On January 27 and 28, A.D. 1700, this tsunami produced waves as high as nine feet that were recorded at six different coastal sites on the main island of Honshu (Fig. 4-19) from the far north, near Hokkaido, to the Kii Peninsula south of Kyoto, still the imperial capital of Japan. Houses were damaged, and rice paddies and storehouses were flooded. The distribution of recording sites along most of the Pacific coast of Honshu ruled out a local source of the tsunami, such as a submarine landslide or volcanic eruption. This became known as the “orphan” tsunami, a tsunami without an earthquake source.
At an earthquake conference at Marshall, California, in September 1994, Satake was having lunch with Alan Nelson of the USGS. Nelson had been worrying about whether buried marshes at Coos Bay, Oregon, had been downdropped by earthquakes or by some other means. He explained to Satake that subsided marshes along the Northwest coast from Vancouver Island to southern Oregon had all been radiocarbon dated as about three hundred years old. These dates could not be pinned down closer than a few decades around A.D. 1700 because of limitations in the radiocarbon and tree-ring dating methods (Fig. 4-15). Could the Japanese tsunami of that year have been the result of a great Cascadia earthquake?
First, Satake and his Japanese coworkers had to exclude all other subduction zones around the Pacific Rim that, like Cascadia, were not settled by people keeping records in A.D. 1700, for example, Alaska and the Aleutian Islands. But the great 1964 Alaska Earthquake of M 9.2, the second largest earthquake of the twentieth century, had generated only a very small tsunami in Japan, although, as will be seen in Chapter 9, it produced a destructive tsunami in the Pacific Northwest. This was due to the orientation of the Aleutian Subduction Zone, which is parallel to Japan rather than perpendicular to it, so that the largest tsunamis were propelled to the south and southeast, away from Japan. The Kamchatka-Kurile Islands Subduction Zone was another possibility, but explorers and traders were there as early as the 1680s, and again, the orientation of the subduction zone was parallel to Japan. By process of elimination, this left Cascadia.
Could the tsunami have been caused by a local typhoon? The records for the day of the tsunami show that central Japan had sunny or cloudy weather and was not visited by a storm. In addition, even a gigantic “storm of the century” should have produced a more localized distribution of tsunamis than was observed. A monster typhoon could have struck all the recording sites, but not all at the same time. It would have swept along the coast from south to north, or from north to south. In addition, most typhoons in Japan strike during the summer months, and would be most unusual in January.
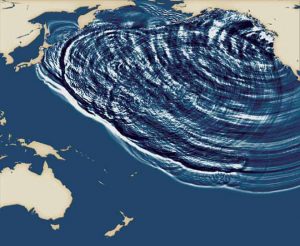
Satake knew how fast tsunamis travel in the open ocean, about the speed of a commercial jetliner. By backtracking the tsunami across the Pacific to the Cascadia coastline, he calculated that if the earthquake generating the tsunami had come from Cascadia, it would have struck about 9 p.m. on January 26, 1700. Satake’s computer model of a Cascadia tsunami on its way to Japan is shown in Figure 4-18. In addition, his computer model showed that the tsunami wave heights recorded in Japan had to have come from an earthquake of magnitude 9. In addition, there was only one set of tsunami waves (instant of catastrophe), not several, as there would have been if the Cascadia Subduction Zone had been ruptured by a series of smaller earthquakes over several years (decade of terror).
6. Native Americans Were Making Observations, After All
Could there be confirmation in the oral traditions of Native Americans living along the coast at that time? Garry Rogers of the Pacific Geoscience Centre in Sidney, B.C., found in the provincial archives at Victoria a tradition that an earthquake had struck Pachena Bay on the west side of Vancouver Island during a winter night. It was discovered the following morning that the village at the head of the bay had disappeared. This is consistent with Satake’s calculated time of the earthquake based on the Japanese tsunami. Traditions of the Chinook included references to ground shaking. The Makah, Tillamook, and Coos tribes have stories of the inundation of coastal settlements by “tidal waves” or tsunamis.
Gary Carver’s wife, Deborah Carver, has collected stories recorded in the early part of the twentieth century from Wiyot, Yurok, Tolowa, and Chetco bands living on the coast of northern California and southern Oregon (see Yurok oral history at the beginning of this chapter). Many of these stories tell of strong shaking from a great earthquake along at least two hundred miles of coastline, followed by many aftershocks, liquefaction of sediments, subsidence of coastal regions, and tsunamis that lasted for several hours. Six of these stories indicated that the earthquake struck at night. The earthquake and tsunami destroyed many villages and drowned many people living there. Carver reported that one purpose of the Yurok “Jumping Dance” was to repair or re-level the Earth after an earthquake.
The story that follows is from an interview recorded by A. L. Kroeber in his book Yurok Myths:
And from there [Earthquake and Thunder] went south—They went south first and sank the ground—Every little while there would be an earthquake, then another earthquake, and another earthquake—And then the water would fill those [depressed] places—”That is what human beings will thrive on,” said Earthquake. “For they would have no subsistence if there were nothing for the creatures [of the sea] to live in. For that is where they will obtain what they will subsist on, when this prairie has become water, this stretch that was prairie: there will be ocean there.”—”Yes, that is true. That is true. That is how they will subsist,” said Thunder. “Now go north.” Then they went north together and did the same: they kept sinking the ground. The earth would quake and quake and quake again. And the water was flowing all over.
This story spoke of land that sank into the ocean during an earthquake—exactly what Brian Atwater, Alan Nelson, and Deborah’s husband, Gary, had concluded from their study of marsh deposits on the Pacific coast. In addition, Gary Carver studied a subsidence site in northern California and concluded that the subsidence occurred after the leaves had fallen and before new growth appeared on the trees; that is, probably during the winter.
A video element has been excluded from this version of the text. You can watch it online here: http://pb.libretexts.org/earry/?p=226
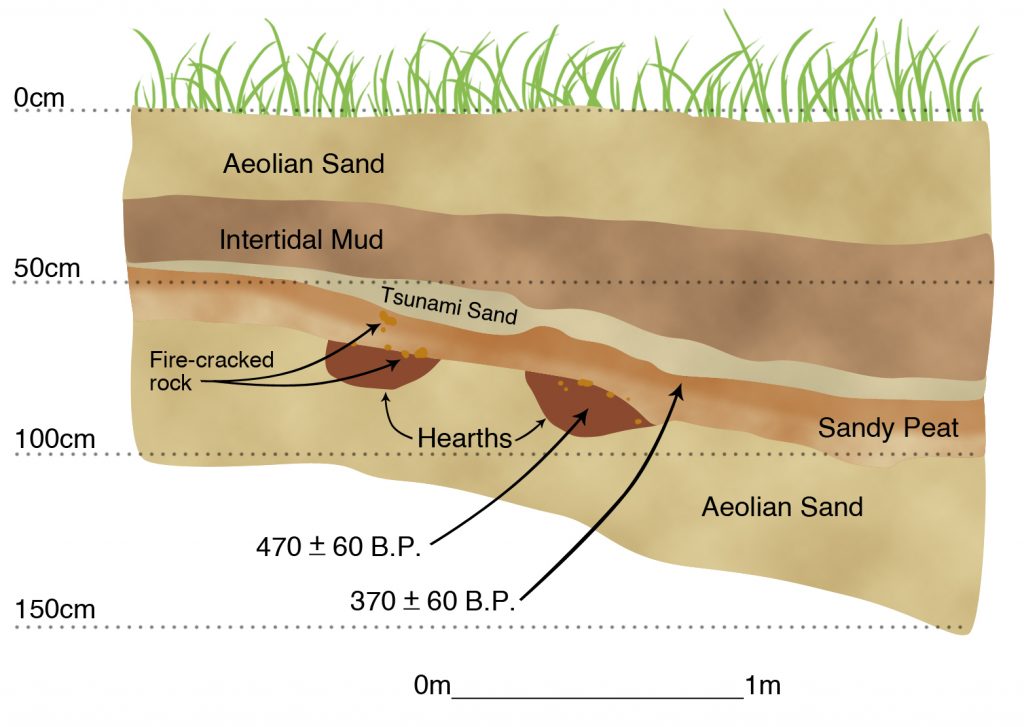
Rick Minor suggested that Cascadia Subduction Zone earthquakes might explain an oddity of Native American archaeology along the coast. Sea level rose rapidly from twelve thousand to five thousand years ago, as glacial ice sheets melted, and then stabilized close to the present level four to five thousand years ago. But there is very little archaeological evidence for Native American settlement along the coast prior to about two thousand years ago. Could the lag in settlement be a result of abrupt coastal subsidence and great tsunamis accompanying past subduction-zone earthquakes? Were Native Americans more concerned about earthquake and tsunami hazards than we are today? Minor described one Native American site that is overlain by sand deposited by a tsunami (Figure 4-20).
7. M 8 or M 9? Where Do We Stand?
Participants in a scientific conference held at Seaside, Oregon, in June 2000 were asked their opinions on M 9 vs. M 8 for the 1700 earthquake. The vote was overwhelming for an earthquake of M 9, indicating that another paradigm change had taken place. The evidence from the Japanese tsunami of A.D. 1700 and the constant number of post-Mazama turbidites from submarine channels from southern Oregon to Washington confirmed the tectonic model of Hyndman and Wang and carried the day.
However, this does not mean that all the earlier earthquakes recorded in the estuaries were M 9 as well. Atwater and his colleague, Eileen Hemphill-Haley, found that some of the paleoseismic sites at Willapa Bay recorded drowning of a coastal forest, whereas others recorded drowning of marsh grasses, evidence of less subsidence (Figure 4-21). If marsh grasses rather than forests were drowned, would this indicate a smaller earthquake, closer to M 8? So, even though scientists agree that the 1700 earthquake was M 9, earlier ones, and by inference, the next one, which is the main reason we are concerned about this, could be smaller. This is particularly true for that part of the subduction zone off the coast of northern California.
8. Northern California:
It’s Not the Same South of the Border
The subduction zone in northern California is different from the rest of Cascadia. Off Oregon and Washington, it lies at the base of the continental slope, but in northern California it turns toward the southeast and angles up the continental slope, headed for the Triple Junction of the North American, Pacific, and Gorda plates beneath the village of Petrolia (Figures 2-4, 4-22).
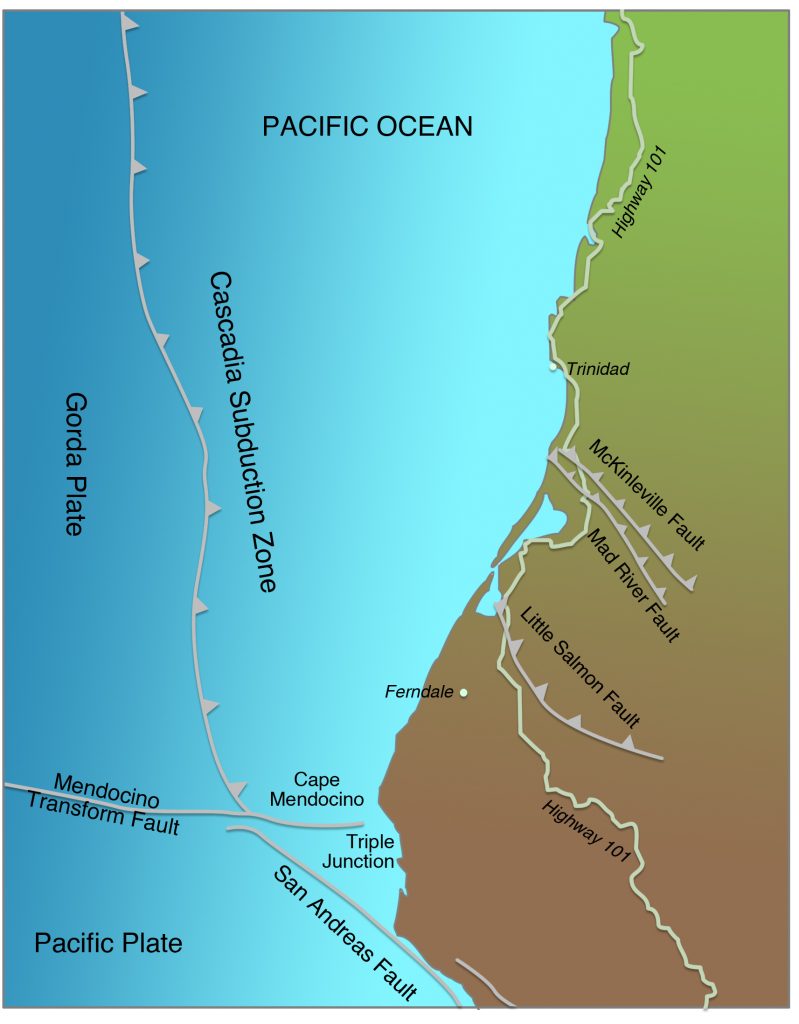
The southern end of the subduction zone apparently ruptured during the April 25, 1992, Cape Mendocino Earthquake of M 7.1, the only part of the subduction zone to have broken in an earthquake during the seismograph era. This earthquake caused $64 million in damage; 202 buildings were destroyed, and 356 people were injured, although nobody was killed. Damage was limited because the high-intensity zones of VII-IX were around small villages east of Cape Mendocino. The larger cities of Eureka and Arcata were farther away, and intensity was lower there.
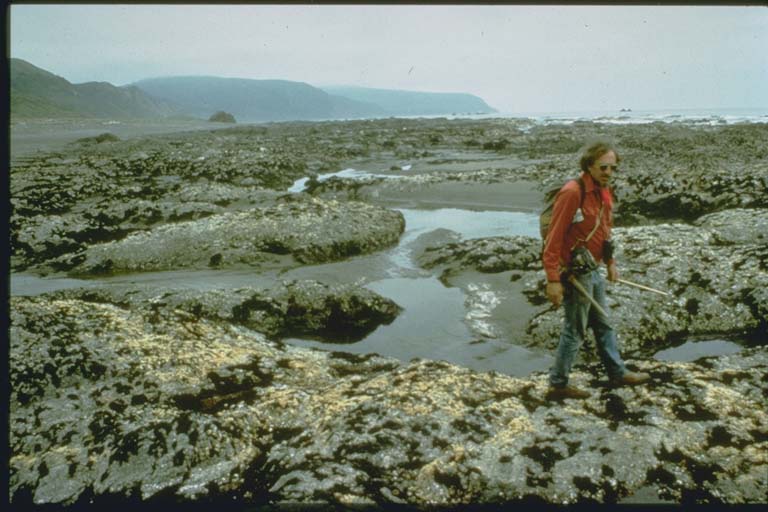
The mainshock, a zone of shallow aftershocks, and GPS observations before and after the earthquake suggest that the earthquake produced ten to sixteen feet of slip on an east-dipping fault plane with the mainshock at about six miles depth. There was no surface rupture onshore, although a fifteen-mile section of coastline was uplifted one to five feet, killing off a tide-pool community of barnacles, mussels, sea urchins, and coralline algae (Figure 4-23). Several kinds of evidence, including older marine terraces uplifted by prehistoric earthquakes and a comparison of slip in 1992 with the long-term convergence rate between the Gorda and North American Plates, give a recurrence interval for 1992-type earthquakes of a few hundred years, perhaps as low as one hundred and fifty to two hundred years. However, the prehistoric Holocene terraces were uplifted in a longer section of beach than the 1992 uplift, suggesting that the older earthquakes were larger.
This recurrence interval is about half as long as the recurrence interval of Cascadia earthquakes in Oregon and Washington based on buried marshes, and the M 7.1 earthquake is small compared to the M 8 or M 9 earthquake that is awaited by the rest of Cascadia. Should this part of the subduction zone expect earthquakes in the M 7.0 to 7.5 range rather than the monster event Satake envisioned in A.D 1700? For insight, we return to southwest Japan, where part of the Nankai Subduction Zone comes ashore at the Izu Peninsula, just as the Cascadia Subduction Zone heads for the coast at Cape Mendocino. A long historical record in Japan shows that large earthquakes occur on the land part of the Nankai Subduction Zone at Izu Peninsula at intervals of seventy to eighty years, whereas the more typical part of the subduction zone is struck by earthquakes of M 8 or larger every one hundred to one hundred and fifty years. Some of the Izu earthquakes are M 6.5 to M 7.1, and in addition, some of the large M 8 events rupture across the peninsula as well as along the subduction zone at the base of the continental slope. This could explain the short recurrence interval near Cape Mendocino as well as the absence of the three-hundred-year buried marsh at some sites in Humboldt Bay. Some of the Mendocino earthquakes would be local, like the 1992 event, and some would rupture the entire subduction zone, like the 1700 event. However, at the moment, this is just a guess.
The shorter recurrence interval for earthquakes uplifting the marine terraces near Cape Mendocino is confirmed by the recurrence interval based on turbidites in the Trinidad, Eel, and Mendocino submarine channels, which is 133, 75, and 34 years, respectively. Earthquakes strike there more frequently, and they are more variable in their return times. This may be due to earthquakes on the San Andreas Fault south of Cape Mendocino or to crustal earthquakes on active faults near the coast (Figure 4-22). Crustal faults are discussed further in Chapter 6.
The 1992 earthquake differed from the expected behavior of a subduction-zone earthquake farther north in another way: the shoreline was uplifted rather than downdropped. The explanation for this is seen in Figure 4-15. The subduction zone is much closer to the coastline in northern California than it is farther north, and thus it is in the area where uplift would be predicted, not subsidence. But what about the subsided marshes at Humboldt Bay (Figure 4-13)? These marsh burials are related to local crustal faults, not the subduction zone (discussed further in Chapter 6).
9. Recurrence Intervals and the Next Subduction Zone Earthquake
Atwater and Hemphill-Haley analyzed an earthquake record spanning 3,500 years at Willapa Bay in southwestern Washington, identifying seven earthquakes, including the A.D. 1700 event. As shown in Figures 4-9 and 4-21, these earthquakes struck at irregular intervals. At the Redtail site, events S, U, and W struck within a five-hundred-year interval, whereas about nine hundred years elapsed between Event S and the previous Event N. In the Sixes River estuary in southern Oregon, just north of Cape Blanco (located on Figure 4-12), Harvey Kelsey, Eileen Hemphill-Haley, and their colleagues found evidence for eleven earthquakes in the past 5,500 years, with variation in time between events from seventy years to as much as nine hundred years. Goldfinger found turbidites triggered by thirteen earthquakes since the eruption of the Mazama Ash 7,700 years ago and eighteen earthquakes since the beginning of the Holocene about ten thousand years ago. The shortest time between post-Mazama turbidites is 215 years and the longest time nearly fifteen hundred years.
The average recurrence interval at Willapa Bay and Sixes River is 500-540 years, but it is not clear that there is a one-to-one correlation between earthquakes at the two sites. Kelsey and his colleagues suggested that an earthquake two thousand years ago at Sixes River lacks a counterpart at Willapa Bay. The average recurrence interval based on post-Mazama turbidites is six hundred years, and for the entire Holocene it is 550-560 years. At Bradley Lake, north of Sixes River, the recurrence interval is about 440 years. But Alan Nelson of the USGS and his colleagues found that two earthquake-related deposits at Bradley Lake were separated by only forty years, suggesting that Bradley Lake was affected by smaller earthquakes to the north and south.
These studies reveal a paleoseismic record that is unparalleled anywhere else in the world. But until individual earthquakes are more closely dated by radiocarbon, about all that can be said at the present time is that north of California, the number of earthquakes is about the same for all earthquake sequences studied, and that repeat times for individual earthquakes are highly variable. As yet, we are far from being able to predict how long it will be until the next earthquake. One idea is that the longer the time since the last earthquake, the larger the next one is likely to be. If the next Big One happened tomorrow, a little more than halfway through the average recurrence interval, the earthquake would be smaller than the 1700 event because less strain would have accumulated. A suggestion that this might be the case can be inferred from the Willapa Bay record at the Redtail site (Figure 4-21). Events N and W were followed by long periods with no earthquakes, and the earthquakes that followed (Events S and Y, respectively) recorded maximum subsidence, a forest burial rather than a marsh burial. This seems like a great idea except that the 1960 Chilean earthquake, the largest of the twentieth century, was preceded by great earthquakes in 1835 and 1837, less than one hundred and thirty years earlier. Also, it is not clear that less vertical subsidence means a smaller earthquake. The presence of the same number of turbidites in channels below submarine canyons from Washington to southern Oregon suggests that all these events are very large, close to magnitude 9.
10. Subduction-Zone Earthquakes That Don’t Quake
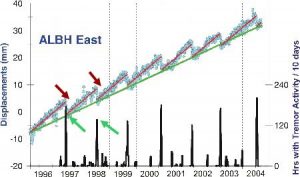
Herb Dragert of the Pacific Geoscience Centre in Sidney, B.C., was checking the GPS records of tectonic strain accumulation in southern Vancouver Island when he caught what appeared to be an error in one of the measurements. Since 1992, the Pacific Geoscience Centre and the Pacific Northwest Geodetic Array (PANGA) GPS networks had been recording the slow accumulation of elastic strain in the North America Plate as the oceanic Juan de Fuca Plate drives northeastward beneath it. GPS stations in southern Vancouver Island and northwestern Washington had been showing a northeast-directed shortening of the geodetic base lines between them and a station at Penticton, B.C., in stable North America to the east. In his previous checks, the stations were doing just that, but this time, the base line was going in the opposite direction, southwest rather than northeast, extending rather than contracting. Dragert determined that all the stations in southern Vancouver Island and northwest Washington were doing the same thing, lengthening their base lines. After he recognized that he was witnessing something real, the extension stopped, and the base line to Penticton began contracting again. Dragert had observed a slow earthquake in early 1997, defined as an earthquake that doesn’t quake, in this case, a movement on the subduction zone not accompanied by strong shaking (Figure 4-24).
Meghan Miller, Tim Melbourne, and their colleagues at Central Washington University at Ellensburg began looking at the entire data set starting when the PANGA network first became operational in 1992. The network recorded a slow earthquake in mid-1992 and has been recording them ever since at intervals of about fourteen and a half months. If the strain had been released suddenly in an ordinary earthquake, it would have had a moment magnitude of 6.7, about the size of the devastating Northridge, California, earthquake of 1994. But because the strain was released slowly over a period of two to four weeks, nobody felt a thing. Michael Brudzinski of Miami University, Ohio, determined that the duration of these non-shaking earthquakes varies from place to place. In western Oregon, the duration is 19 months, and in southernmost Oregon and northern California, it is about ten months. The area with the longest time between tremor events overlies the thick slab of crustal basalt known as Siletzia.
At first, it was thought that the seismograph network didn’t detect anything, either. But Garry Rogers of the Pacific Geoscience Centre, working with Dragert, found that the slow earthquakes are accompanied by a strange seismic signal of lower frequency than ordinary earthquakes (Figure 4-18). These signals resemble volcanic tremor rather than slip on a fault, and Rogers suspects that they are related to fluids moving in the deeper part of the subduction zone. He was able to locate these seismic events on the subduction zone at depths of fifteen to twenty-eight miles. They are found in the same places that the GPS stations recorded the slow earthquakes, although the seismic signal may extend farther northwest into Vancouver Island, beyond the reach of detailed GPS coverage. They are now known as episodic tremor and slip (ETS), and they have been identified in other subduction zones around the world, including southwest Japan and southern Mexico. The comparison of seismic tremor with ordinary earthquakes is like comparing your stomach growling with breaking a stick or setting off a firecracker.
There have been enough of these ETS events to locate their “epicenters” on a map, shown here as Figure 4-25. The western boundary of the ETS events is relatively sharp, and this is now thought to correspond to the eastern boundary of the locked zone, independent of any estimates based on a downward projection of temperature. The eastern boundary of the locked zone is just east of the coastline in Oregon and includes a slightly wider part of the Washington coast.
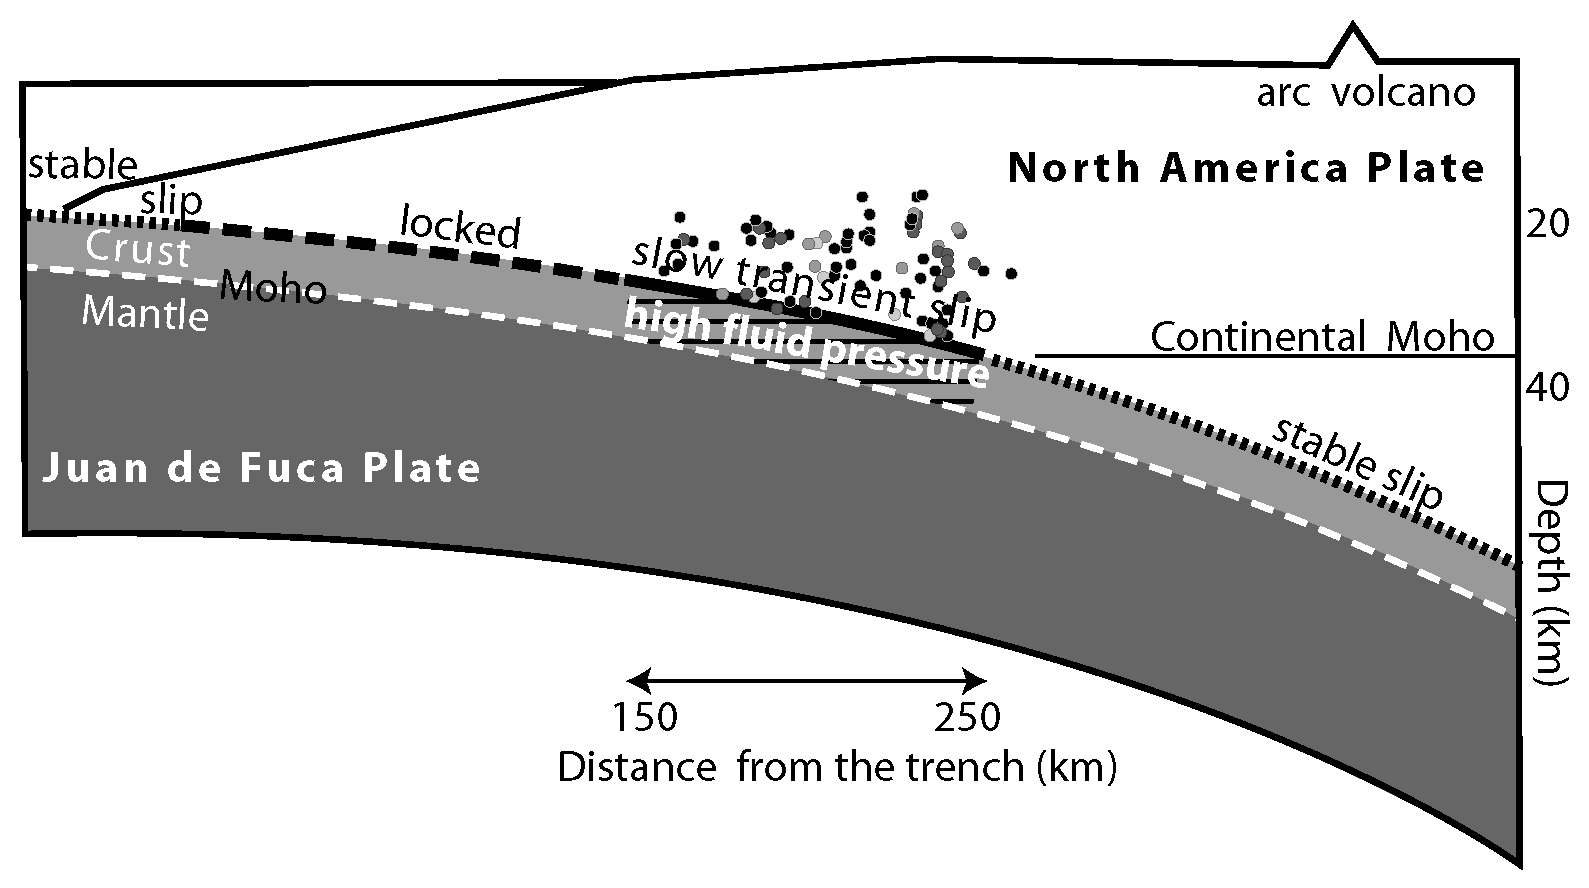
Figure 4-26 is a cross section of the Cascadia subduction zone subdivided according to its expected response to deformation. It is useful to compare this figure with Figure 2-1, showing the increasing strength of rock with increasing depth. The westernmost subdivision is closest to the “trench” and is weak, moving by sliding unaccompanied by earthquakes. The next region has the highest strength. It has no earthquakes on it at all at the present time, and is expected to release its strain in gigantic subduction-zone earthquakes. The next zone to the east is characterized by ETS, with slow earthquakes probably influenced by high fluid pressures. Still farther east is the zone of stable sliding, beneath the brittle-ductile transition, which extends eastward beneath the volcanic arc.
Does this release of strain on the subduction zone reduce the threat of another M 9 subduction-zone earthquake? Dragert thinks that the opposite may be true: the release of strain in the transitional zone between brittle failure and ductile failure may increase the elastic strain on the shallower part of the subduction zone that is completely locked. It is possible that the next major subduction-zone earthquake might be preceded by a slow earthquake, The 1960 Chile earthquake, the greatest of the twentieth century, was preceded by a slow earthquake. For this reason, the time of an ETS event is a time of greater concern that one of these events might trigger the next great subduction-zone earthquake. Everybody gets nervous. At present, it is the only possible “precursor” we have, and it might not be a precursor at all.
11. Summary
Despite its low seismicity, the Cascadia Subduction Zone has been revealed as a major seismic source, capable of an earthquake of magnitude 9. The last earthquake was a 9, based on modeling of a tsunami that struck Japan in January 1700. The Native Americans who were living here in A.D. 1700 reported the earthquake in their oral traditions handed down from generation to generation. Some of the earlier earthquakes may have been smaller since the subsidence accompanying them was less than the subsidence in 1700. However, the consistent number of earthquake-generated turbidites identified in submarine channels on the Juan de Fuca Plate from Washington to southern Oregon argue for a magnitude 9 for most of these earlier events. The theoretical models of Roy Hyndman and Kelin Wang also point to a magnitude 9. Goldfinger has shown that at least two of the earlier earthquakes had magnitudes larger than the 1700 earthquake.
In Del Norte and Humboldt counties in northern California, the situation is different. This region not only has the highest seismicity in the Pacific Northwest, it also has the highest seismicity in California, higher than that along the San Andreas Fault. The Cascadia Subduction Zone in this region was struck by a moderate-size earthquake in 1992 that, because it was closer to the trench, it uplifted the coastline rather than downdropped it as happened farther north. In addition, the earthquakes return more frequently in that area, as documented by uplifted coastal marine platforms and the more-frequent appearance of turbidites in submarine channels.
The paleoseismological record from Cascadia is the most fully documented in the world, yet the record does not allow us to forecast closely the arrival time of the next subduction-zone earthquake, nor does it allow a forecast of whether the next earthquake will be a 9 or larger or smaller. The recognition of episodic tremor and slip demonstrates that the subduction zone is active, but its current activity consists of slow slip events accompanied by earthquake tremor. This allows for the recognition of the landward boundary of that part of the subduction zone, and also suggests that the next great earthquake might be preceded by a slow slip event, or ETS.
However, we still have much to learn.
Suggestions for Further Reading
Atwater, B. F., and E. Hemphill-Haley. 1997. Recurrence intervals for great earthquakes of the past 3500 yr at northeastern Willapa Bay, Washington. USGS Professional Paper 1576, 108 p.
Clague, J. J. 1997. Evidence for large earthquakes at the Cascadia Subduction Zone. Reviews of Geophysics, v. 35, p. 439-60.
Clague, J., B. Atwater, K. Wang, M. Wang, and I. Wong. 2000. Great Cascadia earthquake tricentennial. Proceedings of the Geological Society of America Penrose Conference, printed by the Oregon Department of Geology and Mineral Industries, 131 p.
Clarke, S. H., and G. A. Carver. 1992. Late Holocene tectonics and paleoseismicity, southern Cascadia subduction zone. Science, v. 255, p. 188-92.
Dengler, L., G. Carver, and R. McPherson. 1992. Sources of North Coast seismicity. California Geology, v. 45, p. 40-53.
Dengler, L., and K. Moley. 1999. Living on shaky ground: how to survive earthquakes & tsunamis on the North Coast. Humboldt Earthquake Education Center, Humboldt State University, 3rd edition, 24 p. (A simple guide to protection against earthquakes and tsunamis). Free. Web site: http://sorrel.humboldt.edu/~geodept/.../eqk_info.html
Goldfinger, C., C. H. Nelson, and J. E. Johnson. 2003. Holocene earthquake records from the Cascadia Subduction Zone and northern San Andreas Fault based on precise dating of offshore turbidites. Annual Reviews of Earth and Planetary Sciences, v. 31, p. 555-77.
Goldfinger, C., Nelson, C.H., Johnson, J.E., et al., 2012, Turbidite event history: Methods and implications for Holocene paleoseismology of the Cascadia subduction zone: U.S. Geol. Survey Prof. Paper 1661F, http://pubs.usgs.gov/pp/pp1661f/
Goldfinger, C., Ikeda, Y., and Yeats, R.S., 2013, Superquakes, supercycles, and global earthquake clustering: Earth, v. 58, no. 1, p. 34-43.
Gomberg, J., and the Cascadia 2007 and Beyond Working Group, 2010, Slow-slip phenomena in Cascadia from 2007 and beyond: A review: Geological Society of America Bulletin, v. 122, p. 963-978.
Gore, R., and J. Richardson. 1998. Cascadia: Living on Fire. National Geographic, v. 193, no. 5, p. 6-37
Henderson, B., 2014, The next tsunami: living on a restless coast: OSU Press, Corvallis, 322 p .
Houtman, N., Ashford, S., Mason, B., Barbosa, A., Bethel, J., and Olsen, M., 2013, Terra, Oregon 9.0, available at http://oregonstate.edu/terra/2013/05/oregon-9-0/.
Hyndman, R. D. 1995. Great earthquakes of the Pacific Northwest. Scientific American, v. 273, no. 6, p. 50-57. Written for the lay reader.
Kelsey, H. M., R. C. Witter, and E. Hemphill-Haley. 2002. Plate-boundary earthquakes and tsunamis of the past 5500 yr, Sixes River estuary, southern Oregon. Geological Society of America Bulletin, v. 114, p. 298-314.
Lienau, M., for Global Net Industries. 2003. Cascadia: the Hidden Fire. One hour educational documentary video, www.globalnetproductions.com
McCrory, P. A. 1996. Evaluation of fault hazards, northern coastal California. USGS Open-File Report 96-656, 87 p.
Miller, M. M., T. Melbourne, D. J. Johnson, and W. Q. Sumner. 2002. Periodic slow earthquakes from the Cascadia Subduction Zone. Science, v. 295, p. 2423.
Mitchell, C. E., P. Vincent, R. J. Weldon, and M. A. Richards. 1994. Present-day vertical deformation of the Cascadia margin, Pacific Northwest, United States. Journal of Geophysical Research, v. 99, p. 12, 257-12, 277.
Oppenheimer, D., and others. 1993. The Cape Mendocino, California, earthquakes of April 1992: subduction at the triple junction. Science, v261, p. 433-38.
Rogers, G., and H. Dragert., 2003. Episodic tremor and slip on the Cascadia Subduction Zone: the chatter of silent slip. Science, v. 300, p. 1942-43.
Satake, K., K. Shimazaki, Y. Tsuji, and K. Ueda. 1996. Time and size of a great earthquake in Cascadia inferred from Japanese tsunami records of January, 1700. Nature, v. 379, p. 246-49.
Schulz, K., 2015, The really big one: New Yorker, July 20, 2015, p. 52-59.
Wang, K., R. Wells, S. Mazzotti, R. D. Hyndman., and T. Sagiya. 2003. A revised dislocation model of interseismic deformation of the Cascadia subduction zone. Journal of Geophysical Research v. 261, p. 433-38.