
13.9: Lab Exercise (Part C)
- Page ID
- 5705

\( \newcommand{\vecs}[1]{\overset { \scriptstyle \rightharpoonup} {\mathbf{#1}} } \)
\( \newcommand{\vecd}[1]{\overset{-\!-\!\rightharpoonup}{\vphantom{a}\smash {#1}}} \)
\( \newcommand{\dsum}{\displaystyle\sum\limits} \)
\( \newcommand{\dint}{\displaystyle\int\limits} \)
\( \newcommand{\dlim}{\displaystyle\lim\limits} \)
\( \newcommand{\id}{\mathrm{id}}\) \( \newcommand{\Span}{\mathrm{span}}\)
( \newcommand{\kernel}{\mathrm{null}\,}\) \( \newcommand{\range}{\mathrm{range}\,}\)
\( \newcommand{\RealPart}{\mathrm{Re}}\) \( \newcommand{\ImaginaryPart}{\mathrm{Im}}\)
\( \newcommand{\Argument}{\mathrm{Arg}}\) \( \newcommand{\norm}[1]{\| #1 \|}\)
\( \newcommand{\inner}[2]{\langle #1, #2 \rangle}\)
\( \newcommand{\Span}{\mathrm{span}}\)
\( \newcommand{\id}{\mathrm{id}}\)
\( \newcommand{\Span}{\mathrm{span}}\)
\( \newcommand{\kernel}{\mathrm{null}\,}\)
\( \newcommand{\range}{\mathrm{range}\,}\)
\( \newcommand{\RealPart}{\mathrm{Re}}\)
\( \newcommand{\ImaginaryPart}{\mathrm{Im}}\)
\( \newcommand{\Argument}{\mathrm{Arg}}\)
\( \newcommand{\norm}[1]{\| #1 \|}\)
\( \newcommand{\inner}[2]{\langle #1, #2 \rangle}\)
\( \newcommand{\Span}{\mathrm{span}}\) \( \newcommand{\AA}{\unicode[.8,0]{x212B}}\)
\( \newcommand{\vectorA}[1]{\vec{#1}} % arrow\)
\( \newcommand{\vectorAt}[1]{\vec{\text{#1}}} % arrow\)
\( \newcommand{\vectorB}[1]{\overset { \scriptstyle \rightharpoonup} {\mathbf{#1}} } \)
\( \newcommand{\vectorC}[1]{\textbf{#1}} \)
\( \newcommand{\vectorD}[1]{\overrightarrow{#1}} \)
\( \newcommand{\vectorDt}[1]{\overrightarrow{\text{#1}}} \)
\( \newcommand{\vectE}[1]{\overset{-\!-\!\rightharpoonup}{\vphantom{a}\smash{\mathbf {#1}}}} \)
\( \newcommand{\vecs}[1]{\overset { \scriptstyle \rightharpoonup} {\mathbf{#1}} } \)
\(\newcommand{\longvect}{\overrightarrow}\)
\( \newcommand{\vecd}[1]{\overset{-\!-\!\rightharpoonup}{\vphantom{a}\smash {#1}}} \)
\(\newcommand{\avec}{\mathbf a}\) \(\newcommand{\bvec}{\mathbf b}\) \(\newcommand{\cvec}{\mathbf c}\) \(\newcommand{\dvec}{\mathbf d}\) \(\newcommand{\dtil}{\widetilde{\mathbf d}}\) \(\newcommand{\evec}{\mathbf e}\) \(\newcommand{\fvec}{\mathbf f}\) \(\newcommand{\nvec}{\mathbf n}\) \(\newcommand{\pvec}{\mathbf p}\) \(\newcommand{\qvec}{\mathbf q}\) \(\newcommand{\svec}{\mathbf s}\) \(\newcommand{\tvec}{\mathbf t}\) \(\newcommand{\uvec}{\mathbf u}\) \(\newcommand{\vvec}{\mathbf v}\) \(\newcommand{\wvec}{\mathbf w}\) \(\newcommand{\xvec}{\mathbf x}\) \(\newcommand{\yvec}{\mathbf y}\) \(\newcommand{\zvec}{\mathbf z}\) \(\newcommand{\rvec}{\mathbf r}\) \(\newcommand{\mvec}{\mathbf m}\) \(\newcommand{\zerovec}{\mathbf 0}\) \(\newcommand{\onevec}{\mathbf 1}\) \(\newcommand{\real}{\mathbb R}\) \(\newcommand{\twovec}[2]{\left[\begin{array}{r}#1 \\ #2 \end{array}\right]}\) \(\newcommand{\ctwovec}[2]{\left[\begin{array}{c}#1 \\ #2 \end{array}\right]}\) \(\newcommand{\threevec}[3]{\left[\begin{array}{r}#1 \\ #2 \\ #3 \end{array}\right]}\) \(\newcommand{\cthreevec}[3]{\left[\begin{array}{c}#1 \\ #2 \\ #3 \end{array}\right]}\) \(\newcommand{\fourvec}[4]{\left[\begin{array}{r}#1 \\ #2 \\ #3 \\ #4 \end{array}\right]}\) \(\newcommand{\cfourvec}[4]{\left[\begin{array}{c}#1 \\ #2 \\ #3 \\ #4 \end{array}\right]}\) \(\newcommand{\fivevec}[5]{\left[\begin{array}{r}#1 \\ #2 \\ #3 \\ #4 \\ #5 \\ \end{array}\right]}\) \(\newcommand{\cfivevec}[5]{\left[\begin{array}{c}#1 \\ #2 \\ #3 \\ #4 \\ #5 \\ \end{array}\right]}\) \(\newcommand{\mattwo}[4]{\left[\begin{array}{rr}#1 \amp #2 \\ #3 \amp #4 \\ \end{array}\right]}\) \(\newcommand{\laspan}[1]{\text{Span}\{#1\}}\) \(\newcommand{\bcal}{\cal B}\) \(\newcommand{\ccal}{\cal C}\) \(\newcommand{\scal}{\cal S}\) \(\newcommand{\wcal}{\cal W}\) \(\newcommand{\ecal}{\cal E}\) \(\newcommand{\coords}[2]{\left\{#1\right\}_{#2}}\) \(\newcommand{\gray}[1]{\color{gray}{#1}}\) \(\newcommand{\lgray}[1]{\color{lightgray}{#1}}\) \(\newcommand{\rank}{\operatorname{rank}}\) \(\newcommand{\row}{\text{Row}}\) \(\newcommand{\col}{\text{Col}}\) \(\renewcommand{\row}{\text{Row}}\) \(\newcommand{\nul}{\text{Nul}}\) \(\newcommand{\var}{\text{Var}}\) \(\newcommand{\corr}{\text{corr}}\) \(\newcommand{\len}[1]{\left|#1\right|}\) \(\newcommand{\bbar}{\overline{\bvec}}\) \(\newcommand{\bhat}{\widehat{\bvec}}\) \(\newcommand{\bperp}{\bvec^\perp}\) \(\newcommand{\xhat}{\widehat{\xvec}}\) \(\newcommand{\vhat}{\widehat{\vvec}}\) \(\newcommand{\uhat}{\widehat{\uvec}}\) \(\newcommand{\what}{\widehat{\wvec}}\) \(\newcommand{\Sighat}{\widehat{\Sigma}}\) \(\newcommand{\lt}{<}\) \(\newcommand{\gt}{>}\) \(\newcommand{\amp}{&}\) \(\definecolor{fillinmathshade}{gray}{0.9}\)Part C – Induced Seismicity
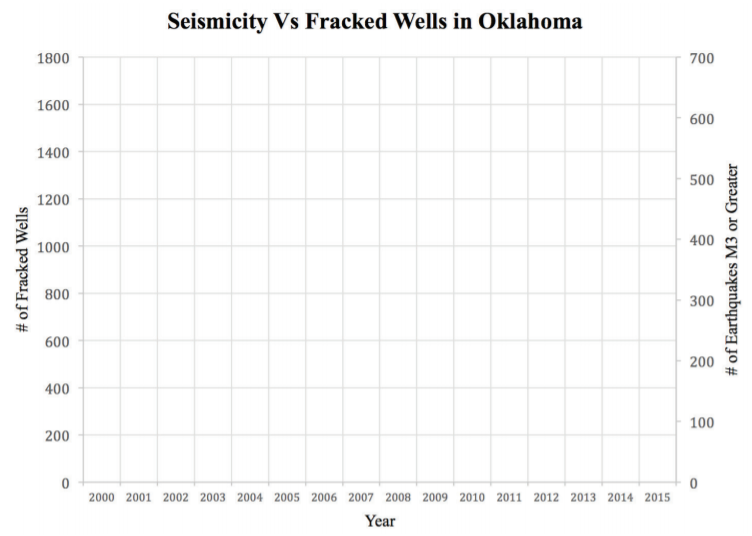
The table below contains data regarding the number of fracking wells within the state of Oklahoma and the number of significant earthquakes (magnitude 3 or greater) that have occurred since 2000. Before answering the questions for this lab exercise, plot the information in the table below on the graph that is provided; note that the graph has two y-axes, one for the number of fracking wells and the other for the number of earthquakes.
| Table 13.2 |
| Year | # of Fracking Wells in Oklahoma | a # of Earthquakes greater than M 3 |
| 2000 | 0 | 0 |
| 2001 | 0 | 0 |
| 2002 | 0 | 3 |
| 2003 | 0 | 0 |
| 2004 | 0 | 2 |
| 2005 | 0 | 1 |
| 2006 | 0 | 2 |
| 2007 | 0 | 1 |
| 2008 | 1 | 2 |
| 2009 | 4 | 20 |
| 2010 | 1 | 43 |
| 2011 | 637 | 63 |
| 2012 | 1,568 | 34 |
| 2013 | 1,939 | 109 |
| 2014 | 3,296 | 585 |
| 2015 | 1,749 | 850 |
(From: http://www.oudaily.com/news/oklahoma...84c8399c1.html)
Note
Information on the number of fracked wells was obtained by SkyTruth through accessing FracFocus. Oklahomans are required to report all fracked wells but the site was only created in 2011, so some wells may have not been retroactively added pre-2011. Seismic data were obtained through the USGS.
12. After what year does the number of magnitude 3 or greater earthquakes begin to rise significantly?
a. 2007
b. 2009
c. 2011
d. 2015
13. After what year does the number of fracking wells begin to rise significantly?
a. 2007
b. 2009
c. 2011
d. 2015
14. Based on the graph that you constructed, do significant earthquakes and the number of fracking wells appears to be related?
a. Yes
b. No
The exercises that follow use Google Earth. Let’s start by examining the 1906 earthquake that hit Northern California. Access the following website: http:// earthquake.usgs.gov/regional/nca/virtualtour/
There are several links of interest here. Spend some time familiarizing yourself with the site. Scroll down to the section entitled “The Northern California Earthquake, April 18, 1906” and open the link. The San Andreas Fault is ~800 miles long, located in California. In 1906, a major earthquake occurred along a portion of the fault. Scroll down and check out the Rupture Length and Slip.
15. How long was the rupture length (the length of the fault that was affected)?
a. 25 miles
b. 74 miles
c. 198 miles
d. 296 miles
e. 408 miles
Horizontal slip, or relative movement along the fault, ranged from 2-32 feet. To envision this, imagine that you are facing an object directly across from you. Suddenly, it moves up to 32 feet to your right! Horizontal slip is shown along the rupture as a histogram. Check out all the measurements along the fault by clicking the Rupture Length and Slip on the Google Earth link.
16. Locate the epicenter of the 1906 quake. Does the amount of horizontal slip decrease faster along the northern end or the southern end of the rupture?
a. northern end of the rupture
b. southern end of the rupture
Go back to the “The Northern California Earthquake, April 18, 1906” page and scroll down to check out the Shaking Intensity. If your map begins to get difficult to read, remember that by clicking on a checked box in the Places folder, you can remove prior data. Use the search box to display the desired location.
17. What was the shaking intensity like in Sacramento?
a. light
b. strong
c. severe
d. violent
e. extreme
18. What was the shaking intensity like in Sebastopol?
a. light
b. strong
c. severe
d. violent
e. extreme
Navigate back to the main page and select “Earthquake Hazards of the Bay Area Today.” Check out the Earthquake Probabilities for the Bay Area.
19. Based on the map, would you be more likely to experience an earthquake of magnitude >6.7 by 2031 if living in the northwest Bay Area or southeast Bay Area?
a. northwest
b. southeast
Go back to the “Earthquake Hazards of the Bay Area Today” page and check out the Liquefaction Susceptibility in San Francisco. Look at the overall trend in the areas affected by liquefaction.
20. Based on the liquefaction map, are areas more dangerous inland or along the coast?
a. inland
b. along the coast