6.6: Seismic Waves
- Page ID
- 12810
\( \newcommand{\vecs}[1]{\overset { \scriptstyle \rightharpoonup} {\mathbf{#1}} } \)
\( \newcommand{\vecd}[1]{\overset{-\!-\!\rightharpoonup}{\vphantom{a}\smash {#1}}} \)
\( \newcommand{\dsum}{\displaystyle\sum\limits} \)
\( \newcommand{\dint}{\displaystyle\int\limits} \)
\( \newcommand{\dlim}{\displaystyle\lim\limits} \)
\( \newcommand{\id}{\mathrm{id}}\) \( \newcommand{\Span}{\mathrm{span}}\)
( \newcommand{\kernel}{\mathrm{null}\,}\) \( \newcommand{\range}{\mathrm{range}\,}\)
\( \newcommand{\RealPart}{\mathrm{Re}}\) \( \newcommand{\ImaginaryPart}{\mathrm{Im}}\)
\( \newcommand{\Argument}{\mathrm{Arg}}\) \( \newcommand{\norm}[1]{\| #1 \|}\)
\( \newcommand{\inner}[2]{\langle #1, #2 \rangle}\)
\( \newcommand{\Span}{\mathrm{span}}\)
\( \newcommand{\id}{\mathrm{id}}\)
\( \newcommand{\Span}{\mathrm{span}}\)
\( \newcommand{\kernel}{\mathrm{null}\,}\)
\( \newcommand{\range}{\mathrm{range}\,}\)
\( \newcommand{\RealPart}{\mathrm{Re}}\)
\( \newcommand{\ImaginaryPart}{\mathrm{Im}}\)
\( \newcommand{\Argument}{\mathrm{Arg}}\)
\( \newcommand{\norm}[1]{\| #1 \|}\)
\( \newcommand{\inner}[2]{\langle #1, #2 \rangle}\)
\( \newcommand{\Span}{\mathrm{span}}\) \( \newcommand{\AA}{\unicode[.8,0]{x212B}}\)
\( \newcommand{\vectorA}[1]{\vec{#1}} % arrow\)
\( \newcommand{\vectorAt}[1]{\vec{\text{#1}}} % arrow\)
\( \newcommand{\vectorB}[1]{\overset { \scriptstyle \rightharpoonup} {\mathbf{#1}} } \)
\( \newcommand{\vectorC}[1]{\textbf{#1}} \)
\( \newcommand{\vectorD}[1]{\overrightarrow{#1}} \)
\( \newcommand{\vectorDt}[1]{\overrightarrow{\text{#1}}} \)
\( \newcommand{\vectE}[1]{\overset{-\!-\!\rightharpoonup}{\vphantom{a}\smash{\mathbf {#1}}}} \)
\( \newcommand{\vecs}[1]{\overset { \scriptstyle \rightharpoonup} {\mathbf{#1}} } \)
\(\newcommand{\longvect}{\overrightarrow}\)
\( \newcommand{\vecd}[1]{\overset{-\!-\!\rightharpoonup}{\vphantom{a}\smash {#1}}} \)
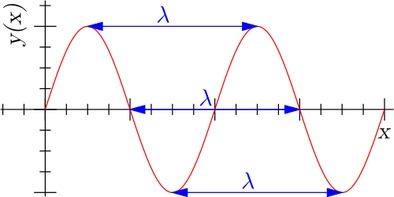
\(\newcommand{\avec}{\mathbf a}\) \(\newcommand{\bvec}{\mathbf b}\) \(\newcommand{\cvec}{\mathbf c}\) \(\newcommand{\dvec}{\mathbf d}\) \(\newcommand{\dtil}{\widetilde{\mathbf d}}\) \(\newcommand{\evec}{\mathbf e}\) \(\newcommand{\fvec}{\mathbf f}\) \(\newcommand{\nvec}{\mathbf n}\) \(\newcommand{\pvec}{\mathbf p}\) \(\newcommand{\qvec}{\mathbf q}\) \(\newcommand{\svec}{\mathbf s}\) \(\newcommand{\tvec}{\mathbf t}\) \(\newcommand{\uvec}{\mathbf u}\) \(\newcommand{\vvec}{\mathbf v}\) \(\newcommand{\wvec}{\mathbf w}\) \(\newcommand{\xvec}{\mathbf x}\) \(\newcommand{\yvec}{\mathbf y}\) \(\newcommand{\zvec}{\mathbf z}\) \(\newcommand{\rvec}{\mathbf r}\) \(\newcommand{\mvec}{\mathbf m}\) \(\newcommand{\zerovec}{\mathbf 0}\) \(\newcommand{\onevec}{\mathbf 1}\) \(\newcommand{\real}{\mathbb R}\) \(\newcommand{\twovec}[2]{\left[\begin{array}{r}#1 \\ #2 \end{array}\right]}\) \(\newcommand{\ctwovec}[2]{\left[\begin{array}{c}#1 \\ #2 \end{array}\right]}\) \(\newcommand{\threevec}[3]{\left[\begin{array}{r}#1 \\ #2 \\ #3 \end{array}\right]}\) \(\newcommand{\cthreevec}[3]{\left[\begin{array}{c}#1 \\ #2 \\ #3 \end{array}\right]}\) \(\newcommand{\fourvec}[4]{\left[\begin{array}{r}#1 \\ #2 \\ #3 \\ #4 \end{array}\right]}\) \(\newcommand{\cfourvec}[4]{\left[\begin{array}{c}#1 \\ #2 \\ #3 \\ #4 \end{array}\right]}\) \(\newcommand{\fivevec}[5]{\left[\begin{array}{r}#1 \\ #2 \\ #3 \\ #4 \\ #5 \\ \end{array}\right]}\) \(\newcommand{\cfivevec}[5]{\left[\begin{array}{c}#1 \\ #2 \\ #3 \\ #4 \\ #5 \\ \end{array}\right]}\) \(\newcommand{\mattwo}[4]{\left[\begin{array}{rr}#1 \amp #2 \\ #3 \amp #4 \\ \end{array}\right]}\) \(\newcommand{\laspan}[1]{\text{Span}\{#1\}}\) \(\newcommand{\bcal}{\cal B}\) \(\newcommand{\ccal}{\cal C}\) \(\newcommand{\scal}{\cal S}\) \(\newcommand{\wcal}{\cal W}\) \(\newcommand{\ecal}{\cal E}\) \(\newcommand{\coords}[2]{\left\{#1\right\}_{#2}}\) \(\newcommand{\gray}[1]{\color{gray}{#1}}\) \(\newcommand{\lgray}[1]{\color{lightgray}{#1}}\) \(\newcommand{\rank}{\operatorname{rank}}\) \(\newcommand{\row}{\text{Row}}\) \(\newcommand{\col}{\text{Col}}\) \(\renewcommand{\row}{\text{Row}}\) \(\newcommand{\nul}{\text{Nul}}\) \(\newcommand{\var}{\text{Var}}\) \(\newcommand{\corr}{\text{corr}}\) \(\newcommand{\len}[1]{\left|#1\right|}\) \(\newcommand{\bbar}{\overline{\bvec}}\) \(\newcommand{\bhat}{\widehat{\bvec}}\) \(\newcommand{\bperp}{\bvec^\perp}\) \(\newcommand{\xhat}{\widehat{\xvec}}\) \(\newcommand{\vhat}{\widehat{\vvec}}\) \(\newcommand{\uhat}{\widehat{\uvec}}\) \(\newcommand{\what}{\widehat{\wvec}}\) \(\newcommand{\Sighat}{\widehat{\Sigma}}\) \(\newcommand{\lt}{<}\) \(\newcommand{\gt}{>}\) \(\newcommand{\amp}{&}\) \(\definecolor{fillinmathshade}{gray}{0.9}\) Physics shows us that energy is always transmitted in waves. Every wave has a high point called a crest and a low point called a trough. The height of a wave from the center line to its crest is its amplitude. The distance between waves from crest to crest (or trough to trough) is its wavelength.
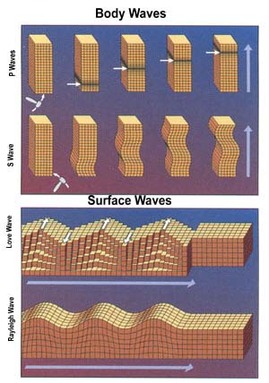
The energy from earthquakes travels in seismic waves, which were discussed in the chapter “Plate Tectonics.” The study of seismic waves is known as seismology. Seismologists use seismic waves to learn about earthquakes and also to learn about the Earth’s interior. The two types of seismic waves described in “Plate Tectonics,” P-waves and S-waves, are known as body waves because they move through the solid body of the Earth. P-waves travel through solids, liquids, and gases. S-waves only move through solids. Surface waves travel along the ground, outward from an earthquake’s epicenter. Surface waves are the slowest of all seismic waves, traveling at 2.5 km (1.5 miles) per second. In an earthquake, body waves produce sharp jolts, while rolling motions of surface waves do most of the damage in an earthquake.
Measuring Magnitude
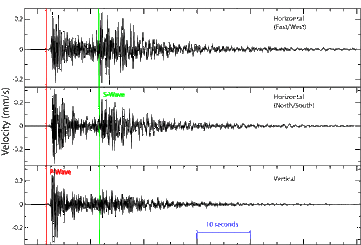
 Seismograms record seismic waves. Over the past century, scientists have developed several ways of measuring earthquake intensity. The currently accepted method is the moment magnitude scale, which measures the total amount of energy released by the earthquake. At this time, seismologists have not found a reliable method for predicting earthquakes.A seismograph produces a graph-like representation of the seismic waves it receives and records them onto a seismogram. Seismograms contain information that can be used to determine how strong an earthquake was, how long it lasted, and how far away it was. Modern seismometers record ground motions using electronic motion detectors. The data are then kept digitally on a computer.
If a seismogram records P-waves and surface waves but not S-waves, the seismograph was on the other side of the Earth from the earthquake because those waves cannot travel through the liquid core of the earth. The amplitude of the waves can be used to determine the magnitude of the earthquake, which will be discussed in a later section.In order to locate an earthquake epicenter, scientists must first determine the epicenter distance from three different seismographs. The longer the time between the arrival of the P-wave and S-wave, the farther away is the epicenter. So the difference in the P and S wave arrival times determines the distance between the epicenter and a seismometer. This animation shows how distance is determined using P, S, and surface waves.
The scientist then draws a circle with a radius equal to the distance from the epicenter for that seismograph. The epicenter is somewhere along that circle. This is done for three locations. Using data from two seismographs, the two circles will intercept at two points. A third circle will intercept the other two circles at a single point. This point is the earthquake epicenter. Although useful for decades, this technique has been replaced by digital calculations. Seismic stations record ten earthquakes in this animation.
Measuring Earthquakes
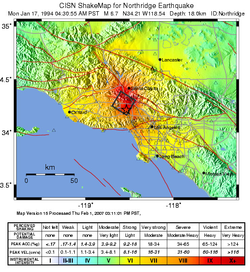
 People have always tried to quantify the size of and damage done by earthquakes. Since early in the 20th century, there have been three methods The oldest of the scales is called the Mercalli Intensity scale. Earthquakes are described in terms of what nearby residents felt and the damage that was done to nearby structures. This scale is more qualitative in information because it’s based on visual damage and not the actual energy released by the earthquake. Today these maps are still important and various seismological stations will create shake maps of the surface damage.With the invention of the seismograph station, the Richter magnitude scale was created. Developed in 1935 by Charles Richter, this scale uses a seismometer to measure the magnitude of the largest jolt of energy released by an earthquake. Today, the moment magnitude scale has replaced the Richter scale. The moment magnitude scale measures the total energy released by an earthquake. Moment magnitude is calculated from the area of the fault that is ruptured and the distance the ground moved along the fault.The Richter scale and the moment magnitude scale are logarithmic. The amplitude of the largest wave increases ten times from one integer to the next. An increase in one integer means that thirty times more energy was released. These two scales often give very similar measurements.How does the amplitude of the largest seismic wave of a magnitude 5 earthquake compare with the largest wave of a magnitude 4 earthquake? How does it compare with a magnitude 3 quake? The amplitude of the largest seismic wave of a magnitude 5 quake is 10 times that of a magnitude 4 quake and 100 times that of a magnitude 3 quake.
Each scale has their benefits. As mentioned above, the Mercalli Intensity scale is based on how much damage someone would see. This is relative though because some places have strong building codes, and the rock material underneath will impact ground shaking without changing the energy released at the focus. With the Richter scale, a single sharp jolt measures higher than a very long intense earthquake that releases more energy. The moment magnitude scale more accurately reflects the energy released and the damage caused. Today, most seismologists now use the moment magnitude scale.
- Dynamic Earth: Introduction to Physical Geography. Authored by: R. Adam Dastrup. Located at: http://www.opengeography.org/physical-geography.html. Project: Open Geography Education. License: CC BY-SA: Attribution-ShareAlike


