

14.5: Energy Flow Through Ecosystems
- Page ID
- 42731

\( \newcommand{\vecs}[1]{\overset { \scriptstyle \rightharpoonup} {\mathbf{#1}} } \)
\( \newcommand{\vecd}[1]{\overset{-\!-\!\rightharpoonup}{\vphantom{a}\smash {#1}}} \)
\( \newcommand{\dsum}{\displaystyle\sum\limits} \)
\( \newcommand{\dint}{\displaystyle\int\limits} \)
\( \newcommand{\dlim}{\displaystyle\lim\limits} \)
\( \newcommand{\id}{\mathrm{id}}\) \( \newcommand{\Span}{\mathrm{span}}\)
( \newcommand{\kernel}{\mathrm{null}\,}\) \( \newcommand{\range}{\mathrm{range}\,}\)
\( \newcommand{\RealPart}{\mathrm{Re}}\) \( \newcommand{\ImaginaryPart}{\mathrm{Im}}\)
\( \newcommand{\Argument}{\mathrm{Arg}}\) \( \newcommand{\norm}[1]{\| #1 \|}\)
\( \newcommand{\inner}[2]{\langle #1, #2 \rangle}\)
\( \newcommand{\Span}{\mathrm{span}}\)
\( \newcommand{\id}{\mathrm{id}}\)
\( \newcommand{\Span}{\mathrm{span}}\)
\( \newcommand{\kernel}{\mathrm{null}\,}\)
\( \newcommand{\range}{\mathrm{range}\,}\)
\( \newcommand{\RealPart}{\mathrm{Re}}\)
\( \newcommand{\ImaginaryPart}{\mathrm{Im}}\)
\( \newcommand{\Argument}{\mathrm{Arg}}\)
\( \newcommand{\norm}[1]{\| #1 \|}\)
\( \newcommand{\inner}[2]{\langle #1, #2 \rangle}\)
\( \newcommand{\Span}{\mathrm{span}}\) \( \newcommand{\AA}{\unicode[.8,0]{x212B}}\)
\( \newcommand{\vectorA}[1]{\vec{#1}} % arrow\)
\( \newcommand{\vectorAt}[1]{\vec{\text{#1}}} % arrow\)
\( \newcommand{\vectorB}[1]{\overset { \scriptstyle \rightharpoonup} {\mathbf{#1}} } \)
\( \newcommand{\vectorC}[1]{\textbf{#1}} \)
\( \newcommand{\vectorD}[1]{\overrightarrow{#1}} \)
\( \newcommand{\vectorDt}[1]{\overrightarrow{\text{#1}}} \)
\( \newcommand{\vectE}[1]{\overset{-\!-\!\rightharpoonup}{\vphantom{a}\smash{\mathbf {#1}}}} \)
\( \newcommand{\vecs}[1]{\overset { \scriptstyle \rightharpoonup} {\mathbf{#1}} } \)
\(\newcommand{\longvect}{\overrightarrow}\)
\( \newcommand{\vecd}[1]{\overset{-\!-\!\rightharpoonup}{\vphantom{a}\smash {#1}}} \)
\(\newcommand{\ket}[1]{\left| #1 \right>}\)
\(\newcommand{\bra}[1]{\left< #1 \right|}\)
\(\newcommand{\braket}[2]{\left< #1 \vphantom{#2} \right| \left. #2 \vphantom{#1} \right>}\)
\(\newcommand{\braopket}[3]{\left< #1 \vphantom{#2}\vphantom{#3} \right| #2 \vphantom{#1}\vphantom{#3} \left| #3 \vphantom{#1}\vphantom{#2} \right>}\)
\(\newcommand{\qmvec}[1]{\mathbf{\vec{#1}}}\)
\(\newcommand{\op}[1]{\hat{\mathbf{#1}}}\)
\(\newcommand{\expect}[1]{\langle #1 \rangle}\)
\(\newcommand{\dfn}[1]{\emph{\textbf{#1}}}\)
Energy capture and use
Photosynthesis
At the base of an ecosystem, primary producers are actively converting solar energy into stored chemical energy. Photosynthesis is the process of converting solar energy, water, and carbon dioxide into carbohydrates and oxygen. Figure \(\PageIndex{1}\) illustrates the process of photosynthesis within a plant cell, specifically inside an organelle called the chloroplast. Water is taken up from the roots and light energy from the sun is absorbed by the green thylakoid membranes. This first stage, known as the light dependent reactions, uses that energy to split the water molecules, which releases oxygen as a byproduct through the stomata on the leaf surface. The process thus occurs in two steps: first light energy is absorbed by chlorophyll to split a molecule of water releasing hydrogen and oxygen. The second step uses the energy to convert carbon dioxide to carbohydrates.

Figure \(\PageIndex{1}\) explains photosynthesis, the process by which plants convert light energy into chemical energy stored in sugars. The figure follows the movement of water, carbon dioxide, light energy, oxygen, and energy-carrying molecules through two major stages: light-dependent reactions and the Calvin cycle (light-independent reactions).
Inputs to photosynthesis - At the bottom left, roots absorb water (H₂O) from the soil. Water moves upward into plant tissues and eventually enters chloroplasts. A close-up of a leaf shows stomata, small openings that allow carbon dioxide (CO₂) to enter the leaf and oxygen (O₂) to leave. Sunlight, labeled light energy, provides the energy required to drive photosynthesis.
Light-dependent reactions - Inside the chloroplast, sunlight strikes the thylakoid membranes, which contain chlorophyll. The diagram shows three key inputs:
- Water (H₂O)
- Light
- Chlorophyll-containing thylakoid membranes
Using light energy, water molecules are split. This process:
- Releases oxygen (O₂) as a byproduct.
- Produces the energy-carrying molecules ATP and NADPH.
Oxygen exits the plant through the stomata.
Calvin cycle (light-independent reactions) - The ATP and NADPH produced in the light reactions move into the Calvin cycle, shown as a circular pathway in the stroma of the chloroplast. Carbon dioxide enters the cycle and is incorporated through carbon fixation. The cycle proceeds through three main stages:
- Carbon fixation
- Reduction
- Regeneration of the carbon dioxide acceptor
Using ATP and NADPH as energy sources, the cycle produces G3P (a simple sugar), which is used to make glucose and other carbohydrates. The diagram also shows ATP and NADPH being converted back into ADP and NADP⁺, which are recycled to the light-dependent reactions.
Products - The primary outputs are:
- Sugars (glucose), used for growth, storage, and cellular respiration.
- Oxygen, released into the atmosphere.
At the bottom, the overall photosynthesis equation is shown:
6 CO₂ + 6 H₂O + light energy → C₆H₁₂O₆ (glucose) + 6 O₂
The carbohydrate (C6H12O6) can be converted into starch and stored by the plant. Carbohydrate can be combined with other sugar molecules to make cellulose, the basic structural material of a plant.
The middle of the diagram shows energy being transferred to the second stage via energy carriers named ATP and NADPH. These carriers move into the stroma, which is the fluid filled space of the chloroplast where the Calvin cycle occurs. During this second stage, also called the light independent reactions, carbon dioxide is taken in from the atmosphere. The plant uses the stored energy from the first stage to convert the carbon dioxide into glucose, which is a chemical energy or food used for plant growth and cell respiration. Recycled carriers labeled ADP and NADP plus then return to the thylakoid to be recharged by sunlight, completing the continuous cycle.
Oddly enough, of all the solar radiation striking a plant, only about 1% is used in photosynthesis. The rate of photosynthesis is dependent on several things, especially the amount of light received ... up to a point. As solar radiation increases the rate of photosynthesis increases. For many plants there is an upper limit to the rate of photosynthesis. In some plants as incident solar radiation increases the rate of photosynthesis levels off, or may decrease. The increasing solar energy load causes the plant to be too hot and the need to cool the plant increases. As a result, transpiration takes over as the dominate plant process. Transpiration, the loss of water from plants, acts to cool the plant by releasing latent energy. Adequate supplies of water, carbon dioxide and the availability of nutrients in the soil affect photosynthesis.
Respiration
While photosynthesis builds stored chemical energy in a plant, respiration is the process of "burning" stored chemical energy, basically through oxidation, for maintaining plant metabolism. During plant respiration, carbohydrates combine with oxygen and is reduced to carbon dioxide, water, and heat.
C6H12O6 + 6O2 → 6CO2 + 6H2O + 2830 kj
While photosynthesis operates only during day when sunshine is available, respiration goes on both night and day. Plant growth occurs so long as photosynthesis exceeds respiration.
Transpiration
Transpiration is the loss of water from plant leaves. Water exits the leaf through stomata, which are tiny pore spaces in the leaf. The rate of transpiration depends on air temperature and solar radiation. As pointed out earlier, transpiration is a cooing process for plants when temperatures or incident light rise too high and cause heating of the plant. Low humidity, often aided by windy conditions, creates a vapor gradient between the plant and the air. This too induces transpiration. Soil factors are important control over transpiration. If the pore space between soil particles are too large the soil will have poor or low soil capillary. That is, the rate of water rise is too low for plants to extract water from the soil and maintain proper moisture supply. Low soil capillary results from soil drying too. During the moist season, ample soil water is available to line soil particles to aid the movement of soil water upwards to the root zone.
However, during the dry season, a dry layer of soil develops beneath the root zone inhibiting the upward movement of capillary water causing a capillary lag. The plant ultimately wilts as it cannot extract enough water to meet the increasing demand for water during warm seasons. A small soil moisture reserve will inhibit transpiration too.
Biomass Productivity
Net biomass productivity is the difference between gross productivity (production of plant material by photosynthesis) and respiration. So long as the rate of production exceeds that of respiration, the plant will grow. Net productivity represents the amount of organic material produced by a plant. Net productivity is closely related to a number of environmental factors like climate, soils, and available nutrients. Net biomass production will be highest where there is an ample supply of moisture to meet the needs of plants. Biomass productivity is also high where soils are rich in nutrients and have a positive soil moisture balance. Figure \(\PageIndex{2}\) illustrates this well. With ample rainfall and sunlight, the tropical rain forest ranks the highest in terms of organic matter production.
Figure \(\PageIndex{2}\) displays the net primary productivity of selected environments measured in grams per square meter per year. The tropical rain forest is shown to have the highest productivity, followed by tropical seasonal forests and temperate evergreen forests. In contrast, extreme environments such as the open ocean, desert scrub, and tundra show significantly lower levels of organic matter production. The data illustrates how regions with abundant moisture and sunlight produce the most biomass.

Figure \(\PageIndex{2}\) is a bar chart comparing mean net primary productivity per unit area for six major terrestrial biomes. Net primary productivity is measured in dry grams of organic matter produced per square meter per year.
The vertical axis is labeled Net Productivity and ranges from 0 to approximately 2,000 grams per square meter per year. The horizontal axis lists six biome types:
- Tropical Forest
- Temperate Forest
- Boreal Forest
- Tropical Savanna
- Temperate Grassland
- Desert
The bars show the following pattern:
- Tropical Forest has the highest productivity, at approximately 2,000 g/m²/year.
- Temperate Forest is the second most productive, at about 1,250 g/m²/year.
- Boreal Forest has a productivity of roughly 850 g/m²/year.
- Tropical Savanna follows at about 750 g/m²/year.
- Temperate Grassland produces approximately 550 g/m²/year.
- Desert has the lowest productivity, at roughly 100 g/m²/year.
The overall trend shows that productivity generally decreases from forests to grasslands and is lowest in deserts.
Human pressure on land and vegetation resources for food, wood-based fuel, fiber, and building materials is calling into question whether the earth's net production can sustain such use. Scientists are employing satellite technology to determine the trends in human consumption of net primary production. Human use of earth's annual production rose from 20 to 25 percent from 1995 to 2005. As society looks to land conversion for biofuels, climate changes, and biodiversity loss occurs, a tipping point at which net production fails to meet demand may be reached in the not-so-distant future.
Trophic Levels and Food Chains
The biotic elements that comprise an ecosystem fall into one of several trophic levels. The trophic level of an organism is its position in a food chain, the sequence of consumption and energy transfer through the environment. For example, a simple grazing food chain comprises
Plant → herbivore → carnivore

At the base of the food chain lies the primary producers. Primary producers are principally green plants and certain bacteria. They convert solar energy into organic energy. Above the primary producers are the consumers who ingest live plants or the prey of others. Decomposers, such as, bacteria, molds, and fungi make use of energy stored in already dead plant and animal tissues.
Figure \(\PageIndex{3}\) displays a cluster of wild mushrooms, which serve as decomposers within an ecosystem. Decomposers such as fungi, like mushrooms, absorb nutrients from the organisms by secreting enzymes to break up the chemical compounds that make up dead plants and animals. By doing so, they release stored energy and nutrients back into the soil, making them available for use by primary producers at the base of the food chain.
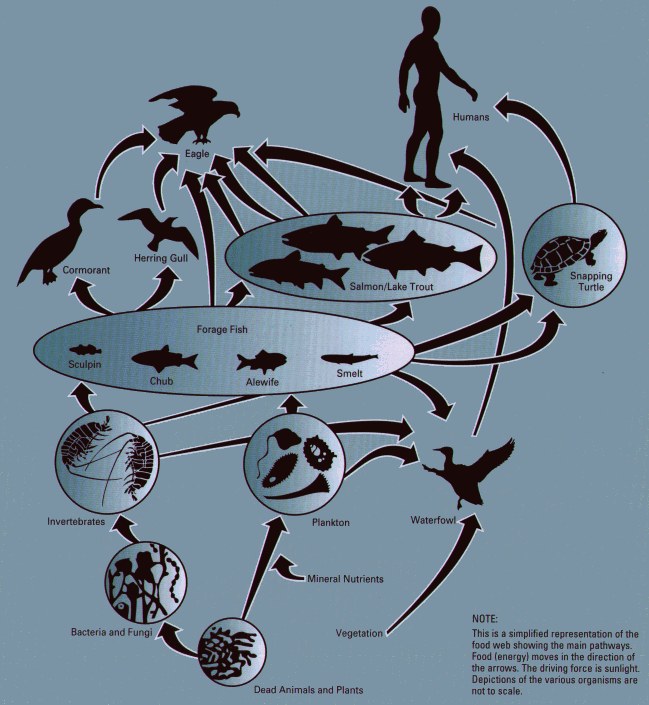
Figure \(\PageIndex{4}\) illustrates the intricate food web of the Great Lakes ecosystem. It uses arrows to show how energy is transferred from primary producers like phytoplankton and algae to various levels of consumers, including zooplankton, small fish, and top level predators such as trout and salmon. The overlapping connections demonstrate that most organisms have multiple food sources and play various roles within the trophic structure, highlighting the complexity of energy flow and species interaction in a large aquatic environment.
Two laws of physics are important in the study of energy flow through ecosystems. The first law of thermodynamics states that energy cannot be created or destroyed; it can only be changed from one form to another. Energy for the functioning of an ecosystem comes from the Sun. Solar energy is absorbed by plants where in it is converted to stored chemical energy.
The second law of thermodynamics states that whenever energy is transformed, there is a loss energy through the release of heat. This occurs when energy is transferred between trophic levels as illustrated in a food web. When one animal feeds off another, there is a loss of heat (energy) in the process. Additional loss of energy occurs during respiration and movement. Hence, more and more energy is lost as one moves up through trophic levels. This fact lends more credence to the advantages of a vegetarian diet. For example, 1350 kilograms of corn and soybeans is capable of supporting one person if converted to beef. However, 1350 kilograms of soybeans and corn utilized directly without converting to beef will support 22 people!
Figure \(\PageIndex{4}\) illustrates the intricate food web of the Great Lakes ecosystem. At the top, primary producers including microscopic algae, phytoplankton, and submerged or emergent aquatic plants like coontail are powered by solar energy and nutrients. In the center aquatic community cross-section, lower trophic levels consist of phytoplankton being eaten by zooplankton and native macroinvertebrates like Diporeia, while invasive zebra and quagga mussels reside on the lake bottom alongside the invasive round goby. For the mid-to-upper trophic levels, pelagic small fish like the invasive alewife and native emerald shiner consume zooplankton and are subsequently preyed upon by apex predators including lake trout, walleye, and the ancient lake sturgeon at the bottom, with green arrows representing the flow of energy from the consumed organism to the consumer. On the right side, terrestrial and semi-aquatic predators influence the system as a great blue heron and a cormorant eat small fish, while a bald eagle perched on a branch sits at the top of the food chain preying on both the birds and large fish. Finally, three detailed inset boxes along the bottom row highlight specific ecological concepts: the left box focuses on parasitism and predation by showing a predatory sea lamprey feeding on a lake trout's bodily fluids; the center box details competition from invasives by demonstrating how zebra and quagga mussels consume massive amounts of phytoplankton to outcompete native Diporeia; and the right box illustrates bioaccumulation using a vertical pyramid with an upward-pointing red arrow to show toxin concentrations multiplying as they travel up the food chain from phytoplankton to zooplankton, small fish, and ultimately peaking in the lake trout.