

11.1: Water in Motion
- Page ID
- 42713

\( \newcommand{\vecs}[1]{\overset { \scriptstyle \rightharpoonup} {\mathbf{#1}} } \)
\( \newcommand{\vecd}[1]{\overset{-\!-\!\rightharpoonup}{\vphantom{a}\smash {#1}}} \)
\( \newcommand{\dsum}{\displaystyle\sum\limits} \)
\( \newcommand{\dint}{\displaystyle\int\limits} \)
\( \newcommand{\dlim}{\displaystyle\lim\limits} \)
\( \newcommand{\id}{\mathrm{id}}\) \( \newcommand{\Span}{\mathrm{span}}\)
( \newcommand{\kernel}{\mathrm{null}\,}\) \( \newcommand{\range}{\mathrm{range}\,}\)
\( \newcommand{\RealPart}{\mathrm{Re}}\) \( \newcommand{\ImaginaryPart}{\mathrm{Im}}\)
\( \newcommand{\Argument}{\mathrm{Arg}}\) \( \newcommand{\norm}[1]{\| #1 \|}\)
\( \newcommand{\inner}[2]{\langle #1, #2 \rangle}\)
\( \newcommand{\Span}{\mathrm{span}}\)
\( \newcommand{\id}{\mathrm{id}}\)
\( \newcommand{\Span}{\mathrm{span}}\)
\( \newcommand{\kernel}{\mathrm{null}\,}\)
\( \newcommand{\range}{\mathrm{range}\,}\)
\( \newcommand{\RealPart}{\mathrm{Re}}\)
\( \newcommand{\ImaginaryPart}{\mathrm{Im}}\)
\( \newcommand{\Argument}{\mathrm{Arg}}\)
\( \newcommand{\norm}[1]{\| #1 \|}\)
\( \newcommand{\inner}[2]{\langle #1, #2 \rangle}\)
\( \newcommand{\Span}{\mathrm{span}}\) \( \newcommand{\AA}{\unicode[.8,0]{x212B}}\)
\( \newcommand{\vectorA}[1]{\vec{#1}} % arrow\)
\( \newcommand{\vectorAt}[1]{\vec{\text{#1}}} % arrow\)
\( \newcommand{\vectorB}[1]{\overset { \scriptstyle \rightharpoonup} {\mathbf{#1}} } \)
\( \newcommand{\vectorC}[1]{\textbf{#1}} \)
\( \newcommand{\vectorD}[1]{\overrightarrow{#1}} \)
\( \newcommand{\vectorDt}[1]{\overrightarrow{\text{#1}}} \)
\( \newcommand{\vectE}[1]{\overset{-\!-\!\rightharpoonup}{\vphantom{a}\smash{\mathbf {#1}}}} \)
\( \newcommand{\vecs}[1]{\overset { \scriptstyle \rightharpoonup} {\mathbf{#1}} } \)
\(\newcommand{\longvect}{\overrightarrow}\)
\( \newcommand{\vecd}[1]{\overset{-\!-\!\rightharpoonup}{\vphantom{a}\smash {#1}}} \)
\(\newcommand{\ket}[1]{\left| #1 \right>}\)
\(\newcommand{\bra}[1]{\left< #1 \right|}\)
\(\newcommand{\braket}[2]{\left< #1 \vphantom{#2} \right| \left. #2 \vphantom{#1} \right>}\)
\(\newcommand{\braopket}[3]{\left< #1 \vphantom{#2}\vphantom{#3} \right| #2 \vphantom{#1}\vphantom{#3} \left| #3 \vphantom{#1}\vphantom{#2} \right>}\)
\(\newcommand{\qmvec}[1]{\mathbf{\vec{#1}}}\)
\(\newcommand{\op}[1]{\hat{\mathbf{#1}}}\)
\(\newcommand{\expect}[1]{\langle #1 \rangle}\)
\(\newcommand{\dfn}[1]{\emph{\textbf{#1}}}\)
Waves and Water Movement
Waves are undulations on a water body's surface, primarily created when wind blowing over the water transfers kinetic energy through frictional stress. This energy creates alternating high points called crests and low points called troughs. A wave's height and length are determined by three factors: wind velocity, wind duration, and the fetch (the uninterrupted distance the wind blows over open water). An increase in any of these factors will increase wave size, up to a maximum threshold known as a fully developed sea.
Here are the definitions for the fundamental wave properties featured in Figure \(\PageIndex{1}\):
- Crest: The highest point of a wave.
- Trough: The lowest point of a wave.
- Wave Height: The vertical distance between a wave's trough and its crest.
- Wave Length: The horizontal distance between consecutive corresponding points of a wave, such as from one crest to the next.
- Wave Amplitude: The vertical distance from the still water level (equilibrium) to a wave's crest.
- Wave Period: The time it takes for one complete wavelength to pass a fixed point (measured in seconds).
- Wave Frequency : The number of wave crests that pass a fixed point in a given amount of time (measured in Hertz, or cycles per second).

Figure \(\PageIndex{1}\) illustrates the main properties of ocean waves using a cross-sectional view. The highest point of a wave is labeled the crest, and the lowest point is the trough. Wave height is the vertical distance from the trough to the crest. Wave amplitude is the vertical distance from the still-water level to the crest, equal to half the wave height. Wavelength is the horizontal distance between consecutive crests or consecutive troughs. Wave period is the time required for one complete wave cycle to pass a fixed point. Wave frequency is the number of wave crests passing a fixed point each second and is the inverse of wave period. The diagram also shows deep-water wave motion beneath the surface and provides an example where three wave cycles per second correspond to a frequency of three hertz.
When waves travel across the deep open ocean, they move up and down in a circular pattern. The water particles themselves do not really move forward; instead, they pass energy along the surface by moving in circles. These circular paths are biggest at the surface and get smaller and smaller as the water gets deeper. Eventually, deep down between the base of the wave and the sea floor, the water becomes completely still. Larger waves have bigger circular paths and reach much deeper into the ocean than smaller waves.
As the wave travels closer to the coast, the ocean floor begins to slope upward and the water becomes shallow. At a certain point offshore, the bottom of the wave starts to touch and drag against the ocean floor. This friction slows down the bottom part of the wave, while the top part keeps rushing forward at its original speed. This tug from the sea floor squeezes the wave and changes the water particles from perfect circles into squashed, forward-leaning oval shapes that move back and forth over the bottom.

Figure \(\PageIndex{2}\) explains why waves break at the shoreline in three stages. In deep water, wave energy moves forward while water particles travel in nearly circular paths with little net forward movement. As waves enter shallow water, the circular motion begins to interact with the seafloor, creating friction that slows the wave. The lower part of the wave slows more than the upper part, causing the wave to become steeper. At the shoreline, the wave crest moves faster than the wave base, causing the crest to topple forward and break. Water then rushes onto the beach as swash, producing the familiar surf zone.
As waves approach the shore, the shallowing sea floor creates friction that disrupts their stability. When the water depth decreases to roughly 1.3 times the height of the wave, the drag against the seabed slows the lower portion of the wave down. Because the top of the wave continues moving quickly, it outpaces the bottom, causing the crest to topple forward and collapse. This breaking action shatters the internal circular motion of the water particles, turning the wave into a wave of translation that physically pushes water forward onto the shore. This incoming rush of water surges up the beach slope as swash, advancing in the direction driven by the prevailing wind. After the swash exhausts its forward energy, gravity pulls the water directly back down the slope toward the ocean at a perpendicular 90-degree angle, creating the retreating current known as backwash.

Figure \(\PageIndex{3}\) explains how waves break and move water onto and off a beach in six stages. In deep water, waves are stable and water particles move in circular paths with little net forward movement. As waves enter shallow water, the seabed creates friction that slows the lower part of the wave. The crest continues moving faster than the base, causing the wave to steepen and eventually topple forward. When the wave breaks, water is pushed shoreward as a wave of translation. The water rushes up the beach as swash, moving in the direction of the prevailing wind. After losing energy, gravity pulls the water back down the beach toward the ocean as backwash. The infographic's key takeaway is that waves break when shallow water slows the wave base, causing the crest to collapse and drive water onto the shore before it returns seaward under gravity.
Swells are smooth, rounded waves that travel outward from a storm center, or they continue as broad undulations across the ocean surface after the wind dies down. The wave slope is calculated as the ratio of wave height to wave length, typically ranging from 1:25 to 1:50. This means that for a typical stable swell, the horizontal wave length is 25 to 50 times greater than its vertical wave height, resulting in a broad and gentle profile. However, if the wave height increases relative to its length to the point where the slope exceeds a ratio of 1:7—meaning the wave length is less than 7 times the wave height—the wave becomes completely unstable, causing it to fall over itself and break.
Tides
Nearly all marine coastlines experience the rhythmic rise and fall of sea level called tides. The daily oscillation in ocean level is a product of the gravitational attraction of the Moon and Sun on Earth's oceans and varies in degree worldwide. Tidal action is an important force behind coastal erosion and deposition as the shoreline migrates landward and seaward.
Causes of Tides
The Tug-of-War: Why the Moon Wins
Even though the Sun is a giant compared to the Moon, the Moon has twice as much power over our tides (illustrated in Figure \(\PageIndex{3}\)). This happens because distance matters more than size. The Sun is massive, but it is incredibly far away. The Moon is much smaller, but it is right in our backyard, so its gravitational pull hits the Earth with much more local force.
This gravitational pull doesn't just affect the ocean; it stretches everything. It pulls at the air (atmospheric tides), the water (ocean tides), and it even slightly bends the solid ground beneath our feet!
The Two Bulges: Gravity vs. Inertia
If you look at the oceans, they don't just bulge out on the side facing the Moon—they also bulge out on the exact opposite side of the Earth at the same time. This happens because of a balance between two forces: gravity (a pulling force) and inertia (the tendency of matter to stay put or keep moving in a straight line).
Here is how those two forces work on opposite sides of our planet:
-
The Near Side (Facing the Moon): Because this side is closest to the Moon, gravity is at its strongest here. The Moon's gravity easily beats out inertia, pulling the ocean water forward toward the sky. This creates the near tidal buldge .
-
The Far Side (Facing away from the Moon): Because this side is the farthest from the Moon, the Moon's gravity is at its weakest here. On this side, inertia wins the battle. As the Earth moves, the water on the far side tries to keep traveling in a straight line, flying outward away from the center of the Earth. This creates a far side tidal budge .
Because the Moon is closest to the near side, the ocean bulge facing the Moon is always slightly larger and stronger than the one on the opposite side.

Figure \(\PageIndex{4}\) explains why the Moon has a greater effect on Earth's tides than the Sun. Although the Sun is much more massive, it is much farther away from Earth. The Moon, while smaller in mass, is much closer and therefore exerts a stronger tidal force.
The diagram shows the Sun on one side of Earth and the Moon on the other. Average distances and masses are provided to illustrate the comparison. The Moon's gravitational influence on Earth is shown as approximately 2.17 times greater than the Sun's tidal influence, while the Sun's effect is about 0.46 times that of the Moon.
Both the Moon and Sun create tidal bulges by stretching Earth's oceans, atmosphere, and, to a much smaller extent, its crust. The lower portion of the diagram shows Earth with two tidal bulges: one facing the Moon and one on the opposite side. The key takeaway is that both celestial bodies contribute to tides, but the Moon produces the stronger tidal effect because it is much closer to Earth.
Why Tides Don't Line Up Perfectly
You might think high tide happens exactly when the Moon is directly overhead, but nature is a bit more complicated:
-
The Earth is spinning fast: The Earth rotates much faster than the Moon orbits us. Because the ocean has friction against the solid sea floor, the Earth's fast spin actually drags the tidal bulges slightly ahead of the Moon's position.
-
Land gets in the way: The Earth isn't a smooth, water-covered ball. We have continents, islands, shallow bays, and deep ocean trenches. The water has to slosh around these landmasses, and local winds or weather can push it around even more.
Because of this, the actual timing of high and low tides changes depending on exactly where you are on the coast!
Tidal Currents
Watching the tide "come in" one gets the impression that ocean water is moving in and out along the shoreline. The landward and seaward movement are a result the Earth rotating into and out of a semi-fixed tidal bulge as it changes its position relative to the Sun and Moon. Any point on Earth rotates through two bulges every 24 hours and 50 minutes producing two high tides and two low tides called each day. The difference in height between consecutive high and low tides is the tidal range. During a high tide water moves landward as a flood current. During low tide water recedes seaward as an ebb current. The two high tides and the two low tides do not have to be of equal height because the angle between the Moon and Earth changes each day. The tidal range is the difference in height between high and low tide.

This animation explains the relationship between tides and tidal currents along a shoreline.
As the tide rises, water moves horizontally toward the shore. This movement is called a flood current. As the tide falls, water moves horizontally away from the shore. This movement is called an ebb current.
The key idea is that changes in water level are linked to horizontal water movement along the coast:
- Rising tide = water moving shoreward (flood current)
- Falling tide = water moving seaward (ebb current)
The animation shows that tides are not only vertical changes in water level but are also associated with directional movement of water.
Interactive Resource: NOAA's Tides and Water Levels tutorial provides an interactive explanation of how tides form, including the roles of the Moon, the Sun, and tidal currents. The resource includes animations that demonstrate flood currents, ebb currents, and the movement of water associated with rising and falling tides.
Note: The animation is not fully accessible.
Spring and Neap Tides
The Sun and Moon are said to be in conjunction with they are aligned with the Earth. The highest tides, and greatest gravitational attraction, occur when the Sun and Moon are on the same side of the Earth creating a spring tide. This occurs during the new moon phase. A second lower spring tide occurs when the Sun and Moon are on opposite sides of the Earth during the full Moon phase.

Figure \(\PageIndex{5}\) explains spring tides, which occur when the Earth, Moon, and Sun are aligned in a straight line. Two situations are shown: a new moon, when the Moon is between Earth and the Sun, and a full moon, when Earth is between the Sun and the Moon.
In both cases, the gravitational forces of the Moon and Sun act along the same line and reinforce one another. This combined pull produces larger-than-normal tidal bulges on opposite sides of Earth, resulting in higher high tides and lower low tides than average.
The diagram shows Earth viewed from above the North Pole, with elongated tidal bulges extending toward and away from the Moon. The blue shaded regions represent areas of high tide. The key concept is that when the Sun, Moon, and Earth are aligned, their gravitational effects combine to create the strongest tidal range, known as a spring tide.
A neap tide results when the Sun and moon are at right angles to the Earth. There are two neap tides, at the first-quarter and third quarter phases of the Moon.

Figure \(\PageIndex{6}\) explains neap tides, which occur when the Sun and Moon are positioned at right angles, or 90 degrees, relative to Earth during the first-quarter and third-quarter moon phases. In these positions, the gravitational pull of the Sun and Moon partially counteracts one another rather than working together.
The diagram shows Earth viewed from above the North Pole with the Sun located to one side and the Moon positioned above or below Earth. Because the gravitational forces act in different directions, the tidal bulges are reduced in size. As a result, high tides are lower than normal and low tides are higher than normal.
The key takeaway is that neap tides produce the smallest tidal range because the Sun's and Moon's gravitational effects partially cancel each other, weakening the overall tide-generating force.
Located on the northeast end of the Gulf of Maine between New Brunswick and Nova Scotia, the Bay of Fundy is known for its high tidal range, as much as 48 feet (14 meters). Over a 100 billions tons of water passes in and out of the bay every 12 1/2 hours each day. Figure \(\PageIndex{7}\) displays the geographic funneling that drives the largest tidal variations on Earth, situated between New Brunswick and Nova Scotia. Moving from the wide opening near Maine and the Atlantic Ocean toward the narrow inner basins, the blue lines on the map track a dramatic escalation in water level changes. While the tidal range starts at twenty feet near the mouth, it climbs steadily through the channel to thirty-six feet, eventually peaking at forty-nine feet in the far eastern inlets. This visual surge reflects the mechanics detailed by the National Oceanic and Atmospheric Administration, where a massive volume of ocean water is forced into an increasingly narrow and shallow space. The extreme height is further amplified because the bay's natural twelve-hour sloshing rhythm perfectly matches the ocean's tide cycle, creating a massive resonant wave.
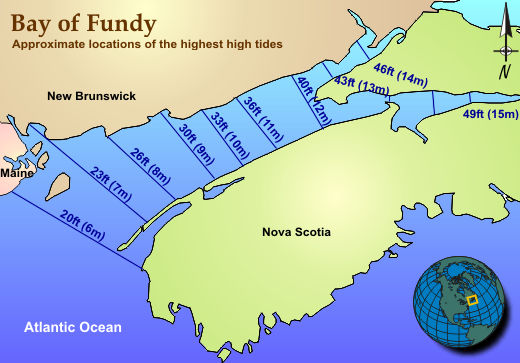
Figure \(\PageIndex{7}\) is a map that shows the Bay of Fundy between New Brunswick and Nova Scotia in eastern Canada. Numbers along the bay indicate the approximate height of the highest tides. Tidal heights increase from about 20 feet (6 meters) near the mouth of the bay to approximately 49 feet (15 meters) at its northeastern end. Intermediate values include 23, 26, 30, 33, 36, 40, 43, and 46 feet. The map demonstrates that tidal range becomes progressively greater as water moves inland through the narrowing Bay of Fundy, resulting in some of the highest tides in the world.