

5.10.2: Tundra Climate
- Page ID
- 42657

\( \newcommand{\vecs}[1]{\overset { \scriptstyle \rightharpoonup} {\mathbf{#1}} } \)
\( \newcommand{\vecd}[1]{\overset{-\!-\!\rightharpoonup}{\vphantom{a}\smash {#1}}} \)
\( \newcommand{\dsum}{\displaystyle\sum\limits} \)
\( \newcommand{\dint}{\displaystyle\int\limits} \)
\( \newcommand{\dlim}{\displaystyle\lim\limits} \)
\( \newcommand{\id}{\mathrm{id}}\) \( \newcommand{\Span}{\mathrm{span}}\)
( \newcommand{\kernel}{\mathrm{null}\,}\) \( \newcommand{\range}{\mathrm{range}\,}\)
\( \newcommand{\RealPart}{\mathrm{Re}}\) \( \newcommand{\ImaginaryPart}{\mathrm{Im}}\)
\( \newcommand{\Argument}{\mathrm{Arg}}\) \( \newcommand{\norm}[1]{\| #1 \|}\)
\( \newcommand{\inner}[2]{\langle #1, #2 \rangle}\)
\( \newcommand{\Span}{\mathrm{span}}\)
\( \newcommand{\id}{\mathrm{id}}\)
\( \newcommand{\Span}{\mathrm{span}}\)
\( \newcommand{\kernel}{\mathrm{null}\,}\)
\( \newcommand{\range}{\mathrm{range}\,}\)
\( \newcommand{\RealPart}{\mathrm{Re}}\)
\( \newcommand{\ImaginaryPart}{\mathrm{Im}}\)
\( \newcommand{\Argument}{\mathrm{Arg}}\)
\( \newcommand{\norm}[1]{\| #1 \|}\)
\( \newcommand{\inner}[2]{\langle #1, #2 \rangle}\)
\( \newcommand{\Span}{\mathrm{span}}\) \( \newcommand{\AA}{\unicode[.8,0]{x212B}}\)
\( \newcommand{\vectorA}[1]{\vec{#1}} % arrow\)
\( \newcommand{\vectorAt}[1]{\vec{\text{#1}}} % arrow\)
\( \newcommand{\vectorB}[1]{\overset { \scriptstyle \rightharpoonup} {\mathbf{#1}} } \)
\( \newcommand{\vectorC}[1]{\textbf{#1}} \)
\( \newcommand{\vectorD}[1]{\overrightarrow{#1}} \)
\( \newcommand{\vectorDt}[1]{\overrightarrow{\text{#1}}} \)
\( \newcommand{\vectE}[1]{\overset{-\!-\!\rightharpoonup}{\vphantom{a}\smash{\mathbf {#1}}}} \)
\( \newcommand{\vecs}[1]{\overset { \scriptstyle \rightharpoonup} {\mathbf{#1}} } \)
\(\newcommand{\longvect}{\overrightarrow}\)
\( \newcommand{\vecd}[1]{\overset{-\!-\!\rightharpoonup}{\vphantom{a}\smash {#1}}} \)
\(\newcommand{\ket}[1]{\left| #1 \right>}\)
\(\newcommand{\bra}[1]{\left< #1 \right|}\)
\(\newcommand{\braket}[2]{\left< #1 \vphantom{#2} \right| \left. #2 \vphantom{#1} \right>}\)
\(\newcommand{\braopket}[3]{\left< #1 \vphantom{#2}\vphantom{#3} \right| #2 \vphantom{#1}\vphantom{#3} \left| #3 \vphantom{#1}\vphantom{#2} \right>}\)
\(\newcommand{\qmvec}[1]{\mathbf{\vec{#1}}}\)
\(\newcommand{\op}[1]{\hat{\mathbf{#1}}}\)
\(\newcommand{\expect}[1]{\langle #1 \rangle}\)
\(\newcommand{\dfn}[1]{\emph{\textbf{#1}}}\)
Climate and Environmental Change in the Tundra
The tundra climate is a transitional climate between the Subarctic and Ice cap climates. It is a region of rolling to nearly level terrain almost entirely devoid of trees. Polar climates like the tundra are characterized by very cold temperatures and generally dry conditions. Temperatures never rise above 10oC (50oF) during the summer. The tundra located near the Arctic and Antarctic Circle, experiences times when the Sun never rises above the horizon.
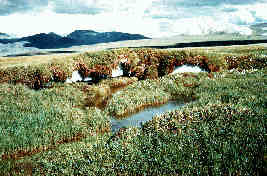
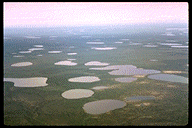
It is so cold in the tundra that permafrost is a prominent feature. Permafrost is soil, rock, or peat that has been frozen for more than two years. Near the surface the "active" layer thaws during the summertime and subsides or moves down slope. During the winter, the surface heaves as it refreezes. The alternating freeze-thaw cycles make it difficult to build structures on such a surface. More importantly, permafrost stores vast amounts of carbon in slowly decomposing organic matter. Disturbed by warming, greenhouse gases are released. For more about the role of permafrost in environmental change, try "Digging Deeper: Permafrost and Climate Change" or skip and continue reading.
As discussed in Chapter 3, surface features and human activities play are role in the composition of earth's atmosphere. Permafrost currently covers 24% of the exposed land in the high latitudes of Northern and Southern Hemispheres. Climate change scientists are carefully watching the impact of global warming on the seasonally and permanently frozen soil of the Arctic and subarctic.
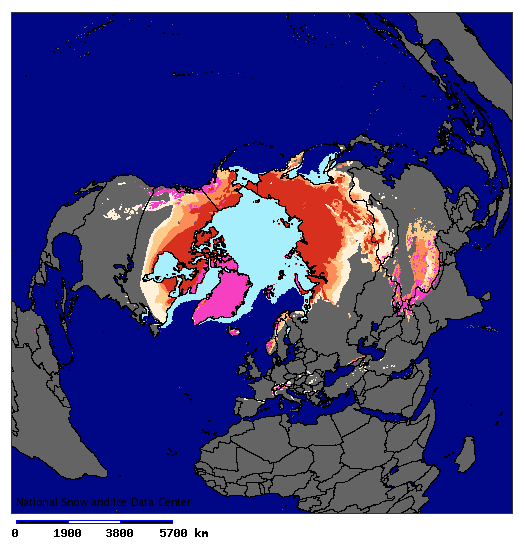
Figure \(\PageIndex{2}\) is a polar-projection map centered on the Arctic Ocean and surrounding northern landmasses.
The map displays the distribution of snow and ice cover across the Northern Hemisphere using multiple colors to indicate different surface conditions. Oceans are shown in dark blue, and land areas are shown primarily in gray.
A large region of light blue occupies the central Arctic Ocean, representing the main area of Arctic sea ice. Surrounding the central ice pack are bands of additional colors, including white, tan, orange, red, and pink, indicating varying extents or types of snow and ice cover.
Extensive snow and ice coverage appears across:
- Northern Canada and the Canadian Arctic Archipelago
- Greenland
- Alaska
- Northern Scandinavia
- Siberia and northern Russia
The greatest concentration of ice is located around the central Arctic Ocean, with snow-covered regions extending southward over portions of northern North America and Eurasia.
A scale bar at the bottom of the map ranges from 0 to 5,700 kilometers. Text in the lower-left corner reads “National Snow and Ice Data Center.”
The estimated maximum extent of seasonally frozen ground in non-permafrost regions has decreased by approximately 7% in the Northern Hemisphere, with up to 15% decrease during the spring. Degradation of permfrost appears to be resulting from increased summer air temperatures and changes in snow depth and duration. The active layer of permafrost measured at over 30 stations in Russia between 1956 to 1990 exhibited a 21 cm deepening. Records are too short in other parts of the world to show any kind of trend in active layer deepening.
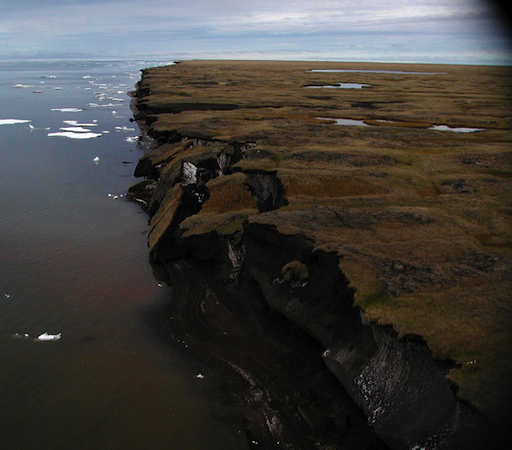
Results from a variety of IPCC climate scenarios point to a likely decline in the area of Northern Hemisphere permafrost of 20 - 35% by the mid-21st century. An average seasonal depth of thawing is expected to increase by 15-25% by 2050 and 30-50% over most permafrost regions.
It is estimated that northern circumpolar regions store twice the amount of carbon that is held in the atmosphere as CO2. As frozen soils thaw under warmer conditions, carbon dioxide, methane, and nitrous oxide is released into the atmosphere. Most of this is a product of the decomposition of organic matter that has built up over many years under colder temperatures. Warmer temperature in Arctic and subarctic ecosystems has created longer growing seasons, stimulating plant growth, resulting in increasing carbon emissions. It is expected that carbon emissions will eventually exceed that of storage and encouraging further warming.
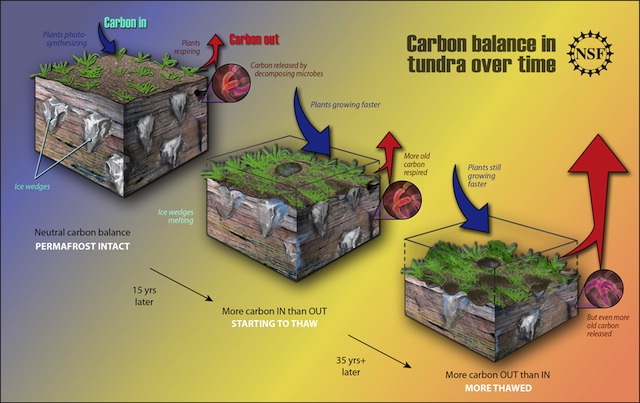
Figure \(\PageIndex{4}\) is an infographic titled “Carbon balance in tundra over time.” It illustrates how thawing permafrost changes the tundra from a system that stores carbon to one that releases carbon to the atmosphere.
The diagram contains three cross-sectional views of tundra soil arranged from left to right, representing a timeline.
Stage 1: “PERMAFROST INTACT”
The left panel shows frozen tundra with vegetation growing on the surface.
Labels include:
- “Carbon in”
- “Plants photosynthesizing”
- “Plants respiring”
- “Carbon out”
- “Carbon released by decomposing microbes”
- “Ice wedges”
- “Neutral carbon balance”
- “PERMAFROST INTACT”
Blue arrows indicate carbon entering the ecosystem through plant growth. Red arrows indicate carbon leaving through respiration and decomposition. Carbon inputs and outputs are balanced.
Stage 2: “STARTING TO THAW”
An arrow labeled “15 yrs later” points to the middle panel.
Labels include:
- “Ice wedge melting”
- “Plants growing faster”
- “More carbon IN than OUT”
- “STARTING TO THAW”
The illustration shows partially thawed permafrost and a larger blue arrow, indicating increased plant growth and carbon uptake.
Stage 3: “MORE THAWED”
Another arrow labeled “35 yrs+ later” points to the right panel.
Labels include:
- “Plants still growing faster”
- “More old carbon respired”
- “But even more old carbon released”
- “More carbon OUT than IN”
- “MORE THAWED”
A very large red arrow rises from the panel, representing increased carbon emissions from thawed organic matter stored in permafrost.
Geographic Distribution
The tundra climate is found as a nearly unbroken ribbon of land on the Arctic ocean border lands of North America and Eurasia, and along the margins of Greenland. Though nearly exclusive to the Northern Hemisphere, it can be found on peninsular land of Antarctica.
Controlling Factors
The tundra climate is directly tied to its location in high latitudes. Here, the subsidence and divergence of the polar anticyclone is an important control over the climate. The subsidence associated with high pressure decreases the chances for precipitation. Located at such a high latitude creates low temperatures that reduces moisture content of the air. Arctic front cyclones bring moisture bearing winds to the tundra climate.
Temperature
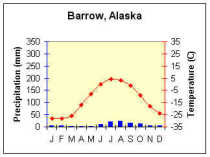
Being a polar or high latitude climate, the tundra is noted for its low temperature. The tundra is basically summer-less, having no monthly temperature averaging above 10oC, and having at least nine months below freezing. These temperatures preclude the growth of trees. Even though temperature ranges are high, they aren't as large as the Subarctic climate to the south. The smaller temperature ranges are due to the moderating influence of the ocean. This coastal pattern is evident in the climograph for Barrow, Alaska (Figure \(\PageIndex{5}\)), where summer temperatures are held down near freezing and the winter cold is slightly buffered by the Arctic Ocean. Diurnal temperature ranges tend to be small because of the uniformly high insolation during the summer and uniformly low insolation during the winter. The seasonal lag in temperature is delayed by a month for the tundra found in eastern North America and western Eurasia due to the influence of the ocean. Here the warmest month is August but it is July for the remaining tundra climate. Similarly the coldest month is also delayed until March for much of coastal western Siberia, though eastern Siberia experiences its coldest temperatures in February.
Precipitation
The very cold temperature creates absolute humidities that are lower than those found in the tropical desert. As a result, precipitation is characteristically light, usually less than 250 mm (10 in) a year. However, eastern and western reaches in North America and Eurasia have nearly double this amount due to the influence of the ocean. For instance, Nome, AK receives 18.4 inches a year while Point Barrow receives only 508 mm (4.3 in). The Point Barrow climograph (Figure \(\PageIndex{5}\)) beautifully illustrates this extreme aridity, showing meager monthly precipitation bars that stay under an inch all year.Precipitation is concentrated in the summer months with July receiving the most precipitation for inland stations and August for most coastal stations. Some marine stations in Norway receive most of their precipitation during the winter months of February and March. Coastal locations are susceptible to fogs as maritime air drifts onshore and is chilled to its dew point by the cold land surface.