

4.5.1: The Equator to the Subtropics
- Page ID
- 40052

\( \newcommand{\vecs}[1]{\overset { \scriptstyle \rightharpoonup} {\mathbf{#1}} } \)
\( \newcommand{\vecd}[1]{\overset{-\!-\!\rightharpoonup}{\vphantom{a}\smash {#1}}} \)
\( \newcommand{\dsum}{\displaystyle\sum\limits} \)
\( \newcommand{\dint}{\displaystyle\int\limits} \)
\( \newcommand{\dlim}{\displaystyle\lim\limits} \)
\( \newcommand{\id}{\mathrm{id}}\) \( \newcommand{\Span}{\mathrm{span}}\)
( \newcommand{\kernel}{\mathrm{null}\,}\) \( \newcommand{\range}{\mathrm{range}\,}\)
\( \newcommand{\RealPart}{\mathrm{Re}}\) \( \newcommand{\ImaginaryPart}{\mathrm{Im}}\)
\( \newcommand{\Argument}{\mathrm{Arg}}\) \( \newcommand{\norm}[1]{\| #1 \|}\)
\( \newcommand{\inner}[2]{\langle #1, #2 \rangle}\)
\( \newcommand{\Span}{\mathrm{span}}\)
\( \newcommand{\id}{\mathrm{id}}\)
\( \newcommand{\Span}{\mathrm{span}}\)
\( \newcommand{\kernel}{\mathrm{null}\,}\)
\( \newcommand{\range}{\mathrm{range}\,}\)
\( \newcommand{\RealPart}{\mathrm{Re}}\)
\( \newcommand{\ImaginaryPart}{\mathrm{Im}}\)
\( \newcommand{\Argument}{\mathrm{Arg}}\)
\( \newcommand{\norm}[1]{\| #1 \|}\)
\( \newcommand{\inner}[2]{\langle #1, #2 \rangle}\)
\( \newcommand{\Span}{\mathrm{span}}\) \( \newcommand{\AA}{\unicode[.8,0]{x212B}}\)
\( \newcommand{\vectorA}[1]{\vec{#1}} % arrow\)
\( \newcommand{\vectorAt}[1]{\vec{\text{#1}}} % arrow\)
\( \newcommand{\vectorB}[1]{\overset { \scriptstyle \rightharpoonup} {\mathbf{#1}} } \)
\( \newcommand{\vectorC}[1]{\textbf{#1}} \)
\( \newcommand{\vectorD}[1]{\overrightarrow{#1}} \)
\( \newcommand{\vectorDt}[1]{\overrightarrow{\text{#1}}} \)
\( \newcommand{\vectE}[1]{\overset{-\!-\!\rightharpoonup}{\vphantom{a}\smash{\mathbf {#1}}}} \)
\( \newcommand{\vecs}[1]{\overset { \scriptstyle \rightharpoonup} {\mathbf{#1}} } \)
\(\newcommand{\longvect}{\overrightarrow}\)
\( \newcommand{\vecd}[1]{\overset{-\!-\!\rightharpoonup}{\vphantom{a}\smash {#1}}} \)
\(\newcommand{\ket}[1]{\left| #1 \right>}\)
\(\newcommand{\bra}[1]{\left< #1 \right|}\)
\(\newcommand{\braket}[2]{\left< #1 \vphantom{#2} \right| \left. #2 \vphantom{#1} \right>}\)
\(\newcommand{\braopket}[3]{\left< #1 \vphantom{#2}\vphantom{#3} \right| #2 \vphantom{#1}\vphantom{#3} \left| #3 \vphantom{#1}\vphantom{#2} \right>}\)
\(\newcommand{\qmvec}[1]{\mathbf{\vec{#1}}}\)
\(\newcommand{\op}[1]{\hat{\mathbf{#1}}}\)
\(\newcommand{\expect}[1]{\langle #1 \rangle}\)
\(\newcommand{\dfn}[1]{\emph{\textbf{#1}}}\)
Latitudinal Patterns of Precipitation
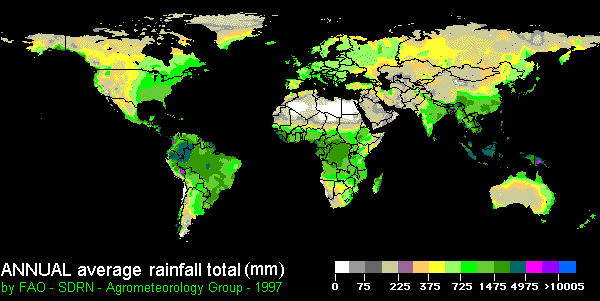
In general, precipitation decreases poleward away from the equator as one moves toward the subtropical regions. The largest annual precipitation totals straddle the equator while the driest regions on Earth lie near the Tropic of Cancer. In addition, precipitation becomes more seasonal as one moves away from the Equator. This is primarily due to the shifting locations of global wind and pressure systems.

Climates straddling the equator experience some of the highest annual precipitation amounts of all climates on Earth. This is depicted by the blue bar graph in the climograph for Iquitos, Peru located at 3oS . Figure \(\PageIndex{1}\) shows consistently high rainfall, with every month receiving over 150 mm. The temperature remains remarkably stable, hovering around 25°C to 27°C year-round. This is typical of the Intertropical Convergence Zone (ITCZ) where moisture and heat are constant. Here the year 'round high sun heats the Earth and sets off convective thunderstorms in the warm, moist, and unstable equatorial air. Here too is found the Intertropical Convergence Zone (ITCZ). The ITCZ is the region where tradewinds originating in the semi-permanent subtropical highs converge causing air to rise. The combination of convergence and convection lifts the air causing it to adiabatically cool, ultimately condensing the moisture into clouds and promoting precipitation. Iquitos, like many places located near the equator, receives over 2800 mm (100 in) of precipitation a year.
Moving poleward, precipitation becomes more seasonal. In the tropics (10o - 23.5o) the maximum amount of precipitation falls during the high sun (summer) season. During the summer, the ITCZ shifts poleward bringing precipitation with it. As the Sun's most intense rays shift equatorward during the low sun season, the ITCZ moves out of the region and a dry season sets in. The length and intensity of the dry season tends to increase toward the poleward limits of the tropics.

In Figure \(\PageIndex{3}\), the temperature line shows a dramatic peak in the summer months, reaching approximately 35°C. This illustrates the influence of the Subtropical High, where sinking air prevents cloud formation and rain. Depending on location, the subtropics (23.5o- 35o) can be very dry or wet. The equatorward side of the subtropics tends to be quite dry. As one moves poleward the amount of precipitation increases though has a seasonal character. Within the continental interior of Africa at about 23.5o N the great Sahara Desert can be found. These conditions are represented in the climograph for Tindouf, Algeria. Tindouf has a meager amount of precipitation for the year that averages 43.8 mm (1.74 in) over the course of a year. The extremely dry conditions are a result of being dominated by the subsiding conditions in the subtropical high.
But when you move to the poleward limits of the subtropics, especially on the east coast of a continent, annual precipitation increases. The increase in precipitation in these regions is due to the presence of moist Maritime Tropical Unstable air masses that blow onshore. As they come on shore, convection lifts the air to promote cooling, condensation, and precipitation. In addition, the poleward limits of the subtropics border the midlatitudes where polar front cyclones produce precipitation.