

4.4.3: Precipitation Process
- Page ID
- 40050

\( \newcommand{\vecs}[1]{\overset { \scriptstyle \rightharpoonup} {\mathbf{#1}} } \)
\( \newcommand{\vecd}[1]{\overset{-\!-\!\rightharpoonup}{\vphantom{a}\smash {#1}}} \)
\( \newcommand{\dsum}{\displaystyle\sum\limits} \)
\( \newcommand{\dint}{\displaystyle\int\limits} \)
\( \newcommand{\dlim}{\displaystyle\lim\limits} \)
\( \newcommand{\id}{\mathrm{id}}\) \( \newcommand{\Span}{\mathrm{span}}\)
( \newcommand{\kernel}{\mathrm{null}\,}\) \( \newcommand{\range}{\mathrm{range}\,}\)
\( \newcommand{\RealPart}{\mathrm{Re}}\) \( \newcommand{\ImaginaryPart}{\mathrm{Im}}\)
\( \newcommand{\Argument}{\mathrm{Arg}}\) \( \newcommand{\norm}[1]{\| #1 \|}\)
\( \newcommand{\inner}[2]{\langle #1, #2 \rangle}\)
\( \newcommand{\Span}{\mathrm{span}}\)
\( \newcommand{\id}{\mathrm{id}}\)
\( \newcommand{\Span}{\mathrm{span}}\)
\( \newcommand{\kernel}{\mathrm{null}\,}\)
\( \newcommand{\range}{\mathrm{range}\,}\)
\( \newcommand{\RealPart}{\mathrm{Re}}\)
\( \newcommand{\ImaginaryPart}{\mathrm{Im}}\)
\( \newcommand{\Argument}{\mathrm{Arg}}\)
\( \newcommand{\norm}[1]{\| #1 \|}\)
\( \newcommand{\inner}[2]{\langle #1, #2 \rangle}\)
\( \newcommand{\Span}{\mathrm{span}}\) \( \newcommand{\AA}{\unicode[.8,0]{x212B}}\)
\( \newcommand{\vectorA}[1]{\vec{#1}} % arrow\)
\( \newcommand{\vectorAt}[1]{\vec{\text{#1}}} % arrow\)
\( \newcommand{\vectorB}[1]{\overset { \scriptstyle \rightharpoonup} {\mathbf{#1}} } \)
\( \newcommand{\vectorC}[1]{\textbf{#1}} \)
\( \newcommand{\vectorD}[1]{\overrightarrow{#1}} \)
\( \newcommand{\vectorDt}[1]{\overrightarrow{\text{#1}}} \)
\( \newcommand{\vectE}[1]{\overset{-\!-\!\rightharpoonup}{\vphantom{a}\smash{\mathbf {#1}}}} \)
\( \newcommand{\vecs}[1]{\overset { \scriptstyle \rightharpoonup} {\mathbf{#1}} } \)
\(\newcommand{\longvect}{\overrightarrow}\)
\( \newcommand{\vecd}[1]{\overset{-\!-\!\rightharpoonup}{\vphantom{a}\smash {#1}}} \)
\(\newcommand{\ket}[1]{\left| #1 \right>}\)
\(\newcommand{\bra}[1]{\left< #1 \right|}\)
\(\newcommand{\braket}[2]{\left< #1 \vphantom{#2} \right| \left. #2 \vphantom{#1} \right>}\)
\(\newcommand{\braopket}[3]{\left< #1 \vphantom{#2}\vphantom{#3} \right| #2 \vphantom{#1}\vphantom{#3} \left| #3 \vphantom{#1}\vphantom{#2} \right>}\)
\(\newcommand{\qmvec}[1]{\mathbf{\vec{#1}}}\)
\(\newcommand{\op}[1]{\hat{\mathbf{#1}}}\)
\(\newcommand{\expect}[1]{\langle #1 \rangle}\)
\(\newcommand{\dfn}[1]{\emph{\textbf{#1}}}\)
Collision - Coalescence
The word precipitation in chemistry refers to material falling out of suspension. The same definition can be applied when studying weather. Precipitation from a meteorological stand point is water in some form, falling out of the air, and settling on the surface of the earth. This allows us to distinguish between forms of condensation in the atmosphere and condensation that occurs at the surface. Dew is condensation at the surface and thus is not a form of precipitation. Rain, snow, hail, sleet, freezing rain are all forms of precipitation. Meteorologists have developed two models of precipitation formation. They are the collision-coalescence and ice crystal models. An important distinction between the two processes is the temperature of the cloud. Warm clouds are ones whose mass lies above the freezing level while cold clouds primarily exist where the temperature is below freezing.
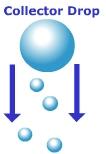
Figure \(\PageIndex{1}\) is a simple diagram labeled Collector Drop.
At the top is a large water droplet. Below it are several smaller droplets arranged along the path beneath it. Two downward-pointing arrows beside the large droplet show that it is moving downward.
The diagram shows that the large droplet falls through the air and passes through the smaller droplets below it. As it falls, it can collide with and collect those smaller droplets.
Overall, the diagram illustrates collision and collection in precipitation formation. A larger droplet falls faster than smaller droplets, collides with them, and combines with them, causing the larger droplet to grow.
The collision-coalescence model applies to warm clouds that form in the tropics. Warm clouds are those that form at altitudes where the air temperature is above freezing. For precipitation to form under this model, there needs to be a variety of different size condensation nuclei. Large condensation nuclei will create large water droplets while smaller condensation nuclei create small ones. In order for the droplets to make their way to the surface they have to be heavy enough to overcome the resistance imposed by upwardly rising air that is fueling the development of the cloud. The smaller, lighter droplets are easily suspended in the updrafts of air, while the larger heavy collector droplets fall and collide with the smaller ones. Upon collision, the droplets coalesce into a bigger droplet. As the droplet falls, resistance by the air flattens the droplet to the point where it becomes unstable and breaks apart. With enough collisions, the droplet achieves a size sufficient to fall all the way to the surface.
Ice – crystal model
The ice-crystal model, or Bergeron process, is the process of precipitation formation in the middle and high latitudes. Here, clouds form at altitudes where the temperatures are below the freezing point of water. In these clouds, water exists in its liquid form even though the temperatures are cold enough to freeze water. Water that has a temperature below freezing but is still in a liquid state is called "super-cooled water". Water in extremely small amounts such as cloud droplets can exist in such a state. Ice crystals are found co-existing with the super-cooled water in cold clouds. When this occurs, the ice crystals will grow at the expense of the water droplets. Why? Examine the saturation curve in Figure \(\PageIndex{2}\). It shows that at temperatures below freezing the saturation vapor pressure of ice is less than that over a droplet of water. This means that a water vapor gradient exists between the droplet and the ice. Water can evaporate off the droplet and deposit on the ice in response to the water vapor gradient. The droplet will dissipate in size while the ice crystal grows into a snow flake. Once the snow flake is large enough, it will fall to the surface. Thus, precipitation that falls in the middle and high latitudes starts out as snow. Whether it hits the surface as snow or rain depends on the temperature conditions through which the snowflake falls.
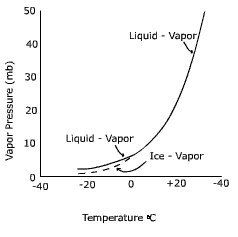
Figure \(\PageIndex{2}\) is a graph showing how vapor pressure varies with temperature for water in different phase conditions.
Overall layout:
- The horizontal axis is labeled Temperature (°C) and ranges from about −40°C on the left to +40°C on the right.
- The vertical axis is labeled Vapor Pressure (mb) (millibars) and ranges from 0 at the bottom to about 50 at the top.
- Three labeled curves are shown:
- Liquid–vapor curve (main curve)
- A second liquid–vapor curve at lower temperatures (metastable condition)
- Ice–vapor curve
Curves and patterns:
Liquid–vapor curve (main):
- This curve begins at lower vapor pressure values at colder temperatures and rises sharply as temperature increases.
- The curve reaches high vapor pressure values at warmer temperatures.
- This shows that vapor pressure over liquid water increases rapidly with temperature.
Ice–vapor curve:
- This curve lies below the liquid–vapor curve at the same temperatures.
- It shows lower vapor pressure values across the temperature range.
- This indicates that ice has a lower vapor pressure than liquid water, meaning fewer water molecules escape into the air from ice compared to liquid water at the same temperature.
Metastable liquid–vapor curve (dashed):
- A dashed or secondary curve appears slightly below the main liquid–vapor curve at colder temperatures.
- This represents supercooled liquid water, which behaves differently than normal liquid water.
Relationships:
- At temperatures below freezing (0°C), both ice and liquid curves are present, showing differences in vapor pressure between phases.
- The gap between the liquid–vapor and ice–vapor curves indicates that water vapor pressure depends on whether the surface is liquid or solid.
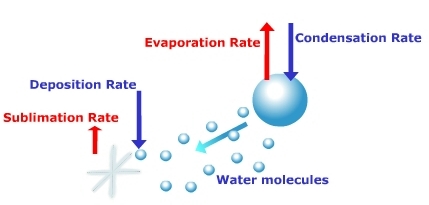
Figure \(\PageIndex{3}\) illustrates the Bergeron Process, or the ice-crystal model, which explains how precipitation forms in middle and high latitude clouds where temperatures are below freezing. In these cold clouds, liquid water droplets—often in a super-cooled state—coexist with ice crystals. Because the saturation vapor pressure over ice is lower than it is over liquid water, a water vapor gradient is created, causing water molecules to evaporate from the droplet and deposit directly onto the ice crystal. This visual highlights that the Deposition Rate onto the crystal exceeds its Sublimation Rate, while the droplet loses mass through a high Evaporation Rate. As a result, the ice crystal grows into a snowflake at the expense of the shrinking water droplet until it becomes heavy enough to fall toward the surface.
Forms of precipitation
There are a variety of different types of precipitation but we’ll only treat four of the more common ones here. The kind of precipitation received depends on the variation of temperature above the surface. Rain is precipitation in liquid form. Snow is precipitation in solid form as (typically) a hexagonal crystal shape. Size and shape of the crystal is dependent on moisture content and temperature of the air. Recall that in the middle and high latitudes rain begins as snow. If the air temperature near the surface is above freezing, the snow will melt into rain and fall in liquid form. If the air temperatures are below freezing on its journey toward the surface, precipitation will be in the form of snow. Sleet occurs when snow falls through a warm layer of air and melts. Before reaching the ground, the precipitation passes through a cold layer of air causing the water to refreeze and fall as sleet. Freezing rain occurs when snow melts upon passing through a warm layer of air and then freezes on the surface whose temperature is at or below freezing. Significant amounts of freezing rain coats the surface with a glaze of ice making roadways treacherous and toppling trees and downing power lines. Hail falls as rounded pellets or balls of ice from severe thunderstorms. Vertical motions up-and-down through the storm create concentric rings of ice around the hail stone.
