

4.3: Adiabatic Temperature Change and Stability
- Page ID
- 40046

\( \newcommand{\vecs}[1]{\overset { \scriptstyle \rightharpoonup} {\mathbf{#1}} } \)
\( \newcommand{\vecd}[1]{\overset{-\!-\!\rightharpoonup}{\vphantom{a}\smash {#1}}} \)
\( \newcommand{\dsum}{\displaystyle\sum\limits} \)
\( \newcommand{\dint}{\displaystyle\int\limits} \)
\( \newcommand{\dlim}{\displaystyle\lim\limits} \)
\( \newcommand{\id}{\mathrm{id}}\) \( \newcommand{\Span}{\mathrm{span}}\)
( \newcommand{\kernel}{\mathrm{null}\,}\) \( \newcommand{\range}{\mathrm{range}\,}\)
\( \newcommand{\RealPart}{\mathrm{Re}}\) \( \newcommand{\ImaginaryPart}{\mathrm{Im}}\)
\( \newcommand{\Argument}{\mathrm{Arg}}\) \( \newcommand{\norm}[1]{\| #1 \|}\)
\( \newcommand{\inner}[2]{\langle #1, #2 \rangle}\)
\( \newcommand{\Span}{\mathrm{span}}\)
\( \newcommand{\id}{\mathrm{id}}\)
\( \newcommand{\Span}{\mathrm{span}}\)
\( \newcommand{\kernel}{\mathrm{null}\,}\)
\( \newcommand{\range}{\mathrm{range}\,}\)
\( \newcommand{\RealPart}{\mathrm{Re}}\)
\( \newcommand{\ImaginaryPart}{\mathrm{Im}}\)
\( \newcommand{\Argument}{\mathrm{Arg}}\)
\( \newcommand{\norm}[1]{\| #1 \|}\)
\( \newcommand{\inner}[2]{\langle #1, #2 \rangle}\)
\( \newcommand{\Span}{\mathrm{span}}\) \( \newcommand{\AA}{\unicode[.8,0]{x212B}}\)
\( \newcommand{\vectorA}[1]{\vec{#1}} % arrow\)
\( \newcommand{\vectorAt}[1]{\vec{\text{#1}}} % arrow\)
\( \newcommand{\vectorB}[1]{\overset { \scriptstyle \rightharpoonup} {\mathbf{#1}} } \)
\( \newcommand{\vectorC}[1]{\textbf{#1}} \)
\( \newcommand{\vectorD}[1]{\overrightarrow{#1}} \)
\( \newcommand{\vectorDt}[1]{\overrightarrow{\text{#1}}} \)
\( \newcommand{\vectE}[1]{\overset{-\!-\!\rightharpoonup}{\vphantom{a}\smash{\mathbf {#1}}}} \)
\( \newcommand{\vecs}[1]{\overset { \scriptstyle \rightharpoonup} {\mathbf{#1}} } \)
\(\newcommand{\longvect}{\overrightarrow}\)
\( \newcommand{\vecd}[1]{\overset{-\!-\!\rightharpoonup}{\vphantom{a}\smash {#1}}} \)
\(\newcommand{\ket}[1]{\left| #1 \right>}\)
\(\newcommand{\bra}[1]{\left< #1 \right|}\)
\(\newcommand{\braket}[2]{\left< #1 \vphantom{#2} \right| \left. #2 \vphantom{#1} \right>}\)
\(\newcommand{\braopket}[3]{\left< #1 \vphantom{#2}\vphantom{#3} \right| #2 \vphantom{#1}\vphantom{#3} \left| #3 \vphantom{#1}\vphantom{#2} \right>}\)
\(\newcommand{\qmvec}[1]{\mathbf{\vec{#1}}}\)
\(\newcommand{\op}[1]{\hat{\mathbf{#1}}}\)
\(\newcommand{\expect}[1]{\langle #1 \rangle}\)
\(\newcommand{\dfn}[1]{\emph{\textbf{#1}}}\)
How Air Temperature Changes with Elevation
In "The Atmosphere" we discovered that air temperature usually decreases with an increase in elevation through the troposphere. The decrease in temperature with elevation is called the environmental lapse rate of temperature or normal lapse rate of temperature. Recall that the normal lapse rate of temperature is the average lapse rate of temperature of .65o C / 100 meters. The environmental lapse rate of temperature is the actual vertical change in temperature on any given day and can be greater or less than .65o C / 100 meters. Also recall that the decrease in temperature with height is caused by increasing distance from the source of energy that heats the air, the Earth's surface. Air is warmer near the surface because it's closer to its source of heat. The further away from the surface, the cooler the air will be. It's like standing next to a fire, the closer you are the warmer you'll feel. Temperature change caused by an exchange of heat between two bodies is called diabatic temperature change. There is another very important way to change the temperature of air called adiabatic temperature change.
Adiabatic temperature change of air occurs without the addition or removal of energy. That is, there is no exchange of heat with the surrounding environment to cause the cooling or heating of the air. The temperature change is due to work done on a parcel of air by the external environment, or work done by a parcel of air on the air that surrounds it. What kind of work can be done? The work that is done is the expansion or compression of air.
Imagine an isolated parcel of air that is moving vertically through the troposphere. We know that air pressure decreases with increasing elevation. As the parcel of air moves upward the pressure exerted on the parcel decreases and the parcel expands in volume as a result. In order to expand (i.e.. do work), the parcel must use its internal energy to do so. As the air expands, the molecules spread out and ultimately collide less with one another. The work of expansion causes the air's temperature to decrease. You might have had personal experience with this kind of cooling if you've let the air out of an automobile or bicycle tire. Air inside the tire is under a great deal of pressure, and as it rushes outside it moves into a lower pressure environment. In so doing, the parcel quickly expands against the outside environment air. By placing your hand in front of the valve stem, you can feel the air cool as it expands. This is called adiabatic cooling.
As air descends through the troposphere it experiences increasing atmospheric pressure. This causes the parcel volume to decrease in size, squeezing the air molecules closer together. In this case, work is being done on the parcel. As the volume shrinks, air molecules bounce off one another more often, ricocheting with greater speed. The increase in molecular movement causes an increase in the temperature of the parcel. This process is referred to as adiabatic warming.
The rate at which air cools or warms depends on the moisture status of the air. If the air is dry, the rate of temperature change is 1oC/100 meters and is called the dry adiabatic rate (DAR). If the air is saturated, the rate of temperature change is .6oC/100 meters and is called the saturated adiabatic rate (SAR). The DAR is a constant value, that is, it's always 1oC/100 meters. The SAR varies somewhat with how much moisture is in the air, but we'll assume it to be a constant value here. The reason for the difference in the two rates is due to the liberation of latent heat as a result of condensation. As saturated air rises and cools, condensation takes place. Recall that as water vapor condenses, latent heat is released. This heat is transferred into the other molecules of air inside the parcel causing a reduction in the rate of cooling.
Stability of Air
Adiabatic temperature change is an important factor in determining the stability of the air. We can think of air stability as the tendency for air to rise or fall through the atmosphere under its own "power". Stable air has a tendency to resist movement. On the other hand, unstable air will easily rise. What gives air "power" to rise? The tendency for air to rise or fall depends on the adiabatic and environmental lapse rates.
Stable air
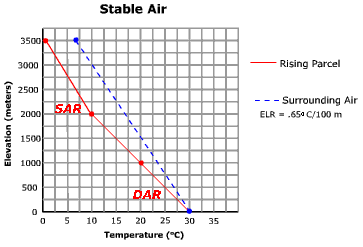
Figure \(\PageIndex{1}\) illustrates stable atmospheric conditions by comparing the temperature of a rising dry air parcel with the temperature of the surrounding air.
The horizontal axis shows temperature in degrees Celsius. The vertical axis shows elevation in meters, increasing from the surface to about 3500 meters.
A blue line represents the environmental lapse rate, labeled ELR = 0.65°C per 100 m. This line shows how the surrounding atmosphere cools with increasing height on a given day.
A red line represents the dry adiabatic rate, labeled DAR = 1°C per 100 m. This line shows how a dry parcel of air cools as it rises and expands.
The red line slopes left more steeply than the blue line. As elevation increases, the red line remains at lower temperatures than the blue line. This means the rising parcel becomes colder than the surrounding environment at all heights above the surface.
Because the parcel is colder, it is also denser than the surrounding air. Denser air tends to sink rather than continue rising. This indicates that the atmosphere is stable, meaning vertical motion is suppressed.
Overall, the graph shows that when the environmental lapse rate is smaller than the dry adiabatic rate, a rising dry air parcel cools faster than the surrounding air and loses buoyancy.
Stable atmospheric conditions prevail when the environmental lapse rate is less than the saturated adiabatic rate. An example of this condition is shown in Figure \(\PageIndex{1}\). At the surface (0 meters) both the parcel of air (red line) and the air of the surrounding environment (blue line) have the same temperature. The surrounding air is changing its temperature at a rate of .65oC/100 meters. The parcel on this day is "dry" and will rise and cool at a temperature of 1oC/100 meters. After giving the parcel a slight upward push, it rises to a level of 1000 meters where it cools to a temperature of 20oC. A measurement of the air surrounding the parcel shows a temperature of 23.5oC. In other words, the parcel is colder (and more dense) than the surrounding air at 1000 meters. If the uplift mechanism ceased, the parcel of air would return to the surface.
Unstable air
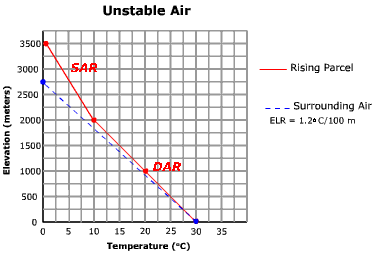
Air is unstable when the environmental lapse rate is greater than the dry adiabatic rate. Under these conditions, a rising parcel of air is warmer and less dense than the air surrounding it at any given elevation. Figure \(\PageIndex{2}\) depicts unstable conditions. Follow up the graph for the rising parcel of air. Note that at any elevation above the surface the parcel temperature is higher than the air that surrounds it. Even as it reaches the dew point temperature at 2000 meters, the air remains warmer than the surrounding air. As a result it continues to rise and cool at the saturated adiabatic rate. Vertically developed clouds are likely to develop under unstable conditions such as this.
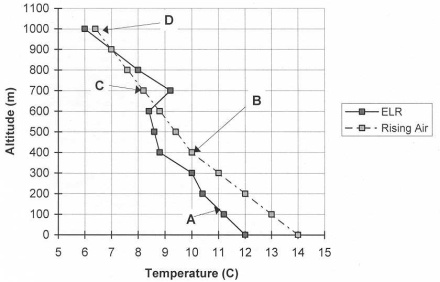
Figure \(\PageIndex{3}\):
This graph shows how atmospheric stability varies with height, determining whether rising air continues upward, remains neutral, or sinks back downward. (CC BY-SA 4.0; Courtesy Michael Ritter via The Physical Environment).Figure \(\PageIndex{3}\) compares the temperature of a rising air parcel with the environmental lapse rate (ELR) under four conditions labeled A, B, C, and D. The graph shows how parcel buoyancy changes with altitude.
The horizontal axis shows temperature in degrees Celsius, ranging from about 5°C to 15°C. The vertical axis shows altitude in meters, increasing from 0 to about 1100 meters.
Two lines are plotted. One line is labeled ELR and represents the temperature of the surrounding environment. The other line is labeled Rising Air and represents the temperature of the air parcel as it rises.
At Condition A, near the surface, the rising air parcel is warmer than the surrounding air. Because warmer air is less dense, the parcel is buoyant and will continue to rise. This indicates unstable conditions.
At Condition B, the parcel and the surrounding air are at approximately the same temperature. In this case, the parcel has neutral buoyancy and is neither strongly rising nor sinking. This indicates neutral stability.
At Condition C, the parcel is slightly cooler than the surrounding air. Because it is cooler and denser, it has less buoyancy and tends to slow its upward motion or stop rising. This indicates stable conditions.
At Condition D, the parcel is much cooler than the surrounding air. It is denser than the environment and tends to sink back downward, indicating strong stability.
Overall, the graph shows that atmospheric stability depends on whether a rising parcel is warmer, equal in temperature, or cooler than the surrounding air. Warmer parcels rise, equal-temperature parcels are neutral, and cooler parcels resist upward motion or sink.
According to the graph above, the air is absolutely stable at letter A, B, C, or D?
- Answer
-
C