

4.2.3: Humidity
- Page ID
- 40044

\( \newcommand{\vecs}[1]{\overset { \scriptstyle \rightharpoonup} {\mathbf{#1}} } \)
\( \newcommand{\vecd}[1]{\overset{-\!-\!\rightharpoonup}{\vphantom{a}\smash {#1}}} \)
\( \newcommand{\dsum}{\displaystyle\sum\limits} \)
\( \newcommand{\dint}{\displaystyle\int\limits} \)
\( \newcommand{\dlim}{\displaystyle\lim\limits} \)
\( \newcommand{\id}{\mathrm{id}}\) \( \newcommand{\Span}{\mathrm{span}}\)
( \newcommand{\kernel}{\mathrm{null}\,}\) \( \newcommand{\range}{\mathrm{range}\,}\)
\( \newcommand{\RealPart}{\mathrm{Re}}\) \( \newcommand{\ImaginaryPart}{\mathrm{Im}}\)
\( \newcommand{\Argument}{\mathrm{Arg}}\) \( \newcommand{\norm}[1]{\| #1 \|}\)
\( \newcommand{\inner}[2]{\langle #1, #2 \rangle}\)
\( \newcommand{\Span}{\mathrm{span}}\)
\( \newcommand{\id}{\mathrm{id}}\)
\( \newcommand{\Span}{\mathrm{span}}\)
\( \newcommand{\kernel}{\mathrm{null}\,}\)
\( \newcommand{\range}{\mathrm{range}\,}\)
\( \newcommand{\RealPart}{\mathrm{Re}}\)
\( \newcommand{\ImaginaryPart}{\mathrm{Im}}\)
\( \newcommand{\Argument}{\mathrm{Arg}}\)
\( \newcommand{\norm}[1]{\| #1 \|}\)
\( \newcommand{\inner}[2]{\langle #1, #2 \rangle}\)
\( \newcommand{\Span}{\mathrm{span}}\) \( \newcommand{\AA}{\unicode[.8,0]{x212B}}\)
\( \newcommand{\vectorA}[1]{\vec{#1}} % arrow\)
\( \newcommand{\vectorAt}[1]{\vec{\text{#1}}} % arrow\)
\( \newcommand{\vectorB}[1]{\overset { \scriptstyle \rightharpoonup} {\mathbf{#1}} } \)
\( \newcommand{\vectorC}[1]{\textbf{#1}} \)
\( \newcommand{\vectorD}[1]{\overrightarrow{#1}} \)
\( \newcommand{\vectorDt}[1]{\overrightarrow{\text{#1}}} \)
\( \newcommand{\vectE}[1]{\overset{-\!-\!\rightharpoonup}{\vphantom{a}\smash{\mathbf {#1}}}} \)
\( \newcommand{\vecs}[1]{\overset { \scriptstyle \rightharpoonup} {\mathbf{#1}} } \)
\(\newcommand{\longvect}{\overrightarrow}\)
\( \newcommand{\vecd}[1]{\overset{-\!-\!\rightharpoonup}{\vphantom{a}\smash {#1}}} \)
\(\newcommand{\ket}[1]{\left| #1 \right>}\)
\(\newcommand{\bra}[1]{\left< #1 \right|}\)
\(\newcommand{\braket}[2]{\left< #1 \vphantom{#2} \right| \left. #2 \vphantom{#1} \right>}\)
\(\newcommand{\braopket}[3]{\left< #1 \vphantom{#2}\vphantom{#3} \right| #2 \vphantom{#1}\vphantom{#3} \left| #3 \vphantom{#1}\vphantom{#2} \right>}\)
\(\newcommand{\qmvec}[1]{\mathbf{\vec{#1}}}\)
\(\newcommand{\op}[1]{\hat{\mathbf{#1}}}\)
\(\newcommand{\expect}[1]{\langle #1 \rangle}\)
\(\newcommand{\dfn}[1]{\emph{\textbf{#1}}}\)
Absolute Humidity
It is a measure of the water vapor content of the air. The amount of water vapor in the air depends on the controls over evaporation discussed earlier. There are several ways in which a meteorologist can express the humidity of the air. Each humidity measure is controlled to some degree by air temperature.
Absolute humidity is the weight of water vapor per unit volume of air, usually measured in units of grams of water vapor per cubic meter of air. Absolute humidity is not often used to express the moisture content of air because it is sensitive to changes in both the temperature of the air and atmospheric pressure. For instance, let's say that a 1 cubic meter parcel of air at the surface has 2 grams of water in it. Now lift the parcel of air upwards into the atmosphere. As the air rises upward the decrease in atmospheric pressure on the parcel allows it to expand outward occupying more space. Let's say that the parcel doubles in size as a result of uplift. Before rising, the absolute humidity was 2 gm/m3. As the air doubles in volume the new absolute humidity is 1 gm/m3. In actuality the parcel still has the same weight of water in it, 2 grams. But given the way absolute humidity is calculated it appears the amount of water in the air has decreased.
Specific Humidity
Instead of absolute humidity, we use a measure that is not sensitive to volume changes in the air. Specific humidity is measured as the weight of water vapor in the air per unit weight of air, which includes the weight of water vapor. The units of measurement are grams of water vapor per kilogram of air. Given that weight is not significantly influenced by temperature or atmospheric pressure, specific humidity is much more useful as a measure of humidity.
Mixing Ratio
Another measure very similar to specific humidity is the mixing ratio. The mixing ratio is the weight of water vapor per unit weight of dry air. Because the atmosphere is made up of so little moisture by volume, the mixing ratio is virtually the same as the specific humidity.
Vapor Pressure
Humidity is not only measured as a weight, but also by the pressure it creates. Vapor pressure is the partial pressure created by water vapor. Vapor pressure, like atmospheric pressure, is measured in millibars and is relatively insensitive to volumetric expansion or temperature. The saturation vapor pressure is simply the pressure that water vapor creates when the air is fully saturated.
Saturation
When we think of air as being saturated with moisture we often say that the air is "holding all the moisture it can". This implies that once the air has reached saturation it won't "accept" anymore water by evaporation. This is wrong. So long as there is water available evaporation will continue even when the air is fully saturated. Let's examine the concept of saturation in more detail.
Imagine a beaker filled halfway with water. Let's put a top on it to constrain the movement of water molecules and eliminate the influence of wind on evaporation. As the water absorbs heat it begins to change phase and enter the air as water vapor. Above the surface, water vapor molecules dart about suspended in the air. However, near the surface water molecules are attaching themselves back the surface, thus changing back into liquid water (condensation) (A). As evaporation occurs the water level in the beaker decreases (B). This occurs because evaporation exceeds condensation of water back onto the surface. After some time, the amount of water entering the air from evaporation is equal to that condensing (C). When this occurs the air is said to be saturated.
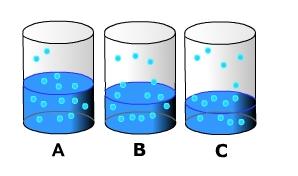
Figure \(\PageIndex{1}\) compares three containers labeled A, B, and C. Each container holds liquid water at the bottom and shows water molecules above the surface in the air. The figure illustrates how evaporation changes under different conditions in the air above the water.
In Container A, many water molecules are shown moving between the liquid and the air. The air above the surface can still accept additional water vapor, so evaporation is occurring readily. This container represents conditions in which water molecules leave the liquid and enter the air with relatively strong net evaporation.
In Container B, fewer molecules are shown above the water surface, and some molecules are shown returning to the liquid. This indicates that evaporation and condensation are both occurring. The figure suggests a more balanced exchange between water molecules leaving the liquid and returning from the air.
In Container C, a larger number of water molecules are already present in the air above the liquid. Upward movement from the water surface is reduced compared with Container A. This represents air that is near saturation, so net evaporation is lower because the air can accept less additional water vapor.
Overall, the diagram shows that evaporation depends not only on the presence of liquid water but also on conditions in the air above it. As the air becomes more saturated with water vapor, net evaporation decreases and condensation becomes more important.
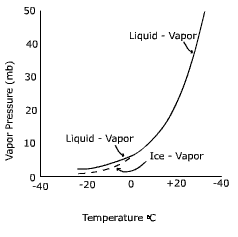
The saturation level of the air is directly related to the air's temperature. As air temperature increases, more water can remain in a gas phase. As temperature decreases, water molecules slow down and there is a greater chance for them to condense on to surfaces. The graph below shows the relationship between air temperature and vapor pressure, a measure of the humidity, at saturation.
(CC BY-SA 4.0; Courtesy Michael E Ritter via The Physical Environment).
Figure \(\PageIndex{2}\) shows how the vapor pressure of water changes with temperature for different phase transitions.
The horizontal axis shows temperature in degrees Celsius, ranging from about −40°C to +20°C. The vertical axis shows vapor pressure in millibars, ranging from 0 to 50 mb.
One curve represents the equilibrium between liquid water and water vapor. This curve begins near 0°C and rises steeply as temperature increases. Vapor pressure increases from about 5 mb near 0°C to more than 40 mb near 20°C. This shows that as liquid water becomes warmer, its equilibrium vapor pressure increases rapidly.
A second curve represents the equilibrium between ice and water vapor, or sublimation. This curve extends across negative temperatures and rises more gradually. Its vapor pressure remains much lower than that of liquid water at the same temperature range near freezing.
The two curves meet near 0°C, where liquid water, ice, and vapor conditions connect at the phase boundary. This indicates that around the freezing point, both melting/freezing processes and evaporation/sublimation relationships are important.
Overall, the graph shows that vapor pressure increases with temperature and that liquid water has a much higher vapor pressure than ice at comparable temperatures near 0°C. This means evaporation from liquid water occurs more readily than sublimation from ice under similar conditions.
Note that below zero degrees Celsius, the curve splits, one for the saturation point above a liquid surface (liquid-vapor) and one for a surface of ice (ice - vapor). The first thing you might be wondering is how water can exist as a liquid below the freezing point. Water that is not frozen below 0o C is called "super-cooled water". For water to freeze, the molecules must become properly aligned to attach to one another. This is less likely to occur, especially with small amounts of water, like cloud droplets. Thus, in clouds where temperatures are below freezing it is common to find both supercooled liquid water and ice crystals.
Notice that the saturation vapor pressure at -20o C is lower for ice than for a liquid surface. Why would this be so? You may recall that converting water from a liquid to a gas requires about 600 calories per gram. To convert water from a solid to a gas requires about 680 calories; it is more difficult to "liberate" a molecule of water from ice than water. Therefore, when the air is saturated, there are more molecules above a water surface (i.e., more vapor pressure) than above an ice surface (i.e. less vapor pressure).
Dew Point Temperature
Dew point temperature is the temperature at which condensation takes place and is used as a measure of moisture content. The dew point temperature depends on the amount of moisture in the air; the more moisture in the air, the higher the dew point temperature. It gets its name "dew point" because dew will form on surfaces when the air reaches saturation.
Relative Humidity
Have you ever noticed that even though it's 100% relative humidity out, it feels a lot drier during the winter than the summer? To see why, we have to examine relative humidity. Relative humidity is the ratio of the amount of water vapor in the air to its saturation point. Often, relative humidity is defined as the amount of water vapor in the air to "how much it can hold" at a given temperature. The notion of a holding capacity is dispelled when one considers what saturation really means. Regardless, what we do know is that the saturation level of the air with respect to water vapor depends on the air's temperature. We know that as air temperature increases, the ability for the air to keep water in its vapor state is easier. That is, as the air temperature increases it can keep more water in the vapor state.
So why does saturated cold air feel drier than warm air at saturation? Let's look at an example.
Continental polar air (cP) has an average temperature of 5o C (41o F). Its saturation mixing ratio is 6 g/kg. So continental air at 100% relative humidity is
RH = 6 g/kg (in the air) / 6 g/kg (saturation)
The average temperature of maritime tropical air (mT) is 22o C (71.6o F) with a saturation mixing ratio of 16 g/kg. So maritime tropical air at 100% relative humidity is
RH = 16 g/kg (in the air) / 16 g/kg (saturation)
Therefore, polar air is drier at 100% relative humidity because it has much less moisture in it at saturation than the warmer maritime tropical air.