

3.2.1: Controls over Air Temperature
- Page ID
- 40034

\( \newcommand{\vecs}[1]{\overset { \scriptstyle \rightharpoonup} {\mathbf{#1}} } \)
\( \newcommand{\vecd}[1]{\overset{-\!-\!\rightharpoonup}{\vphantom{a}\smash {#1}}} \)
\( \newcommand{\dsum}{\displaystyle\sum\limits} \)
\( \newcommand{\dint}{\displaystyle\int\limits} \)
\( \newcommand{\dlim}{\displaystyle\lim\limits} \)
\( \newcommand{\id}{\mathrm{id}}\) \( \newcommand{\Span}{\mathrm{span}}\)
( \newcommand{\kernel}{\mathrm{null}\,}\) \( \newcommand{\range}{\mathrm{range}\,}\)
\( \newcommand{\RealPart}{\mathrm{Re}}\) \( \newcommand{\ImaginaryPart}{\mathrm{Im}}\)
\( \newcommand{\Argument}{\mathrm{Arg}}\) \( \newcommand{\norm}[1]{\| #1 \|}\)
\( \newcommand{\inner}[2]{\langle #1, #2 \rangle}\)
\( \newcommand{\Span}{\mathrm{span}}\)
\( \newcommand{\id}{\mathrm{id}}\)
\( \newcommand{\Span}{\mathrm{span}}\)
\( \newcommand{\kernel}{\mathrm{null}\,}\)
\( \newcommand{\range}{\mathrm{range}\,}\)
\( \newcommand{\RealPart}{\mathrm{Re}}\)
\( \newcommand{\ImaginaryPart}{\mathrm{Im}}\)
\( \newcommand{\Argument}{\mathrm{Arg}}\)
\( \newcommand{\norm}[1]{\| #1 \|}\)
\( \newcommand{\inner}[2]{\langle #1, #2 \rangle}\)
\( \newcommand{\Span}{\mathrm{span}}\) \( \newcommand{\AA}{\unicode[.8,0]{x212B}}\)
\( \newcommand{\vectorA}[1]{\vec{#1}} % arrow\)
\( \newcommand{\vectorAt}[1]{\vec{\text{#1}}} % arrow\)
\( \newcommand{\vectorB}[1]{\overset { \scriptstyle \rightharpoonup} {\mathbf{#1}} } \)
\( \newcommand{\vectorC}[1]{\textbf{#1}} \)
\( \newcommand{\vectorD}[1]{\overrightarrow{#1}} \)
\( \newcommand{\vectorDt}[1]{\overrightarrow{\text{#1}}} \)
\( \newcommand{\vectE}[1]{\overset{-\!-\!\rightharpoonup}{\vphantom{a}\smash{\mathbf {#1}}}} \)
\( \newcommand{\vecs}[1]{\overset { \scriptstyle \rightharpoonup} {\mathbf{#1}} } \)
\(\newcommand{\longvect}{\overrightarrow}\)
\( \newcommand{\vecd}[1]{\overset{-\!-\!\rightharpoonup}{\vphantom{a}\smash {#1}}} \)
\(\newcommand{\ket}[1]{\left| #1 \right>}\)
\(\newcommand{\bra}[1]{\left< #1 \right|}\)
\(\newcommand{\braket}[2]{\left< #1 \vphantom{#2} \right| \left. #2 \vphantom{#1} \right>}\)
\(\newcommand{\braopket}[3]{\left< #1 \vphantom{#2}\vphantom{#3} \right| #2 \vphantom{#1}\vphantom{#3} \left| #3 \vphantom{#1}\vphantom{#2} \right>}\)
\(\newcommand{\qmvec}[1]{\mathbf{\vec{#1}}}\)
\(\newcommand{\op}[1]{\hat{\mathbf{#1}}}\)
\(\newcommand{\expect}[1]{\langle #1 \rangle}\)
\(\newcommand{\dfn}[1]{\emph{\textbf{#1}}}\)
Radiation, sensible heat and temperature
Temperature is a measure of the average kinetic energy of the atoms or molecules in a substance. The air temperature at any place is determined by (1) radiation and heat transfers between the surface and the air above, (2) the location relative to a large body of water, (3) the movement of vast pools of air called air masses, and (4) albedo.
The air temperature at a place is determined by the exchange of radiant energy between the Sun, Earth, and its atmosphere. Solar radiation is the principle source of energy to heat the surface. Shortwave solar radiation easily penetrates to the surface without much absorption by the gases that comprise the atmosphere. As the sun heats the surface during the day, the earth warms and increases its output of infra red, or longwave radiation. The gases of the atmosphere, being relatively good absorbers of longwave radiation, are warmed and experience a rise in temperature. Thus, the immediate source of energy to heat the air is the surface of the earth. The daily cycle of radiation and air temperature is shown in Figure \(\PageIndex{1}\).
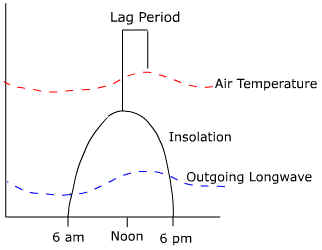
Solar radiation increases after sunrise to a maximum at noon and then decreases to a minimum at sunset. Outgoing radiation increases after sunrise but lags somewhat behind the insolation curve. The graph for air temperature follows the same pattern as that of outgoing radiation. This should seem reasonable as it is the absorption of outgoing energy from the surface that determines air temperature. The amount of time between maximum incoming energy and maximum temperature over the day is known as the daily temperature lag.
A similar type of lag occurs on an annual basis. The seasonal lag of temperature is the amount of time between the highest incoming insolation and highest temperature on an annual basis. For instance, in the midlatitudes the highest angle that the sun makes with the surface, and thus the most intense heating, occurs around June 22nd. It isn't until about a month later that the highest temperatures occur. The lag is often longer near a large body of water like the Great Lakes or the ocean. A temperature lag of two months is not uncommon for places located near large bodies of water.
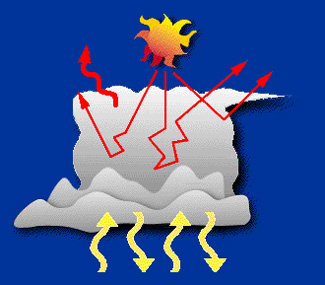
As illustrated in Figure \(\PageIndex{2}\), clouds have an impact on the radiation balance and air temperature of a place. Clouds can block incoming solar radiation by reflection of their tops. Clouds also act to diffuse light as it penetrates towards the surface. Both of these would act to cool the atmosphere. Clouds and water vapor are good absorbers of long wave radiation emitted by the earth's surface too. You've probably noticed that the warmest evenings tend to be when we have a heavy cover of clouds. These clouds absorb the radiation emitted by the earth and radiate it back down toward the earth's surface, warming the air. The coldest evenings occur during cloudless conditions. The lack of clouds in the desert creates large daily temperature ranges. During the day, sunlight streams to the earth's surface heating it to very high temperatures. Near surface air temperatures are very high as a result. At night, the absence of clouds allows emitted long wave radiation to escape to space causing the surface to cool and the air above to do so as well.
The atmosphere is also heated by the exchange of sensible heat between the surface and the air above. Sensible heat is transferred into the air by conduction and convection. Heat is most efficiently moved by turbulent eddies, or swirls of vertically moving air. The initial transfer is due to the presence of a temperature gradient between the surface and the air. If the surface of the earth is warmer than the air above, heat will be transferred upwards raising the temperature of the air. If the air is warmer than the surface, heat will be transferred towards the surface, thus cooling the air. The lag of temperature behind incoming radiation is also a result of the time it takes for sensible heat to transferred upwards.
Air Temperature, Water Bodies and Continentality
Location close to a water body affects the air temperature. This is why Wichita, Kansas with a location in interior continental America, shows a greater annual variation in temperature than Santa Maria, California which has a coastal location. There are multiple ways in which proximity to a water body impact air temperature all of which are caused by differential heating and cooling of land and water. Ocean currents also influence the air temperature.
Water and land absorb and release heat differently. When the sun shines on it, the land warms up very quickly. In the absence of the sun it cools down fast as well. Since water has a higher specific heat capacity which means it takes more energy to change the temperature of water than it does to change land, it heats and cools down slowly. Due to this, water acts like a giant heater in the winter and a cooler in the summer. In Summer, water bodies take time to warm up. Due to this, they have a cooling impact on adjacent land due to the cooling of winds as they blow over the water bodies and move towards the coastal land. In winter , land cools down very fast. Water has absorbed heat all through summer and thus remains warm. It slowly releases heat warming up the coastal areas.
The existence of land breeze and sea breeze, illustrated in Figure \(\PageIndex{3}\), affects the weather on a daily basis. During the day, the sun shines the earth. The land and water both get heated by the sun. The land warms up very fast. Water on the other hand, due to its specific heat takes a lot longer to warm up. The air in contact with the land warms up. Hot air rises. The air on top of the water comes in contact with water and cools down. This cold breeze from the water moves into the land cooling the air temperature. This is called the sea breeze. During the night, in the absence of the sun, the land cools down very fast. The air in contact with the land cools down as well. The water has absorbed heat throughout the day and as a result it is warm. Air in contact with the air gets warm. Hot air rises. The cold breeze from the land blows in to take its place. This is called land breeze.

Figure \(\PageIndex{3}\) is titled “Diurnal Wind Change in Coastal Area” comparing daytime and nighttime wind patterns along a coastline.
On the left, labeled “Day: Sea Breeze,” a cross-sectional view shows land beside a body of water. Red arrows indicate that the water absorbs more heat but remains at a lower temperature than the land. Over the land, red arrows show that the ground absorbs less heat but reaches a higher temperature more quickly. A large curved white arrow points from the ocean toward the land, representing a sea breeze. The diagram illustrates that cooler air over the water moves inland toward the warmer land during the day.
On the right, labeled “Night: Land Wind,” the situation is reversed. The water releases more heat and remains warmer, while the land releases less heat and cools more rapidly. A large curved white arrow points from the land toward the water, representing a land breeze. Cooler, denser air over the land flows offshore toward the relatively warmer water at night. The diagram demonstrates how differences in the heating and cooling rates of land and water create daily coastal wind patterns: sea breezes during the day and land breezes at night.
Ocean currents impact coastal weather by acting as a global conveyor belt, moving heat from the equator towards the poles and cold water from the poles to the equator. As ocean currents move this water, they alter the temperature of the air masses above them. Warm ocean currents heat the overlying air and raise coastal temperatures, while cold ocean currents cool the air mass, resulting in cooler coastal temperatures. The Gulf Stream, illustrated in Figure \(\PageIndex{4}\), flows from the Gulf of Mexico towards Europe along the east coast of the USA. As it approaches Europe, it becomes the North Atlantic Drift. Due to this warm current, London in the United Kingdom—which is at the same latitude as Calgary in Canada—has a mild winter despite its high latitude. The California Current, on the other hand, is a cold current flowing along the California coast. It makes San Francisco cool in the summer, with temperatures around 60°F, while inland regions at the same latitude often reach 90°F.

Figure \(\PageIndex{4}\) is a world map in Robinson projection illustrates the major surface ocean currents. Warm currents are shown with red arrows, and cold currents are shown with blue arrows. Black arrows indicate the directions of large-scale ocean circulation and gyres.
In the Atlantic Ocean, the warm Gulf Stream flows northeast from the Caribbean along the eastern coast of North America, becoming the North Atlantic Drift toward Europe. Cold currents include the Labrador Current flowing south from the Arctic and the Canary Current flowing south along northwestern Africa. In the South Atlantic, the warm Brazil Current moves southward along eastern South America, while the cold Benguela Current flows northward along southwestern Africa.
In the Pacific Ocean, the warm Kuroshio Current flows northward along Japan, while the cold Oyashio Current flows southward from the North Pacific. Along western North America, the cold California Current moves southward. Along western South America, the cold Peru (Humboldt) Current flows northward. The warm East Australian Current flows southward along eastern Australia, while the cold West Australian Current flows northward.
In the Indian Ocean, warm currents such as the Agulhas Current and Mozambique Current move southward along the southeastern coast of Africa.
Near the Equator, the North Equatorial Current and South Equatorial Current flow westward across the Atlantic, Pacific, and Indian Oceans, while the Equatorial Countercurrent flows eastward between them.
Around Antarctica, the Antarctic Circumpolar Current forms a continuous eastward-flowing ring connecting the Atlantic, Pacific, and Indian Oceans. Additional currents labeled Antarctic Subpolar circulate closer to the Antarctic continent.
The map emphasizes the global pattern of interconnected ocean currents that redistribute heat from the tropics toward higher latitudes and transport colder water toward the equator.
Air Temperature and Air Mass Movement
If radiation was the only cause of temperature at a place, the daily and seasonal cycle of temperature would be very regular and exhibit the temporal pattern discussed earlier. The movement of large air masses across the surface can drastically change all this. The movement of a very cold air mass into a region can drop temperatures during the day when we expect the highest temperatures. Or if a warm air mass streamed over us at night, we might experience the highest temperature of the past 24 hours during the evening hours rather than during the daytime.
An air mass is vast pool of air, covering thousands of square kilometers, having about the same humidity and temperature characteristics over its horizontal extent. Air masses are classified based on the temperature and humidity at their source region. Sources for air masses may be either oceanic or continental. Those that are oceanic tend to be moist while continental air masses are typically dry. Latitudinally, air masses form near the equator, in the subtropical zones, "polar" regions, and the Arctic and Antarctic. Most people think of the polar regions as those being located at the pole. For air masses, the polar source region is approximately 60 degrees north or south latitude. Combining the type of surface and latitude we derive a classification for the different kinds of air masses. A few are listed below and their geographic origin is shown in Figure \(\PageIndex{5}\). We'll deal with air masses in more detail when we investigate weather systems.
- Maritime Tropical (mT)
- Originates over the tropical oceans
- Warm and Moist
- Continental Polar (cP)
- Originates over high latitude continents (about 60 degrees north)
- Cold and dry
- Maritime Polar (mP)
- Originates over mid to high latitude oceans.
- Cool and moist
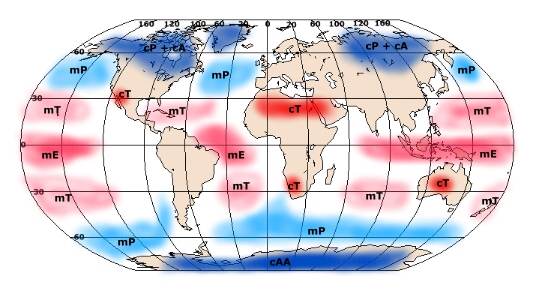
Influence of air masses on temperature at a place.
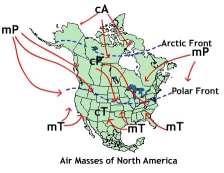
The influence that air masses have on the temperature of a place depends the location with respect to the source of the air mass and the trajectory of the air mass as it moves from its source region. For instance, if one is located in the heart of an air mass source region, your climate will be fairly uniform throughout the year. As shown in Figure \(\PageIndex{6}\), if you lived in north central Canada you are located in the heart of the continental polar air mass (cP). You should expect temperature to be cool to cold, and the humidity relatively low throughout much of the year. However, if you live in central Illinois, you will experience a much greater variation in temperature because you are in the boundary zone between several different air masses. Two air masses in particular influence this region, cP and mT. The cP air brings cool, dry weather while mT air is responsible for humid and warm conditions. When these air masses collide, storms are generated.
Inversions of temperature
Under normal circumstances, air temperature tends to decrease with increasing elevation above the surface through the troposphere called the lapse rate. On an average the temperature drops approximately 3.5°F for every 1,000 feet (or 6.5°C for every 1,000 meters. Under particular conditions the lapse rate of temperature is reversed and temperatures increase with increasing elevation creating an inversion or inverted lapse rate of temperature.
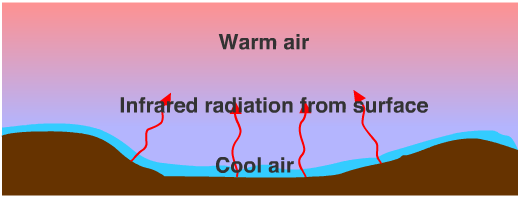
Figure \(\PageIndex{7}\) is a simplified cross-sectional landscape diagram illustrates a temperature inversion. Two brown hills rise on either side of a valley. A shallow layer of cool air fills the valley floor, labeled as “Cool air.” Above it is a larger layer of warm air, and labeled as “Warm air.”
Several wavy arrows rise upward from the ground and are labeled “Infrared radiation from surface.” These arrows represent heat energy radiating from Earth's surface. The cool air remains trapped in the valley while the warmer air sits above it, reversing the normal pattern of air temperature decreasing with height.
A radiation inversion, as shown in Figure \(\PageIndex{7}\), commonly occurs when the evening air is still and there are no clouds to trap heat. Surface temperature drops as long wave radiation emitted by the Earth escapes to space. Air in contact with the surface cools, but that at a higher elevation and not in direct contact with the earth remains somewhat warmer creating the inversion. Cool air will collect in depressions as air density increases and gravity pulls it down slope.
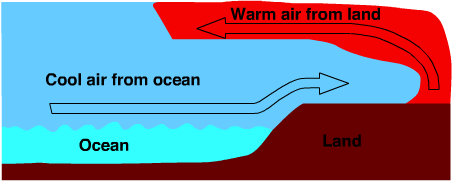
Sea breeze inversions as shown in Figure \(\PageIndex{8}\), form along windward coasts that are influenced by cold ocean currents. As warm air from the open ocean travels over these colder waters, the bottom layer of the air mass cools down. This process traps cool air near the surface while the air above remains warmer. Labels identify:
- Cool air from ocean moving toward land near the surface.
- Warm air from land moving back toward the ocean at higher altitude.
- Ocean on the left.
- Land on the right.
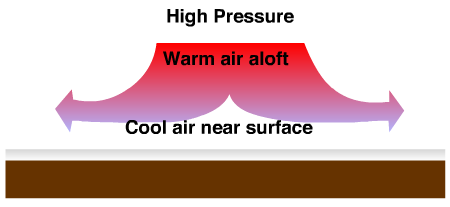
High-pressure systems often create subsidence inversions. As illustrated in Figure \(\PageIndex{9}\), this occurs when air from the upper atmosphere sinks toward the earth. As the air descends, it is compressed and warms up (a process called adiabatic heating). This forms a layer of warm air aloft that sits on top of the cooler air near the surface.