

3.2: Temperature
- Page ID
- 40033

\( \newcommand{\vecs}[1]{\overset { \scriptstyle \rightharpoonup} {\mathbf{#1}} } \)
\( \newcommand{\vecd}[1]{\overset{-\!-\!\rightharpoonup}{\vphantom{a}\smash {#1}}} \)
\( \newcommand{\dsum}{\displaystyle\sum\limits} \)
\( \newcommand{\dint}{\displaystyle\int\limits} \)
\( \newcommand{\dlim}{\displaystyle\lim\limits} \)
\( \newcommand{\id}{\mathrm{id}}\) \( \newcommand{\Span}{\mathrm{span}}\)
( \newcommand{\kernel}{\mathrm{null}\,}\) \( \newcommand{\range}{\mathrm{range}\,}\)
\( \newcommand{\RealPart}{\mathrm{Re}}\) \( \newcommand{\ImaginaryPart}{\mathrm{Im}}\)
\( \newcommand{\Argument}{\mathrm{Arg}}\) \( \newcommand{\norm}[1]{\| #1 \|}\)
\( \newcommand{\inner}[2]{\langle #1, #2 \rangle}\)
\( \newcommand{\Span}{\mathrm{span}}\)
\( \newcommand{\id}{\mathrm{id}}\)
\( \newcommand{\Span}{\mathrm{span}}\)
\( \newcommand{\kernel}{\mathrm{null}\,}\)
\( \newcommand{\range}{\mathrm{range}\,}\)
\( \newcommand{\RealPart}{\mathrm{Re}}\)
\( \newcommand{\ImaginaryPart}{\mathrm{Im}}\)
\( \newcommand{\Argument}{\mathrm{Arg}}\)
\( \newcommand{\norm}[1]{\| #1 \|}\)
\( \newcommand{\inner}[2]{\langle #1, #2 \rangle}\)
\( \newcommand{\Span}{\mathrm{span}}\) \( \newcommand{\AA}{\unicode[.8,0]{x212B}}\)
\( \newcommand{\vectorA}[1]{\vec{#1}} % arrow\)
\( \newcommand{\vectorAt}[1]{\vec{\text{#1}}} % arrow\)
\( \newcommand{\vectorB}[1]{\overset { \scriptstyle \rightharpoonup} {\mathbf{#1}} } \)
\( \newcommand{\vectorC}[1]{\textbf{#1}} \)
\( \newcommand{\vectorD}[1]{\overrightarrow{#1}} \)
\( \newcommand{\vectorDt}[1]{\overrightarrow{\text{#1}}} \)
\( \newcommand{\vectE}[1]{\overset{-\!-\!\rightharpoonup}{\vphantom{a}\smash{\mathbf {#1}}}} \)
\( \newcommand{\vecs}[1]{\overset { \scriptstyle \rightharpoonup} {\mathbf{#1}} } \)
\(\newcommand{\longvect}{\overrightarrow}\)
\( \newcommand{\vecd}[1]{\overset{-\!-\!\rightharpoonup}{\vphantom{a}\smash {#1}}} \)
\(\newcommand{\ket}[1]{\left| #1 \right>}\)
\(\newcommand{\bra}[1]{\left< #1 \right|}\)
\(\newcommand{\braket}[2]{\left< #1 \vphantom{#2} \right| \left. #2 \vphantom{#1} \right>}\)
\(\newcommand{\braopket}[3]{\left< #1 \vphantom{#2}\vphantom{#3} \right| #2 \vphantom{#1}\vphantom{#3} \left| #3 \vphantom{#1}\vphantom{#2} \right>}\)
\(\newcommand{\qmvec}[1]{\mathbf{\vec{#1}}}\)
\(\newcommand{\op}[1]{\hat{\mathbf{#1}}}\)
\(\newcommand{\expect}[1]{\langle #1 \rangle}\)
\(\newcommand{\dfn}[1]{\emph{\textbf{#1}}}\)
Measuring Temperature
Temperature is a measure of the average speed of the random motion of molecules that comprise a substance. Basically, it is a measure of how hot or cold something is. There is an important distinction between temperature and heat. Heat is the total molecular motion associated with a substance while temperature is the average motion of molecular that make up a substance.
There are two ways that the temperature of the air can change. There can be a physical exchange of heat between the air and the earth surface in the presence of a temperature gradient. For example, if the surface is warmer than the air above, heat will be transferred into the air to warm it up. This is a case of diabatic temperature change. The temperature of the air can also change without a physical exchange of heat. This is called an adiabatic temperature change that occurs with rising parcels of air. As a parcel of air rises it expands. In the process of expansion requires the expenditure of its internal energy and as a result the parcel cools.
Surface temperature is the temperature of the earth surface, not the temperature of the air above it. Air temperature is measured at a height of 4 to 6 feet above the surface. For accurate results, instruments should be shielded from the Sun and away from buildings and other structures that could affect temperature measurements. A Stevenson screen, like that shown in Figure \(\PageIndex{1}\) is ventilated to allow air through it.

Temperature is measured using a thermometer shown in Figure \(\PageIndex{2}\). While there are different types of thermometers, they all follow the basic rule that materials change when they get hot or cold. Liquid-in-glass thermometers work using the principle of thermal expansion. As the air warms, heat is conducted to the liquid inside, causing it to expand and rise up the narrow tube. Digital thermometers use electricity instead of liquid; they send a tiny electric current through a sensor that changes its behavior based on the temperature. Finally, bimetallic strip thermometers use two different metals, like steel and brass, bonded together. Because these metals expand and contract at different rates, the strip curls or uncurls when the temperature changes. This curling motion physically pushes a needle to point to the correct temperature.

Figure \(\PageIndex{2}\) shows a vertical thermometer used to measure temperature in degrees Celsius.
The thermometer has a long glass tube with a rounded bulb at the bottom. Inside the tube is a column of liquid that rises or falls depending on temperature.
A scale appears along the tube and is labeled in degrees Celsius (°C). The scale includes 0°C near the middle, which marks the freezing point of water.
Above 0°C, the labeled values increase upward as 10, 20, 30, 40, and 50. Below 0°C, the labeled values decrease downward as negative 10, negative 20, and negative 30. Smaller tick marks between the labeled numbers show smaller temperature intervals.
The top of the liquid column reaches about 20°C. This indicates a temperature of approximately 20 degrees Celsius.
Overall, the diagram shows how a thermometer is read by matching the top of the liquid column to the temperature scale. As temperature rises, the liquid moves upward. As temperature falls, the liquid moves downward.
When it cools down, the liquid moves down as the molecules move closer together. One of two scales of measurement are common to most of us, the Fahrenheit scale in the United States and Celsius in most other countries. The Celsius scale is an accepted international system of measurement because it is based on a decimal scale having 100 units between the freezing and boiling points of water. The Fahrenheit scale sets the freezing point of water at 32oF and 212oF for boiling. In much scientific research the Kelvin scale is used. It is based on the "Kelvin", a unit increment of temperature. Unlike the Fahrenheit and Celsius scales, the Kelvin is not referred to as a "degree". It is an absolute scale given that at absolute zero all molecular movement ceases. It too has 100 units between the freezing and boiling points of water. Absolute zero is -273o on the Celsius scale. Figure \(\PageIndex{3}\) shows the comparative values in the three different scales.
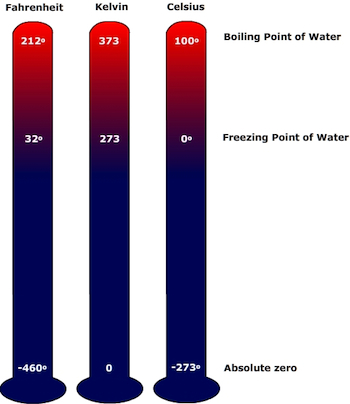
Figure \(\PageIndex{3}\) compares the Celsius, Fahrenheit, and Kelvin temperature scales by aligning the same physical reference points across all three scales.
It shows that the same temperature can have different numerical values depending on the scale being used.
The comparison highlights three main ideas:
- Celsius is based on the freezing point and boiling point of water.
- Fahrenheit uses a different numerical range to represent those same physical temperatures.
- Kelvin is an absolute temperature scale used in science and begins at absolute zero.
Overall, the figure helps users understand how to interpret, compare, and convert temperatures across different measurement systems.
Figure \(\PageIndex{4}\) shows the comparative values between the Celsius (C) and Fahrenheit (F) scale using the conversion formula 9C = 5 * (F-32). By using this formula we can calculate that 0oC on the Celsius scale would show 32oF on the Fahrenheit scale. 100oC on the Celcius Scale will show 212oF on the Fahrenheit scale. At -40o both the Celsius and Fahrenheit Scale will show the same reading.

Figure \(\PageIndex{4}\) shows step-by-step equations used to convert between Celsius (C) and Fahrenheit (F) scales and to find when both scales have the same value.
Overall layout: The image is divided into three sections arranged horizontally:
- Left section: Conversion at 0°C (freezing point of water)
- Middle section: Conversion at 100°C (boiling point of water)
- Right section: Solving for equal values on both scales
Left section: Conversion at 0°C - This confirms that 0°C equals 32°F, the freezing point of water.
- The relationship between Celsius and Fahrenheit is written as a proportion: C divided by 5 equals (F minus 32) divided by 9
- Substituting C = 0 gives: 0 divided by 5 equals (F − 32) divided by 9
- Solving this equation results in: F − 32 = 0 F = 32
Middle section: Conversion at 100°C - This confirms that 100°C equals 212°F, the boiling point of water.
- The same proportional formula is used: C divided by 5 equals (F − 32) divided by 9
- Substituting C = 100 gives: 100 divided by 5 equals (F − 32) divided by 9
- This simplifies to: F − 32 = 20 × 9 F − 32 = 180 F = 212
Right section: When Celsius and Fahrenheit are equal - This shows that −40° is the same on both Celsius and Fahrenheit scales.
- A general equation is set using a variable x: x divided by 5 equals (x − 32) divided by 9
- Solving step by step: 9x = 5(x − 32) 9x = 5x − 160 9x − 5x = −160 4x = −160 x = −40
Temperature Statistics
A variety of statistics are available to easily communicate the volumes of temperature data available. The daily temperature range for a place is the difference between the highest and lowest temperatures over a 24 hour period. The average daily temperature is the sum of highest and lowest temperature of the day divided 2. This the sum of the average daily temperature divided by the number of days in the month. The annual temperature range is the difference between the highest and lowest monthly temperature for a place. The average annual temperature is the sum of the mean monthly temperature divide by 12.