

3.1.10: Radiative Forcing and the Earth's Heat Balance
- Page ID
- 40030

\( \newcommand{\vecs}[1]{\overset { \scriptstyle \rightharpoonup} {\mathbf{#1}} } \)
\( \newcommand{\vecd}[1]{\overset{-\!-\!\rightharpoonup}{\vphantom{a}\smash {#1}}} \)
\( \newcommand{\dsum}{\displaystyle\sum\limits} \)
\( \newcommand{\dint}{\displaystyle\int\limits} \)
\( \newcommand{\dlim}{\displaystyle\lim\limits} \)
\( \newcommand{\id}{\mathrm{id}}\) \( \newcommand{\Span}{\mathrm{span}}\)
( \newcommand{\kernel}{\mathrm{null}\,}\) \( \newcommand{\range}{\mathrm{range}\,}\)
\( \newcommand{\RealPart}{\mathrm{Re}}\) \( \newcommand{\ImaginaryPart}{\mathrm{Im}}\)
\( \newcommand{\Argument}{\mathrm{Arg}}\) \( \newcommand{\norm}[1]{\| #1 \|}\)
\( \newcommand{\inner}[2]{\langle #1, #2 \rangle}\)
\( \newcommand{\Span}{\mathrm{span}}\)
\( \newcommand{\id}{\mathrm{id}}\)
\( \newcommand{\Span}{\mathrm{span}}\)
\( \newcommand{\kernel}{\mathrm{null}\,}\)
\( \newcommand{\range}{\mathrm{range}\,}\)
\( \newcommand{\RealPart}{\mathrm{Re}}\)
\( \newcommand{\ImaginaryPart}{\mathrm{Im}}\)
\( \newcommand{\Argument}{\mathrm{Arg}}\)
\( \newcommand{\norm}[1]{\| #1 \|}\)
\( \newcommand{\inner}[2]{\langle #1, #2 \rangle}\)
\( \newcommand{\Span}{\mathrm{span}}\) \( \newcommand{\AA}{\unicode[.8,0]{x212B}}\)
\( \newcommand{\vectorA}[1]{\vec{#1}} % arrow\)
\( \newcommand{\vectorAt}[1]{\vec{\text{#1}}} % arrow\)
\( \newcommand{\vectorB}[1]{\overset { \scriptstyle \rightharpoonup} {\mathbf{#1}} } \)
\( \newcommand{\vectorC}[1]{\textbf{#1}} \)
\( \newcommand{\vectorD}[1]{\overrightarrow{#1}} \)
\( \newcommand{\vectorDt}[1]{\overrightarrow{\text{#1}}} \)
\( \newcommand{\vectE}[1]{\overset{-\!-\!\rightharpoonup}{\vphantom{a}\smash{\mathbf {#1}}}} \)
\( \newcommand{\vecs}[1]{\overset { \scriptstyle \rightharpoonup} {\mathbf{#1}} } \)
\(\newcommand{\longvect}{\overrightarrow}\)
\( \newcommand{\vecd}[1]{\overset{-\!-\!\rightharpoonup}{\vphantom{a}\smash {#1}}} \)
\(\newcommand{\ket}[1]{\left| #1 \right>}\)
\(\newcommand{\bra}[1]{\left< #1 \right|}\)
\(\newcommand{\braket}[2]{\left< #1 \vphantom{#2} \right| \left. #2 \vphantom{#1} \right>}\)
\(\newcommand{\braopket}[3]{\left< #1 \vphantom{#2}\vphantom{#3} \right| #2 \vphantom{#1}\vphantom{#3} \left| #3 \vphantom{#1}\vphantom{#2} \right>}\)
\(\newcommand{\qmvec}[1]{\mathbf{\vec{#1}}}\)
\(\newcommand{\op}[1]{\hat{\mathbf{#1}}}\)
\(\newcommand{\expect}[1]{\langle #1 \rangle}\)
\(\newcommand{\dfn}[1]{\emph{\textbf{#1}}}\)
The Present Picture
The future physical geography of Earth, as affected by global warming, comes down to changes in the heat balance of the Earth system. Radiative forcing is a measure of the strength of agents, both natural and human, that cause climate change. Radiative forcing agents are factors that change the balance between incoming solar radiation and outgoing infrared radiation within the Earth's atmosphere. The radiative forcing of greenhouse gases is what will propel much of this change. Documented changes with relatively high level of scientific understanding from 1750 to 2005 has been presented by the Intergovernmental Panel on Climate Change.
The Bar chart in Figure \(\PageIndex{1}\) illustrates the various factors, or "agents," that have influenced Earth's climate since the start of the industrial era in 1750. The chart uses bars to show "radiative forcing," which measures how much energy is being added to or removed from the atmosphere. Bars pointing to the right represent warming agents, dominated by long-lived greenhouse gases like Carbon Dioxide and Methane, which trap significant amounts of heat contributing 1.66 and 0.48 (W/m2) respectively at the global scale. There is also a smaller warming contribution from the Sun and lower-atmosphere ozone (0.35 (W/m2)). Conversely, bars pointing to the left represent cooling agents, primarily aerosols (tiny pollution particles) that reflect sunlight and changes in land use, such as deforestation, which makes the surface more reflective. When comparing these opposing forces, the chart clearly shows that the warming caused by human-released greenhouse gases is far stronger than the cooling effects or the tiny natural increase in solar output, proving that human activity is the primary driver of global warming.

Figure \(\PageIndex{1}\) is a horizontal bar chart showing radiative forcing from 1750 to 2005. It compares how different factors contributed to warming or cooling of Earth’s climate.
The horizontal axis is labeled radiative forcing in watts per square meter. Values to the right of zero represent warming, and values to the left of zero represent cooling. The vertical axis lists different climate forcing factors, grouped into human-related factors and natural factors.
Human-Related Warming Factors - Among the long-lived greenhouse gases, carbon dioxide (CO₂) has the largest positive forcing, making it the strongest warming influence in the chart. Methane (CH₄) and nitrous oxide (N₂O) also show substantial positive forcing, but less than carbon dioxide.
Halocarbons also contribute a smaller positive forcing, adding to warming. For ozone, tropospheric ozone shows a warming effect, while stratospheric ozone shows a small cooling effect. Stratospheric water vapor contributes a small positive forcing, which also adds to warming.
Black carbon on snow shows a small positive forcing, meaning it contributes a small warming effect. Linear contrails from aircraft also show a small positive forcing.
Human-Related Cooling Factors - Surface albedo changes from land use show a small negative forcing, indicating a cooling effect caused by changes in surface reflectivity. Aerosols overall show negative forcing, meaning they contribute to cooling. These bars extend to the left and represent reduced solar energy reaching the surface or increased reflection back to space. The cloud albedo effect shows an even larger negative forcing, indicating substantial cooling because clouds and cloud-related aerosol effects reflect sunlight.
Natural Factor - Solar irradiance shows a small positive forcing, meaning a slight natural warming contribution. However, this value is much smaller than the warming caused by major greenhouse gases.
Though human activities affect agents that increase radiative forcing, they also negatively impact radiative forcing. A notable impact, is that of the aerosol content of the atmosphere. Aerosols themselves can negatively impact radiative forcing by reflecting solar radiation. But a much larger impact, and one with less scientific certainty, is their role in creating clouds which also reflect solar radiation.
In addition to changes in the gaseous composition of the atmosphere, surface albedo changes from human activities also effects radiative forcing. This is particularly true when forests are cleared for agriculture. Forests generally have a lower albedo than open land thus absorbing more incident solar radiation. These changes induce a radiative forcing by effecting the shortwave radiation balance. This is particularly true when snow is present. Open land has a more complete cover of highly reflective snow, while the lower albedo trees stand above the snow.
Natural radiative forcing largely results from changes in solar output and volcanic eruptions. As noted earlier, sunspot activity varies on an 11-year cycle. But since the dawn of the industrial age, solar output has been slowly increasing and thus the the Sun has had a positive radiative forcing effect. Volcanic eruptions produce a variety gases, though their presence in the atmosphere is relatively short lived (2 to 3 years). The most notable is sulphate aerosols injected into the stratosphere causing a negative radiative forcing. The stratosphere is presently free of appreciable amounts of volcanic aerosols. The last major eruption to affect stratospheric aerosol content was Mt. Pinatubo in 1991.
Adding the effects of other radiative forcing components like surface albedo changes, the combined net anthropogenic radiative forcing is estimated to be +1.6 (W/m2). This, according to the IPCC, indicates that since 1750, it is extremely likely that human activities have caused a substantial effect on warming Earth's climate. Additionally, is it likely that this estimate is five times greater than that which can be attributed to natural changes in the output of the Sun.


Figures \(\PageIndex{2a}\) and Figure \(\PageIndex{2b}\) show estimates of the spatial pattern of the net radiative flux due to both natural and human factors for one particular model that incorporates the aerosol cloud albedo effect. The radiative forcing is positive for most of the earth and principally associated with long-lived greenhouse gases like carbon dioxide. This is especially true for the southern hemisphere due to the higher levels of aerosols in the source-rich continental regions of the northern hemisphere midlatitudes. Wherever high concentrations of aerosols are found, especially in the northern hemisphere, surface forcing is negative. This is due to the influence of aerosols in reducing the shortwave radiation that reaches the ground. As aerosol concentrations are lower over much of the southern hemisphere oceans and at high latitudes. With less aerosols more shortwave radiation reaches the earth thus surface forcing becomes positive.
Future Forcing
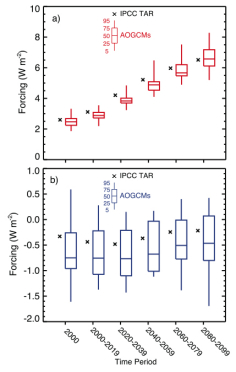
Future heat balance conditions from the forcings is tricky and predictions from various AOGCMs do not precisely agree with one another, largely due to the radiatively active gases used, solar variability, land use change, and how radiation transfer is formulated. Figure \(\PageIndex{3}\) shows the range of forcing using "box and whisker" diagrams estimated by these models using a scenario where economic growth is rapid, world population peaks at 9 billion in 2050 and then declines, there is a quick and efficient spread of technologies, extensive social and cultural interaction occurs worldwide, and world-income and way of life converges between regions. Longwave forcing continues to increase fueling continued warming of the earth system.
Global warming will continue unabated without changes in how human activities impact radiative forcing agents. In future chapters, we'll investigate how changes in these agents will impact patterns of temperature, pressure and wind, weather, biotic systems, the hydrosphere and earth surface processes.