

3.1.9: Global Patterns of Sensible and Latent Heat Transfer
- Page ID
- 40029

\( \newcommand{\vecs}[1]{\overset { \scriptstyle \rightharpoonup} {\mathbf{#1}} } \)
\( \newcommand{\vecd}[1]{\overset{-\!-\!\rightharpoonup}{\vphantom{a}\smash {#1}}} \)
\( \newcommand{\dsum}{\displaystyle\sum\limits} \)
\( \newcommand{\dint}{\displaystyle\int\limits} \)
\( \newcommand{\dlim}{\displaystyle\lim\limits} \)
\( \newcommand{\id}{\mathrm{id}}\) \( \newcommand{\Span}{\mathrm{span}}\)
( \newcommand{\kernel}{\mathrm{null}\,}\) \( \newcommand{\range}{\mathrm{range}\,}\)
\( \newcommand{\RealPart}{\mathrm{Re}}\) \( \newcommand{\ImaginaryPart}{\mathrm{Im}}\)
\( \newcommand{\Argument}{\mathrm{Arg}}\) \( \newcommand{\norm}[1]{\| #1 \|}\)
\( \newcommand{\inner}[2]{\langle #1, #2 \rangle}\)
\( \newcommand{\Span}{\mathrm{span}}\)
\( \newcommand{\id}{\mathrm{id}}\)
\( \newcommand{\Span}{\mathrm{span}}\)
\( \newcommand{\kernel}{\mathrm{null}\,}\)
\( \newcommand{\range}{\mathrm{range}\,}\)
\( \newcommand{\RealPart}{\mathrm{Re}}\)
\( \newcommand{\ImaginaryPart}{\mathrm{Im}}\)
\( \newcommand{\Argument}{\mathrm{Arg}}\)
\( \newcommand{\norm}[1]{\| #1 \|}\)
\( \newcommand{\inner}[2]{\langle #1, #2 \rangle}\)
\( \newcommand{\Span}{\mathrm{span}}\) \( \newcommand{\AA}{\unicode[.8,0]{x212B}}\)
\( \newcommand{\vectorA}[1]{\vec{#1}} % arrow\)
\( \newcommand{\vectorAt}[1]{\vec{\text{#1}}} % arrow\)
\( \newcommand{\vectorB}[1]{\overset { \scriptstyle \rightharpoonup} {\mathbf{#1}} } \)
\( \newcommand{\vectorC}[1]{\textbf{#1}} \)
\( \newcommand{\vectorD}[1]{\overrightarrow{#1}} \)
\( \newcommand{\vectorDt}[1]{\overrightarrow{\text{#1}}} \)
\( \newcommand{\vectE}[1]{\overset{-\!-\!\rightharpoonup}{\vphantom{a}\smash{\mathbf {#1}}}} \)
\( \newcommand{\vecs}[1]{\overset { \scriptstyle \rightharpoonup} {\mathbf{#1}} } \)
\(\newcommand{\longvect}{\overrightarrow}\)
\( \newcommand{\vecd}[1]{\overset{-\!-\!\rightharpoonup}{\vphantom{a}\smash {#1}}} \)
\(\newcommand{\ket}[1]{\left| #1 \right>}\)
\(\newcommand{\bra}[1]{\left< #1 \right|}\)
\(\newcommand{\braket}[2]{\left< #1 \vphantom{#2} \right| \left. #2 \vphantom{#1} \right>}\)
\(\newcommand{\braopket}[3]{\left< #1 \vphantom{#2}\vphantom{#3} \right| #2 \vphantom{#1}\vphantom{#3} \left| #3 \vphantom{#1}\vphantom{#2} \right>}\)
\(\newcommand{\qmvec}[1]{\mathbf{\vec{#1}}}\)
\(\newcommand{\op}[1]{\hat{\mathbf{#1}}}\)
\(\newcommand{\expect}[1]{\langle #1 \rangle}\)
\(\newcommand{\dfn}[1]{\emph{\textbf{#1}}}\)
Controls on Sensible and Latent Heat Exchange
Sensible heat transfer (H) into the air is dependent on the temperature gradient between the surface and the air above. Figure \(\PageIndex{1}\) illustrates that an examination of the global distribution of sensible heat transfer reveals that it is at a maximum in the tropical and subtropical deserts. Here the high surface temperature conducts much heat into the air above. Sensible heat is lowest near the poles where the surface temperatures are quite cold.

Figure \(\PageIndex{1}\) is a world map showing the global distribution of latent heat flux (LE), which is the transfer of energy from Earth’s surface to the atmosphere through evaporation.
The map includes continents, oceans, and latitude-longitude lines. A color scale shows the magnitude of latent heat flux, with higher values representing stronger evaporation and lower values representing weaker evaporation.
The highest latent heat flux values occur over tropical and subtropical oceans. These areas show strong evaporation because they have abundant water and high available energy. Ocean regions near the equator show especially high values, indicating persistent transfer of moisture and energy from the surface to the atmosphere.
Moderate values appear over some mid-latitude oceans, especially near the eastern coasts of continents. These areas reflect strong evaporation where warm ocean water interacts with drier air.
Low values occur over many land areas, especially dry regions such as the Sahara, the Middle East, and parts of Australia. These regions have limited water available for evaporation, so latent heat flux is weak.
Very low values occur at high latitudes and in polar regions, where cold temperatures limit evaporation.
The map also includes contour labels such as 10, 30, and 50, which indicate the magnitude of latent heat transfer in different locations.
Overall, the map shows that latent heat flux is strongest where both water supply and energy are abundant, especially over warm oceans, and weakest in dry or cold regions where evaporation is limited.
As shown in Figure \(\PageIndex{2}\), the maximum amount of latent heat transfer (LE) occurs over the subtropical oceans where there is a maximum of net radiation and, of course, water to evaporate. The lowest rates occur in desert locations. Even though there is ample available energy for LE, there is little water present. Off the east coast of midlatitude continents like North America, we'll find very high rates of latent energy transfer into the air. Here, dry air blows off the continent and over the warm ocean current that flows along the coast. This produces a large moisture gradient between the surface and the air above that induces evaporation and LE transfer.
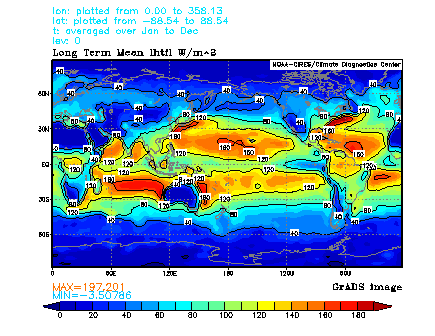
Figure \(\PageIndex{2}\) is a world map showing the global distribution of sensible heat flux (H), which is the transfer of energy from Earth’s surface to the air through direct heating.
The map includes continents, oceans, and latitude-longitude lines. A scale shows sensible heat values from lower to higher amounts.
The highest sensible heat flux values occur over hot, dry land regions, especially major deserts such as the Sahara, the Arabian Peninsula, central Australia, and parts of southwestern North America. These regions have strong surface heating and little moisture, so much of the available energy goes directly into warming the air.
Moderate values appear over some mid-latitude land areas, where surface heating occurs but is less intense than in desert regions.
Low values occur over oceans and in humid regions, where more available energy is used for evaporation instead of directly heating the air.
Very low values occur in high-latitude and polar regions, where cooler surface temperatures limit the transfer of heat to the air.
The map also includes contour labels such as 40, 80, 100, and 120, which show the magnitude of sensible heat transfer in different locations.
Overall, the map shows that sensible heat flux is greatest where surfaces are hot and dry and much weaker where surfaces are moist or cold. This helps explain why desert regions strongly heat the air above them and contribute to broader atmospheric circulation patterns.