

3.1.7.2: The Energy Balance
- Page ID
- 40026

\( \newcommand{\vecs}[1]{\overset { \scriptstyle \rightharpoonup} {\mathbf{#1}} } \)
\( \newcommand{\vecd}[1]{\overset{-\!-\!\rightharpoonup}{\vphantom{a}\smash {#1}}} \)
\( \newcommand{\dsum}{\displaystyle\sum\limits} \)
\( \newcommand{\dint}{\displaystyle\int\limits} \)
\( \newcommand{\dlim}{\displaystyle\lim\limits} \)
\( \newcommand{\id}{\mathrm{id}}\) \( \newcommand{\Span}{\mathrm{span}}\)
( \newcommand{\kernel}{\mathrm{null}\,}\) \( \newcommand{\range}{\mathrm{range}\,}\)
\( \newcommand{\RealPart}{\mathrm{Re}}\) \( \newcommand{\ImaginaryPart}{\mathrm{Im}}\)
\( \newcommand{\Argument}{\mathrm{Arg}}\) \( \newcommand{\norm}[1]{\| #1 \|}\)
\( \newcommand{\inner}[2]{\langle #1, #2 \rangle}\)
\( \newcommand{\Span}{\mathrm{span}}\)
\( \newcommand{\id}{\mathrm{id}}\)
\( \newcommand{\Span}{\mathrm{span}}\)
\( \newcommand{\kernel}{\mathrm{null}\,}\)
\( \newcommand{\range}{\mathrm{range}\,}\)
\( \newcommand{\RealPart}{\mathrm{Re}}\)
\( \newcommand{\ImaginaryPart}{\mathrm{Im}}\)
\( \newcommand{\Argument}{\mathrm{Arg}}\)
\( \newcommand{\norm}[1]{\| #1 \|}\)
\( \newcommand{\inner}[2]{\langle #1, #2 \rangle}\)
\( \newcommand{\Span}{\mathrm{span}}\) \( \newcommand{\AA}{\unicode[.8,0]{x212B}}\)
\( \newcommand{\vectorA}[1]{\vec{#1}} % arrow\)
\( \newcommand{\vectorAt}[1]{\vec{\text{#1}}} % arrow\)
\( \newcommand{\vectorB}[1]{\overset { \scriptstyle \rightharpoonup} {\mathbf{#1}} } \)
\( \newcommand{\vectorC}[1]{\textbf{#1}} \)
\( \newcommand{\vectorD}[1]{\overrightarrow{#1}} \)
\( \newcommand{\vectorDt}[1]{\overrightarrow{\text{#1}}} \)
\( \newcommand{\vectE}[1]{\overset{-\!-\!\rightharpoonup}{\vphantom{a}\smash{\mathbf {#1}}}} \)
\( \newcommand{\vecs}[1]{\overset { \scriptstyle \rightharpoonup} {\mathbf{#1}} } \)
\(\newcommand{\longvect}{\overrightarrow}\)
\( \newcommand{\vecd}[1]{\overset{-\!-\!\rightharpoonup}{\vphantom{a}\smash {#1}}} \)
\(\newcommand{\ket}[1]{\left| #1 \right>}\)
\(\newcommand{\bra}[1]{\left< #1 \right|}\)
\(\newcommand{\braket}[2]{\left< #1 \vphantom{#2} \right| \left. #2 \vphantom{#1} \right>}\)
\(\newcommand{\braopket}[3]{\left< #1 \vphantom{#2}\vphantom{#3} \right| #2 \vphantom{#1}\vphantom{#3} \left| #3 \vphantom{#1}\vphantom{#2} \right>}\)
\(\newcommand{\qmvec}[1]{\mathbf{\vec{#1}}}\)
\(\newcommand{\op}[1]{\hat{\mathbf{#1}}}\)
\(\newcommand{\expect}[1]{\langle #1 \rangle}\)
\(\newcommand{\dfn}[1]{\emph{\textbf{#1}}}\)
Sensible Heat Transfer (H)
Available net radiation is used to do work in the Earth system. The principal use of this energy is in the phase change of water (latent heat, LE), changing the temperature of the air (sensible heat, H), and subsurface (ground heat, G) or,
Q* = H + LE + G
Though there are other uses for net radiation like photosynthesis and the weathering of rocks, it is the three previously stated uses that are most important. LE, H, and G involve non-radiative transfers of heat. That is, conduction or convection/advection are responsible for the transfer of heat, not electromagnetic radiation.
When work is done, like heating the air above the surface, there is a transfer of energy (heat) from one place to the next. To illustrate the transfer of energy we'll use arrows either pointing away from or toward the surface of the Earth to indicate the direction of heat transfer. We will also use positive and negative signs to indicate that heat is being added to, or taken away from a body. Following the conventions of Sellers (1965) and Oke (1987), non-radiative fluxes directed away from a surface are positive. Thus positive values indicates a loss of heat from the surface while negative values indicate a gain.
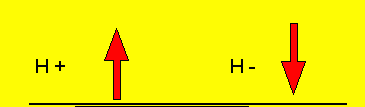
Figure \(\PageIndex{1}\) illustrates the mechanism of sensible heat transfer between the ground and the atmosphere. The direction the heat moves depends on which part is warmer. When the ground is hotter than the air, heat moves upward (a positive transfer). This warms the air while cooling the ground. Conversely, if the air is warmer than the ground—which often happens at night after the sun goes down—the heat moves downward from the air to the surface (a negative transfer). This cools the air while warming the ground.
Sensible heat is the energy that moves between the ground and the air when they are at different temperatures. We can feel this transfer when the air around us gets warmer or cooler. This process happens primarily in two main steps. First, air touches the surface and warms up through conduction. Since air is a poor conductor of heat it warms up by the process of conduction. As the air warms up, it rises while cold air sinks and gets heated when it comes in contact with the land. This method of circulation is the most efficient way to move that heat upward.
Latent Heat Transfer (LE)
When energy is added to water, it changes from a liquid to a gas in a process called evaporation. Water molecules (H2O) like to stick together in groups. When heat is added during evaporation, it breaks the bonds holding these groups together, causing individual molecules to escape into the air as gas. The energy used to do this is called "latent heat of vaporization." We call it "latent," or hidden, because the energy is stored inside the molecules to keep them apart rather than raising their temperature, so we cannot feel it. This stored heat is only released back into the air when the water turns back into a liquid (condensation).
In weather diagrams, we describe evaporation as a "positive latent heat flux." In Figure \(\PageIndex{2}\), this is shown with an arrow pointing upward, away from the ground. This arrow indicates that the surface is losing energy to the air above. Because the water molecules take heat energy with them when they escape, the surface left behind gets cooler. You have likely experienced this cooling process yourself when sweat evaporates from your skin, making you feel colder.
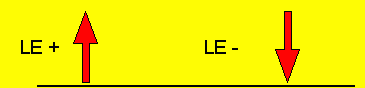
Figure \(\PageIndex{2}\) shows a simple representation of latent heat exchange (LE) between a surface and the air above it.
A horizontal line represents the ground surface. Above this line is the air.
On the left side, an upward-pointing arrow labeled “LE +” rises from the surface into the air. This indicates positive latent heat flux, where energy moves upward. This process occurs when water evaporates from the surface into the air. During evaporation, energy is absorbed from the surface and transferred upward in the form of water vapor, which cools the surface.
On the right side, a downward-pointing arrow labeled “LE −” moves from the air toward the surface. This indicates negative latent heat flux, where energy moves downward. This process occurs during condensation, when water vapor in the air changes back into liquid and releases energy to the surface, warming it.
The diagram illustrates the direction of energy transfer associated with phase changes of water. Evaporation transfers energy away from the surface, while condensation transfers energy back to the surface.
Condensation is the process where water vapor changes into water. This process involves cooling of water vapor. This implies that the "hidden" (latent) energy that was stored in the water molecules during evaporation is released back into the surrounding air. This process converts that stored energy into heat we can feel (sensible heat), which actually warms up the air around the water.
This energy use also explains why land and water heat up differently. When the sun shines on the land, it warms the surface. However, on water surfaces, a significant amount of that solar energy is "spent" on evaporating the water rather than just raising its temperature. On land, most of the energy goes straight into heating the ground. As a result, even with the same amount of sunlight, land heats up much faster and gets hotter than water. This differential heating is the primary mechanism driving land breeze and sea breeze during the night and day respectively having a moderating effect on local temperatures, keeping them milder than inland areas.
Ground Heat Transfer (G)
The third major use of radiant energy is to warm the subsurface of the Earth. Heat is transferred from the surface downwards via conduction. Like in the case of sensible heat transfer, a temperature gradient must exist between the surface and the subsurface for heat transfer to occur. As shown in Figure \(\PageIndex{3}\), heat is transferred downwards when the surface is warmer than the subsurface (positive ground heat flux). If the subsurface is warmer than the surface then heat is transferred upwards (negative ground heat flux).
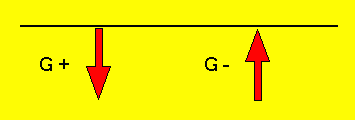
Figure \(\PageIndex{3}\) shows ground heat flux (G), representing the transfer of energy between the Earth’s surface and the ground below.
A horizontal line represents the ground surface. Two vertical arrows illustrate the direction of energy movement.
On the left side, a downward-pointing arrow labeled “G +” extends from the surface into the ground. This indicates positive ground heat flux, where energy moves from the surface downward into the soil or subsurface layers. This occurs when the surface is warmer than the ground below, causing heat to be stored in the ground.
On the right side, an upward-pointing arrow labeled “G −” extends from the ground toward the surface. This indicates negative ground heat flux, where energy moves upward from the ground to the surface. This occurs when the ground is warmer than the surface, releasing stored heat back upward.
The diagram illustrates how energy is exchanged between the surface and subsurface. Heat can be stored in the ground during periods of surface warming and later released when surface conditions cool, contributing to the overall energy balance of the surface.
The transfer of energy to and from the surface varies over the course of a day. Figure \(\PageIndex{4}\) shows the relative amounts and direction of energy flow during the day and night for a moist surface. During the day net radiation is a positive value as incoming radiation exceeds outgoing radiation allowing the surface to gain energy. The energy is distributed over the three major categories of energy use, LE, H, and G. During the day, the available radiant energy is used to evaporate water into the air, raising the air's humidity. Sensible heat is transferred upwards to warm the air above the surface. Heat is also conducted down into the subsurface. At night the processes reverse. At night with no incoming solar radiation there is more outgoing radiation than incoming creating a negative value for net radiation. Under these circumstances the surface cools due to a loss of energy and heat is transferred from the air toward the surface. As air cools through the evening the loss of energy allow condensation to occur, so long as the air's humidity is at or near saturation. Notice that the arrow for the ground heat flux G is pointing upward toward the surface. This indicates that the energy that had been stored in the subsurface during the day is now conducted toward the surface. This occurs as the surface is cooler than the subsurface.
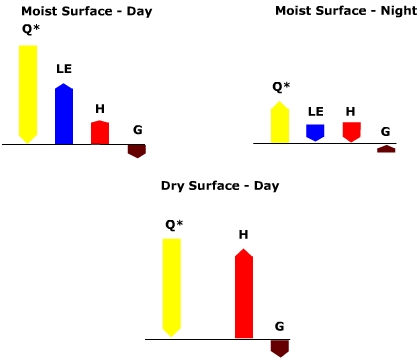
Figure \(\PageIndex{4}\) presents three scenarios comparing energy fluxes over moist and dry surfaces during day and night. Each scenario shows bars representing different components of the surface energy balance:
- Q* (net radiation)
- LE (latent heat flux)
- H (sensible heat flux)
- G (ground heat flux)
Top left: Moist Surface – Day A large downward bar labeled Q* indicates strong incoming net radiation. A tall upward bar labeled LE shows that a significant portion of this energy is used for evaporation, transferring energy into the atmosphere as water vapor. A smaller upward bar labeled H shows some energy heating the air. A downward bar labeled G indicates energy being stored in the ground.
Function: Most available energy over a moist surface during the day is used for evaporation (latent heat), which limits surface heating.
Top right: Moist Surface – Night A smaller bar labeled Q* indicates reduced or negative net radiation. Short bars for LE and H show limited energy exchange with the air. A small upward bar labeled G indicates heat being released from the ground back to the surface.
Function: At night, moist surfaces release stored energy, and fluxes are generally weaker compared to daytime.
Bottom: Dry Surface – Day A large downward bar labeled Q* shows strong incoming net radiation. No significant LE bar is shown, indicating little evaporation. A very tall upward bar labeled H shows that most energy heats the air. A downward bar labeled G indicates some energy stored in the ground.
Function: On dry surfaces, little energy is used for evaporation, so most energy increases air temperature through sensible heat.
Investigate more about the energy balance by "Digging Deeper: Local Energy Balances" or skip and continue reading.
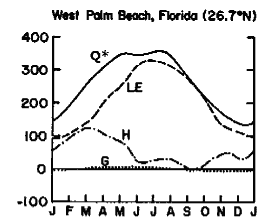
Figure \(\PageIndex{5}\) is a line graph showing how different components of surface energy balance vary over the course of a year in West Palm Beach, Florida, labeled at approximately 26.7° north latitude.
The horizontal axis represents months of the year, labeled sequentially from January through December and returning to January. The vertical axis represents energy values, ranging from below zero to about 400 units.
Four separate curves are labeled:
- Q* (net radiation)
- LE (latent heat flux)
- H (sensible heat flux)
- G (ground heat flux)
The Q* curve rises from lower values in winter, steadily increases through spring, and reaches a peak during summer months around June to August. It then declines again through fall into winter. This shows that net incoming energy is highest during summer when solar radiation is strongest.
The LE curve follows a similar pattern to Q* but remains slightly lower. It increases during warmer months and peaks in summer, indicating that a large portion of available energy is used for evaporation and moisture transfer to the atmosphere.
The H curve is lower than both Q* and LE. It shows moderate values that vary across the year but remain relatively small compared to latent heat. This indicates that less energy goes into directly heating the air compared to evaporation.
The G curve remains close to zero throughout the year, with only small variations. This shows that relatively little energy is stored in or released from the ground compared to other processes.
West Palm Beach, Florida is located in the warm and moist tropical wet and dry (savanna) climate. As illustrated in Figure \(\PageIndex{5}\), the annual variation of net radiation shows a typical pattern of Q* being at a maximum during the summer and minimum during the winter. Latent heat transfer (LE) is high at West Palm Beach because of the water availability near the ocean. Latent energy transfer into the air is greatest during the summer time which is the wettest period of the year, and when net radiation is the highest. Warmer summer time air can hold more moisture and hence there is a larger moisture gradient to drive latent heat transfer. The annual variation of sensible heat transfer is determined by the available net radiation and the temperature gradient between the air and surface, as well as use of energy for latent heat transfer. During the spring a larger temperature gradient exists between the surface and the air above. Ample rainfall occurs during the summer providing water for evaporation. During this time period, sensible heat transfer decreases as net radiation is allocated to evaporation and latent heat transfer.
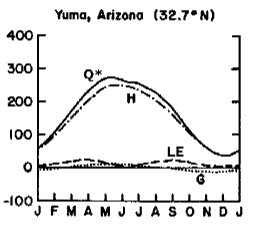
Figure \(\PageIndex{6}\) is a line graph showing how components of surface energy balance vary over the course of a year in Yuma, Arizona, labeled at approximately 32.7° north latitude.
The horizontal axis represents months of the year from January through December. The vertical axis represents energy values, ranging from about −100 to 400 units.
Four curves are shown:
- Q* (net radiation)
- H (sensible heat flux)
- LE (latent heat flux)
- G (ground heat flux)
The Q* curve rises from lower values in winter, increases through spring, and reaches a peak during summer months before declining again into winter. This pattern shows that net incoming energy is highest during summer when solar radiation is strongest.
The H curve closely follows the pattern of Q*, with relatively high values throughout the warmer months. This indicates that a large portion of available energy is transferred to the air as sensible heat, meaning the air temperature increases.
The LE curve remains very low throughout the year, with only small fluctuations. This shows that very little energy is used for evaporation, reflecting the dry conditions of the region.
The G curve stays near zero, with small positive and negative variations, indicating limited energy storage or release from the ground compared to other fluxes.
At the other extreme is Yuma, Arizona, shown in Figure \(\PageIndex{6}\), a warm and dry location typical of the mid latitude desert climate. The most noticeable characteristic of this place is the lack of latent heat transfer. Though ample radiation is available here, there is little water to evaporate. Nearly all net radiation is used for sensible heat transfer which explains the hot, dry conditions at Yuma.
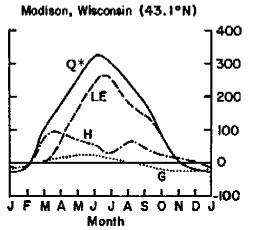
Figure \(\PageIndex{7}\) is a line graph showing seasonal variation in surface energy balance components for Madison, Wisconsin, located at approximately 43.1° north latitude.
The horizontal axis represents months of the year from January through December. The vertical axis shows energy values ranging from about −100 to 400 units.
Four curves are labeled:
- Q* (net radiation)
- LE (latent heat flux)
- H (sensible heat flux)
- G (ground heat flux)
The Q* curve starts at low values during winter months, increases through spring, and reaches a peak in mid to late summer. It then declines again through fall into winter. This pattern reflects the seasonal change in incoming solar radiation, with maximum energy available in summer.
The LE curve follows a similar seasonal pattern to Q*, increasing during warmer months and peaking in summer. This indicates that more energy is used for evaporation and moisture transfer during the growing season when water is available.
The H curve is moderate and varies throughout the year. It increases during late winter and early spring when evaporation is limited, then decreases during peak summer as more energy is directed toward latent heat. After summer, H rises again slightly as evaporation decreases.
The G curve remains near zero with small fluctuations. It is slightly positive during warmer months, indicating some energy storage in the ground, and slightly negative during cooler months, indicating release of stored heat.
Between these extremes is Madison, WI found in the humid continental climate of North America. As illustrated in Figure \(\PageIndex{7}\), latent heat transfer dominates for most of the year in this humid climate. Sensible heat transfer is especially high when surface and air temperatures are most different. The transfer of energy in and out of the subsurface is a much greater amplitude given that large temperature swings that are experienced in this climate.