

3.1.6: Insolation
- Page ID
- 40023

\( \newcommand{\vecs}[1]{\overset { \scriptstyle \rightharpoonup} {\mathbf{#1}} } \)
\( \newcommand{\vecd}[1]{\overset{-\!-\!\rightharpoonup}{\vphantom{a}\smash {#1}}} \)
\( \newcommand{\dsum}{\displaystyle\sum\limits} \)
\( \newcommand{\dint}{\displaystyle\int\limits} \)
\( \newcommand{\dlim}{\displaystyle\lim\limits} \)
\( \newcommand{\id}{\mathrm{id}}\) \( \newcommand{\Span}{\mathrm{span}}\)
( \newcommand{\kernel}{\mathrm{null}\,}\) \( \newcommand{\range}{\mathrm{range}\,}\)
\( \newcommand{\RealPart}{\mathrm{Re}}\) \( \newcommand{\ImaginaryPart}{\mathrm{Im}}\)
\( \newcommand{\Argument}{\mathrm{Arg}}\) \( \newcommand{\norm}[1]{\| #1 \|}\)
\( \newcommand{\inner}[2]{\langle #1, #2 \rangle}\)
\( \newcommand{\Span}{\mathrm{span}}\)
\( \newcommand{\id}{\mathrm{id}}\)
\( \newcommand{\Span}{\mathrm{span}}\)
\( \newcommand{\kernel}{\mathrm{null}\,}\)
\( \newcommand{\range}{\mathrm{range}\,}\)
\( \newcommand{\RealPart}{\mathrm{Re}}\)
\( \newcommand{\ImaginaryPart}{\mathrm{Im}}\)
\( \newcommand{\Argument}{\mathrm{Arg}}\)
\( \newcommand{\norm}[1]{\| #1 \|}\)
\( \newcommand{\inner}[2]{\langle #1, #2 \rangle}\)
\( \newcommand{\Span}{\mathrm{span}}\) \( \newcommand{\AA}{\unicode[.8,0]{x212B}}\)
\( \newcommand{\vectorA}[1]{\vec{#1}} % arrow\)
\( \newcommand{\vectorAt}[1]{\vec{\text{#1}}} % arrow\)
\( \newcommand{\vectorB}[1]{\overset { \scriptstyle \rightharpoonup} {\mathbf{#1}} } \)
\( \newcommand{\vectorC}[1]{\textbf{#1}} \)
\( \newcommand{\vectorD}[1]{\overrightarrow{#1}} \)
\( \newcommand{\vectorDt}[1]{\overrightarrow{\text{#1}}} \)
\( \newcommand{\vectE}[1]{\overset{-\!-\!\rightharpoonup}{\vphantom{a}\smash{\mathbf {#1}}}} \)
\( \newcommand{\vecs}[1]{\overset { \scriptstyle \rightharpoonup} {\mathbf{#1}} } \)
\(\newcommand{\longvect}{\overrightarrow}\)
\( \newcommand{\vecd}[1]{\overset{-\!-\!\rightharpoonup}{\vphantom{a}\smash {#1}}} \)
\(\newcommand{\ket}[1]{\left| #1 \right>}\)
\(\newcommand{\bra}[1]{\left< #1 \right|}\)
\(\newcommand{\braket}[2]{\left< #1 \vphantom{#2} \right| \left. #2 \vphantom{#1} \right>}\)
\(\newcommand{\braopket}[3]{\left< #1 \vphantom{#2}\vphantom{#3} \right| #2 \vphantom{#1}\vphantom{#3} \left| #3 \vphantom{#1}\vphantom{#2} \right>}\)
\(\newcommand{\qmvec}[1]{\mathbf{\vec{#1}}}\)
\(\newcommand{\op}[1]{\hat{\mathbf{#1}}}\)
\(\newcommand{\expect}[1]{\langle #1 \rangle}\)
\(\newcommand{\dfn}[1]{\emph{\textbf{#1}}}\)
Sun Angle and Insolation
The Earth is "constantly" bathed in solar radiation. On average, the Earth receives 1368 W/m2 (1.96 ly/min) of solar radiation at the outer edge of the atmosphere, called the "solar constant". However, the actual amount received at the edge of the atmosphere and the Earth's surface varies from place to place and day to day on account of the orientation of the Earth to the Sun. The solar radiation that makes its way through the atmosphere and to the surface is called insolation. The amount of insolation received at the surface depends on 1) the sun angle, 2) day length, 3) ground slope, 4) path length, and 5) the state of the atmosphere.
The amount and intensity of solar radiation reaching the Earth is affected by the tilt of the Earth's axis and its orientation as it revolves around the Sun. The sun angle at a place varies over the course of the year as a result of the constant tilt and parallelism of the earth's axis. As the sun angle decreases, light is spread over a larger area and decreases in intensity (energy input per unit area).
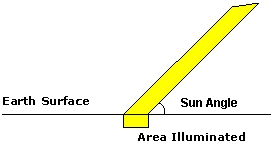
Figure \(\PageIndex{1}\) shows how the angle at which sunlight strikes Earth affects the amount of surface area illuminated.
A horizontal line represents the Earth’s surface. A beam of incoming solar radiation is shown approaching the surface at an angle rather than straight down. Where the beam meets the surface, a rectangular region labeled “area illuminated” is shown.
Because the incoming radiation strikes the surface at an angle, the same amount of solar energy is spread across a larger surface area. The diagram includes a labeled angle between the incoming beam and the surface to indicate the sun angle. As this angle decreases, the beam becomes more spread out over the surface.
The diagram illustrates that when the Sun is lower in the sky, energy is distributed over a larger area, reducing the intensity of radiation received at any one location. In contrast, when the Sun is directly overhead, the same energy is concentrated over a smaller area, resulting in higher intensity.

Figure \(\PageIndex{2}\) illustrates the effect of changing sun angle on the area illuminated and intensity of heating at different sun angles. Beam A and B have the same amount of energy as they pass through the atmosphere as shown by having the same width. Beam A strikes the surface at a 90 degree angle, the highest angle a beam of light can have. It illuminates the area outlined by the solid square. Beam B strikes the surface at a lower angle than A. Its energy is spread over a larger area, the same area as A's plus the area enclosed by the dashed lines. The result of spreading the same energy out over a larger area is to reduce the intensity . Lower intensity input results in less heating.
The Sun angle refers to how high the Sun appears above the local horizon. The intensity of incoming solar radiation is maximized when the Sun's rays strike the Earth at the highest possible angle, which always occurs at noon for any given location. This maximum is called the noon sun angle.
The Sun's zenith angle is the angle formed by a beam of light and a line perpendicular to the surface; it essentially measures how far the Sun is from being directly overhead (the zenith). Due to the seasonal changes in the Sun's declination (the Sun's angular distance north or south of the equator), the Sun is only ever directly overhead at noon along a specific latitude called the subsolar point.
Day length and Insolation
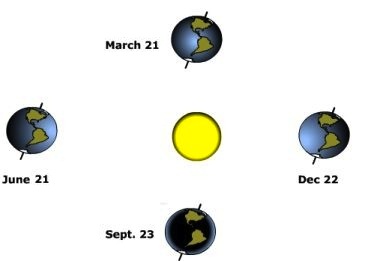
Figure \(\PageIndex{3}\) shows the position of Earth relative to the Sun at four different times of the year, arranged around a central Sun.
At the center is the Sun, represented as a circular object. Surrounding it are four Earth positions placed at equal distances, forming a circular path that represents Earth’s orbit.
Each Earth position is labeled with a date:
- March 21
- June 21
- September 23
- December 22
Each Earth is shown with its axis tilted in the same direction, indicating that the tilt remains constant as Earth orbits the Sun.
At the positions labeled March 21 and September 23, the tilt of Earth is neither toward nor away from the Sun. These positions represent the equinoxes, when both hemispheres receive approximately equal amounts of solar radiation.
At the position labeled June 21, the Northern Hemisphere is tilted toward the Sun. This represents the June solstice, when the Northern Hemisphere receives more direct solar radiation and experiences longer days.
At the position labeled December 22, the Northern Hemisphere is tilted away from the Sun. This represents the December solstice, when the Southern Hemisphere receives more direct solar radiation and the Northern Hemisphere experiences shorter days.
The diagram illustrates how Earth’s axial tilt and its orbit around the Sun cause seasonal changes by altering the distribution and intensity of solar radiation across the planet during the year.
Ground Slope and Insolation
The slope of the surface that a beam of light strikes affects the intensity of energy it receives. Slope affects insolation intensity in two ways, 1) the degree of slope inclination, and 2) the orientation of the slope to incoming light.


The effect of ground slope is to change the angle that a beam of light strikes the earth (i.e. the sun angle). Figure \(\PageIndex{4}\) shows a beam of light striking horizontal slope at a 45o angle on the left. On the right, the slope is tilted to a 45o angle while keeping the beam coming to the earth as it was before. By tilting the surface into the Sun, you effectively increase the sun angle. Increasing the sun angle increases the intensity of energy received at the surface.
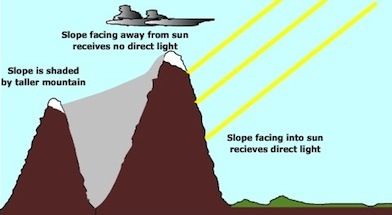
Figure \(\PageIndex{5}\) shows a mountainous landscape with two slopes positioned between a light source and the ground surface. Several parallel rays represent incoming solar radiation approaching from one side.
One slope is oriented toward the incoming radiation. This slope is labeled as receiving direct sunlight. The rays strike this surface without obstruction, indicating that it receives a higher amount of solar energy.
A second slope is positioned behind the first slope and is labeled as being shaded. This slope does not receive direct sunlight because the taller mountain in front blocks the incoming rays. As a result, this surface receives little to no direct solar radiation.
A third surface is shown facing away from the direction of the incoming radiation. This surface is labeled as receiving no direct light because the angle of the slope prevents the radiation from striking it directly.
The diagram demonstrates how slope orientation and shading affect solar energy receipt. Surfaces that face the Sun and are not blocked receive the most direct radiation, while surfaces that are shaded or oriented away from the Sun receive much less energy. This explains variations in temperature and energy distribution across different parts of a landscape.
Orientation, or direction the slope is facing also affects the amount of insolation received. Figure \(\PageIndex{5}\) illustrates that slopes facing the Sun receive more insolation while those that face away receive less. Some surfaces can be shaded during a portion of the day by obstructions reducing the amount of insolation received by them.
Path length and Insolation
The distance a beam of light travels affects the amount of solar energy that ultimately reaches the Earth. Light spreads outward in all directions when it is emitted from the Sun. As the light spreads, its intensity upon reaching distant locations decreases. The intensity of light decreases as the square of the distance between the Sun and receptor increases, a relationship known as the inverse square law. The Earth receives about one-half of one billionth of the Sun's total output of energy.
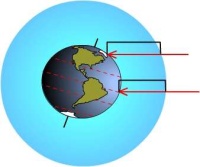
Figure \(\PageIndex{6}\) shows Earth in space with a surrounding layer representing the atmosphere and incoming solar radiation approaching from one side.
Earth is drawn as a sphere with one half illuminated and the other half in darkness, representing day and night. A circular region around Earth represents the atmosphere.
Parallel horizontal arrows point toward Earth from the side of the illuminated hemisphere. These arrows represent incoming solar radiation traveling from the Sun toward Earth.
As the arrows reach the atmosphere and Earth’s surface, several outcomes are shown:
- Some arrows pass directly through the atmosphere and reach the surface, showing that part of the incoming solar radiation is transmitted and absorbed by Earth’s surface.
- Some arrows are redirected outward before reaching the surface, indicating reflection or scattering back to space by clouds, atmospheric particles, or Earth’s surface.
- The diagram also suggests energy interactions near the surface, where absorbed radiation contributes to heating and may later be re-emitted.
The atmosphere is depicted as a layer that modifies incoming radiation rather than allowing all of it to pass through unchanged.
Overall, the diagram illustrates how solar radiation interacts with the atmosphere and Earth’s surface: part of the energy is transmitted and absorbed, while part is reflected or scattered back to space. This process explains how Earth maintains its energy balance and temperature.
The Earth-Sun distance only varies by about 3 million miles compared to an average distance of 93 million miles over the year. Thus path length doesn't change much as the Earth revolves around the Sun. But once sunlight reaches the outer edge of the atmosphere, the thickness of the atmosphere has a significant impact on insolation. As shown in Figure \(\PageIndex{6}\), due to the curvature of the Earth, a beam of light striking the Equator passes through less atmosphere than one at a higher latitude. As the amount of atmosphere through which the beam passes increases, the greater the chance for reflection and scattering of light to occur, thus reducing insolation at the surface.
State of the Atmosphere and Insolation
Clouds, particulates, and aerosols suspended in the air have a dramatic effect on the transmission of insolation. These components of the atmosphere absorb radiation emitted by the earth, reflect incoming solar radiation back to space and scatter light into many weaker beams. Scattering of light by particles in the atmosphere is responsible for the color of the sky. Clouds are particularly important in determining the amount of insolation. Clouds can reflect much light back to space or scatter and diffuse light.
Learn more with "Digging Deeper: Global Dimming" or skip and continue reading.
Human activities from agriculture to industry release particulates into the air. Studies in many parts of the world indicate that insolation has been decreasing as particulate concentrations have been increasing, a phenomenon called global dimming. Research conducted in the Maldives demonstrated that dirty air descending from India produced a three kilometers thick pollutant layer that hung over the northern islands. The pollutant layer cut down the sunlight reaching the ocean by more than 10 percent. Climate scientists fear that the reduction of insolation by atmospheric particulates are masking the true magnitude of global warming. A reduction of particulate pollution to protect human health may cause an increase in insolation and thus accelerate global warming.

Contrails are clouds produced from jet exhaust and have been a subject of research for some time. They are difficult to study because they develop and dissipate quite rapidly, or so many of them in the sky they merge. This makes it difficult to perform baseline studies on individual clouds. When first formed they are thick and rounded blocking light like low stratus clouds causing the air to cool. Over time they morph into thinner clouds like high cirrus better at absorbing radiation thus warming the air. When air transportation was suspended over the United States shortly after the events of September 11, 2001, atmospheric scientists had an opportunity to study the effect of contrails on weather. What they found was daily temperature ranges increased by as much a two degrees Fahrenheit in the absence of contrails over the contiguous United States.