

3.1.5.1: The Nature of Electromagnetic Radiation
- Page ID
- 40020

\( \newcommand{\vecs}[1]{\overset { \scriptstyle \rightharpoonup} {\mathbf{#1}} } \)
\( \newcommand{\vecd}[1]{\overset{-\!-\!\rightharpoonup}{\vphantom{a}\smash {#1}}} \)
\( \newcommand{\dsum}{\displaystyle\sum\limits} \)
\( \newcommand{\dint}{\displaystyle\int\limits} \)
\( \newcommand{\dlim}{\displaystyle\lim\limits} \)
\( \newcommand{\id}{\mathrm{id}}\) \( \newcommand{\Span}{\mathrm{span}}\)
( \newcommand{\kernel}{\mathrm{null}\,}\) \( \newcommand{\range}{\mathrm{range}\,}\)
\( \newcommand{\RealPart}{\mathrm{Re}}\) \( \newcommand{\ImaginaryPart}{\mathrm{Im}}\)
\( \newcommand{\Argument}{\mathrm{Arg}}\) \( \newcommand{\norm}[1]{\| #1 \|}\)
\( \newcommand{\inner}[2]{\langle #1, #2 \rangle}\)
\( \newcommand{\Span}{\mathrm{span}}\)
\( \newcommand{\id}{\mathrm{id}}\)
\( \newcommand{\Span}{\mathrm{span}}\)
\( \newcommand{\kernel}{\mathrm{null}\,}\)
\( \newcommand{\range}{\mathrm{range}\,}\)
\( \newcommand{\RealPart}{\mathrm{Re}}\)
\( \newcommand{\ImaginaryPart}{\mathrm{Im}}\)
\( \newcommand{\Argument}{\mathrm{Arg}}\)
\( \newcommand{\norm}[1]{\| #1 \|}\)
\( \newcommand{\inner}[2]{\langle #1, #2 \rangle}\)
\( \newcommand{\Span}{\mathrm{span}}\) \( \newcommand{\AA}{\unicode[.8,0]{x212B}}\)
\( \newcommand{\vectorA}[1]{\vec{#1}} % arrow\)
\( \newcommand{\vectorAt}[1]{\vec{\text{#1}}} % arrow\)
\( \newcommand{\vectorB}[1]{\overset { \scriptstyle \rightharpoonup} {\mathbf{#1}} } \)
\( \newcommand{\vectorC}[1]{\textbf{#1}} \)
\( \newcommand{\vectorD}[1]{\overrightarrow{#1}} \)
\( \newcommand{\vectorDt}[1]{\overrightarrow{\text{#1}}} \)
\( \newcommand{\vectE}[1]{\overset{-\!-\!\rightharpoonup}{\vphantom{a}\smash{\mathbf {#1}}}} \)
\( \newcommand{\vecs}[1]{\overset { \scriptstyle \rightharpoonup} {\mathbf{#1}} } \)
\(\newcommand{\longvect}{\overrightarrow}\)
\( \newcommand{\vecd}[1]{\overset{-\!-\!\rightharpoonup}{\vphantom{a}\smash {#1}}} \)
\(\newcommand{\ket}[1]{\left| #1 \right>}\)
\(\newcommand{\bra}[1]{\left< #1 \right|}\)
\(\newcommand{\braket}[2]{\left< #1 \vphantom{#2} \right| \left. #2 \vphantom{#1} \right>}\)
\(\newcommand{\braopket}[3]{\left< #1 \vphantom{#2}\vphantom{#3} \right| #2 \vphantom{#1}\vphantom{#3} \left| #3 \vphantom{#1}\vphantom{#2} \right>}\)
\(\newcommand{\qmvec}[1]{\mathbf{\vec{#1}}}\)
\(\newcommand{\op}[1]{\hat{\mathbf{#1}}}\)
\(\newcommand{\expect}[1]{\langle #1 \rangle}\)
\(\newcommand{\dfn}[1]{\emph{\textbf{#1}}}\)
Energy as electromagnetic waves
Unlike convection or conduction, heat transfer by electromagnetic radiation requires no intervening medium to transmit it. Electromagnetic radiation travels through space in the form of waves. It's hard to imagine radiation moving as waves through empty space without a medium to transfer the wave form. The waves created when you drop a rock into a pool require molecules of water to propagate them, but not so for radiation.
Figure \(\PageIndex{1}\) defines the two primary characteristics of any wave: amplitude and wavelength. The amplitude of an electromagnetic wave is its height, measured vertically from the center line to the crest (peak). This characteristic is directly linked to the amount of energy the wave carries. Simply put, a greater amplitude means the wave is transporting a greater magnitude of energy.
The wavelength is the distance between two consecutive crests of the wave. This distance determines the type or quality of the radiation. For example, a wave with a very long wavelength is classified as a radio wave, while a wave with a much shorter wavelength is visible light or an X-ray. It is the distinguishing factor that categorizes all the bands of the electromagnetic spectrum.

Figure \(\PageIndex{1}\) is a continuous repeating wave pattern is shown moving horizontally across the diagram. The wave rises to a high point, descends to a low point, and repeats this cycle several times, representing a periodic motion.
A vertical indicator line is placed from the center level of the wave up to one of the highest points. This line represents the amplitude, which is the maximum distance from the midline (equilibrium position) to a crest. Amplitude indicates the strength or intensity of the wave.
A horizontal double‑ended arrow spans between two identical points along the wave pattern (such as from one crest to the next crest or from one trough to the next trough). This arrow represents the wavelength, which is the distance over which the wave pattern repeats.
Together, the diagram shows how amplitude describes the height of the wave, while wavelength describes the length of one complete cycle of the wave pattern.
Any body that has a temperature is emitting electromagnetic radiation. There are an infinite number of wavelengths that make up the electromagnetic spectrum though we group them into a number of bands (Figure \(\PageIndex{2}\)). The shortest wavelengths fall into the gamma rays, the electromagnetic radiation we can see with our eyes and processed by our brains falls into the visible band, and radio waves are comprised of the longest wavelengths. Visible rays have wavelengths roughly ranging from 400 nanometers (violet light) to 700 nanometers (red light). Human eye has special photoreceptor cells in the retina which contain pigments that can absorb and react to wavelengths in the visible light range. Wavelengths shorter than the visible light range would damage the cells in the eye while wavelengths longer than 700 nanometers have too little energy to initiate a chemical reaction in the eye. In the visible light range, violet has the shortest wavelength while red has the longest.
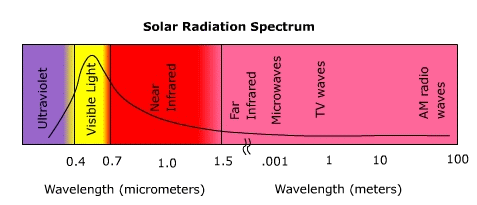
Figure \(\PageIndex{2}\) shows the solar radiation spectrum organized along a horizontal axis labeled wavelength. The scale begins at approximately 0.4 micrometers and increases through 0.7 micrometers, then continues into larger wavelengths measured in meters, extending to about 100 meters.
The spectrum is divided into labeled regions representing different types of electromagnetic radiation. On the left side is the ultraviolet region, followed by a narrow band labeled visible light between about 0.4 and 0.7 micrometers. Next is the near infrared region, followed by far infrared, then microwaves, TV waves, and finally AM radio waves at the longest wavelengths on the far right.
A curve runs across the diagram, peaking within the visible light region and declining as wavelength increases. This curve represents the relative intensity of solar radiation at different wavelengths. The peak in the visible range indicates that the Sun emits the greatest amount of energy in wavelengths that correspond to visible light. The decreasing curve toward longer wavelengths shows that less energy is emitted in the infrared and radio regions.
Overall, the diagram illustrates how solar energy is distributed across the electromagnetic spectrum, highlighting that most solar radiation reaching Earth is concentrated in the visible and near‑visible wavelengths.
The maximum wavelength at which a body emits radiation depends on its temperature. Wein's (pronounced "weens") Law states that the peak wavelength of radiation emission is inversely related to the temperature of the emitting body. That is, the hotter the body, the shorter the wavelength of peak emission. Figure \(\PageIndex{3}\) shows the wavelengths over which the Sun and Earth emit most of their radiation. The Sun being a much hotter body emits most of its radiation in the shortwave end and the Earth in the longwave end of the spectrum. The division between shortwave and longwave radiation occurs at about 3 micrometers.
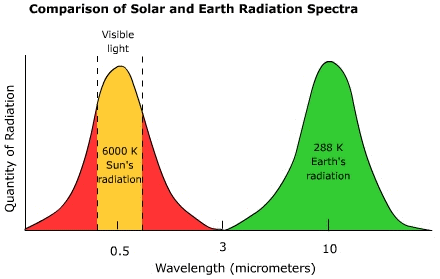
Figure \(\PageIndex{3}\) compares two radiation curves plotted on a horizontal axis labeled wavelength in micrometers and a vertical axis labeled quantity of radiation.
On the left side of the graph, a curve labeled “6000 K Sun’s radiation” rises sharply, reaches a peak near the wavelength value of approximately 0.5 micrometers, and then decreases. A labeled region around this peak marks “visible light,” indicating that most of the Sun’s energy is emitted at shorter wavelengths within the visible portion of the spectrum.
On the right side of the graph, a second curve labeled “288 K Earth’s radiation” forms a broader peak centered near a wavelength of approximately 10 micrometers. This curve shows that Earth emits radiation at much longer wavelengths compared to the Sun.
The two curves are separated along the wavelength axis, with the Sun’s peak at short wavelengths and Earth’s peak at long wavelengths. This separation demonstrates that the Sun primarily emits high‑energy, short‑wavelength radiation, while Earth re‑emits absorbed energy as lower‑energy, long‑wavelength radiation.
Overall, the diagram illustrates the relationship between temperature and radiation: hotter objects, like the Sun, emit radiation at shorter wavelengths, while cooler objects, like Earth, emit radiation at longer wavelengths.