

2.3: Atmospheric Structure
- Page ID
- 40013

\( \newcommand{\vecs}[1]{\overset { \scriptstyle \rightharpoonup} {\mathbf{#1}} } \)
\( \newcommand{\vecd}[1]{\overset{-\!-\!\rightharpoonup}{\vphantom{a}\smash {#1}}} \)
\( \newcommand{\dsum}{\displaystyle\sum\limits} \)
\( \newcommand{\dint}{\displaystyle\int\limits} \)
\( \newcommand{\dlim}{\displaystyle\lim\limits} \)
\( \newcommand{\id}{\mathrm{id}}\) \( \newcommand{\Span}{\mathrm{span}}\)
( \newcommand{\kernel}{\mathrm{null}\,}\) \( \newcommand{\range}{\mathrm{range}\,}\)
\( \newcommand{\RealPart}{\mathrm{Re}}\) \( \newcommand{\ImaginaryPart}{\mathrm{Im}}\)
\( \newcommand{\Argument}{\mathrm{Arg}}\) \( \newcommand{\norm}[1]{\| #1 \|}\)
\( \newcommand{\inner}[2]{\langle #1, #2 \rangle}\)
\( \newcommand{\Span}{\mathrm{span}}\)
\( \newcommand{\id}{\mathrm{id}}\)
\( \newcommand{\Span}{\mathrm{span}}\)
\( \newcommand{\kernel}{\mathrm{null}\,}\)
\( \newcommand{\range}{\mathrm{range}\,}\)
\( \newcommand{\RealPart}{\mathrm{Re}}\)
\( \newcommand{\ImaginaryPart}{\mathrm{Im}}\)
\( \newcommand{\Argument}{\mathrm{Arg}}\)
\( \newcommand{\norm}[1]{\| #1 \|}\)
\( \newcommand{\inner}[2]{\langle #1, #2 \rangle}\)
\( \newcommand{\Span}{\mathrm{span}}\) \( \newcommand{\AA}{\unicode[.8,0]{x212B}}\)
\( \newcommand{\vectorA}[1]{\vec{#1}} % arrow\)
\( \newcommand{\vectorAt}[1]{\vec{\text{#1}}} % arrow\)
\( \newcommand{\vectorB}[1]{\overset { \scriptstyle \rightharpoonup} {\mathbf{#1}} } \)
\( \newcommand{\vectorC}[1]{\textbf{#1}} \)
\( \newcommand{\vectorD}[1]{\overrightarrow{#1}} \)
\( \newcommand{\vectorDt}[1]{\overrightarrow{\text{#1}}} \)
\( \newcommand{\vectE}[1]{\overset{-\!-\!\rightharpoonup}{\vphantom{a}\smash{\mathbf {#1}}}} \)
\( \newcommand{\vecs}[1]{\overset { \scriptstyle \rightharpoonup} {\mathbf{#1}} } \)
\(\newcommand{\longvect}{\overrightarrow}\)
\( \newcommand{\vecd}[1]{\overset{-\!-\!\rightharpoonup}{\vphantom{a}\smash {#1}}} \)
\(\newcommand{\ket}[1]{\left| #1 \right>}\)
\(\newcommand{\bra}[1]{\left< #1 \right|}\)
\(\newcommand{\braket}[2]{\left< #1 \vphantom{#2} \right| \left. #2 \vphantom{#1} \right>}\)
\(\newcommand{\braopket}[3]{\left< #1 \vphantom{#2}\vphantom{#3} \right| #2 \vphantom{#1}\vphantom{#3} \left| #3 \vphantom{#1}\vphantom{#2} \right>}\)
\(\newcommand{\qmvec}[1]{\mathbf{\vec{#1}}}\)
\(\newcommand{\op}[1]{\hat{\mathbf{#1}}}\)
\(\newcommand{\expect}[1]{\langle #1 \rangle}\)
\(\newcommand{\dfn}[1]{\emph{\textbf{#1}}}\)
Troposphere and Tropopause
If we examine the vertical structure the atmosphere in different places we will find it varies in height, being lowest at the poles and highest at the equator. The varying height is due to the spatial variation in heating of the Earth's surface and thus the atmosphere above. This fact makes it difficult to define exact heights for the layers of the atmosphere. The solution is to subdivide the atmosphere not on the basis of fixed heights, but on temperature change. Figure \(\PageIndex{1}\) illustrates the way in which the atmosphere is divided into Troposphere, Stratosphere, Mesosphere and beyond using temperature change as the primary criterion.
The troposphere is the layer closest to the Earth's surface. It extends from the ground to approximately 8 to 14.5 km. The height varies due to temperature and air circulation. The height is more at the equator where the direct rays of the sun result in warmer air and warm air expands. Air at the poles on the other hand is cooler. Cold air being dense sinks. The graph of temperature change indicates that air temperature decreases with an increase in altitude through this layer. Air temperature normally decreases with height above the surface because the primary source of heating for the air is the Earth. The Earth's surface absorbs solar energy and then re-radiates it as longwave (infrared) radiation. The air closest to the ground is heated most effectively by conduction and this infrared radiation, causing the temperature to be warmest near the bottom and progressively cooler higher up.The rate of change in temperature with altitude is called the environmental lapse rate of temperature (ELR) The ELR varies from day-to-day at a place, and from place to place on any given day. The normal lapse rate of temperature is the average value of the ELR, 0.65o C /100 meters. That is, at any particular place and on any given day the actual ELR may be larger or smaller, but on average has a value of 0.65o C /100 m. So if one went outside today it could be 0.62o C /100 m and then tomorrow it might be 0.68o C /100 m. The ELR also varies from place to place on a given day. That is, at Chicago, Illinois it might be 0.65o C /100 m and on the same day it could be 0.62o C /100 m over London, England.
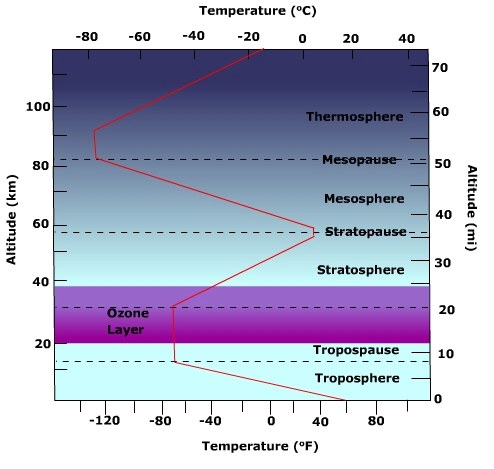
Figure \(\PageIndex{1}\) is a vertical profile of Earth’s atmosphere that shows how temperature changes with altitude and identifies the major atmospheric layers.
The vertical axis shows altitude, with kilometers on the left and miles on the right, extending from Earth’s surface to about 110 kilometers. The horizontal axes show temperature, with degrees Fahrenheit along the bottom and degrees Celsius along the top. A line shows the temperature profile. The pattern changes direction several times as altitude increases.
In the troposphere, from the surface to about 10 to 12 kilometers, temperature decreases with altitude. This is the lowest atmospheric layer and the region where most weather occurs.
At the tropopause, around 10 to 12 kilometers, the troposphere transitions into the stratosphere.
In the stratosphere, from about 10 to 50 kilometers, temperature increases with altitude. This warming is associated with the ozone layer, located roughly between 20 and 30 kilometers, where ozone absorbs ultraviolet radiation. At the stratopause, around 50 kilometers, the stratosphere transitions into the mesosphere.
In the mesosphere, from about 50 to 85 kilometers, temperature decreases again with altitude. This is the coldest region of the profile, and meteors often burn up in this layer. At the mesopause, around 80 to 85 kilometers, the mesosphere transitions into the thermosphere.
In the thermosphere, above about 85 kilometers, temperature increases sharply with altitude because this layer absorbs high-energy solar radiation.
Overall, the figure shows that atmospheric temperature does not change uniformly with height. Instead, it alternates between cooling and warming, and those changes define the major layers of the atmosphere. The ozone layer helps explain why the stratosphere warms with altitude.
Under the right conditions, the air temperature may actually increase with an increase in altitude above the Earth. When this occurs we are experiencing an inverted lapse rate of temperature, or simply an inversion. Shallow surface inversions are typical over the snow covered surfaces of subarctic and polar regions, and sometimes occur when high pressure cells inhabit a region.
Most of the weather phenomenons like clouds, rain and snow originate in the troposphere because it contains most of the earth's water vapor.
The tropopause lies above the troposphere. Here the temperature tends to stay the same with increasing height. The tropopause acts as a "lid" on the troposphere preventing air from rising upwards into the stratosphere.
Stratosphere
The stratosphere is located directly above the tropopause, and it is the second major layer of Earth's atmosphere. Unlike the troposphere below it, the stratosphere exhibits a unique temperature profile. Note in Figure \(\PageIndex{1}\) that the temperature of the air does not change with an increase in elevation. Isothermal layer is a zone where the air temperature remains constant with increasing altitude. However, throughout most of the rest of the stratosphere, the temperature actually increases with height, a condition known as a temperature inversion. This warming is critical and is caused by the presence of the ozone layer. Ozone molecules effectively absorb the Sun's high-energy ultraviolet (UV) radiation, converting this energy into heat. Because the radiation hits the layer from above, the highest parts of the stratosphere are the warmest. The temperature gradually decreases toward the bottom, where the heat absorbed from the Sun diminishes. The top of this warming layer is marked by the stratopause, which is another isothermal layer that acts as the boundary separating the stratosphere from the next layer, the mesosphere.
Mesosphere and Thermosphere
The third layer shown in Figure \(\PageIndex{1}\) is the mesosphere, where air temperature begins to decrease with increasing altitude. This cooling occurs because the air is extremely thin—over $99.9\%$ of the atmosphere's total mass lies below it—leaving very few molecules, like ozone, available to absorb solar radiation and generate heat. Consequently, temperature steadily drops with height, making the upper mesosphere the coldest region in the atmosphere. The mesosphere is topped by the mesopause, an isothermal transition layer that separates it from the hotter thermosphere above.
Figure \(\PageIndex{1}\) illustrates the thermosphere, which is the fourth atmospheric layer, and its most notable feature is that air temperature increases dramatically with altitude. This warming is caused by energetic oxygen molecules directly absorbing intense incoming solar radiation (like high-energy UV and X-rays). Because solar activity is the source of heating, the air temperature at the top of the layer is significantly warmer than at the bottom. However, while the temperature (a measure of molecular speed) is extremely high, the layer’s heat content is very low. This is because the air is incredibly thin and has a very low density, meaning there are too few molecules present to transfer meaningful thermal energy.
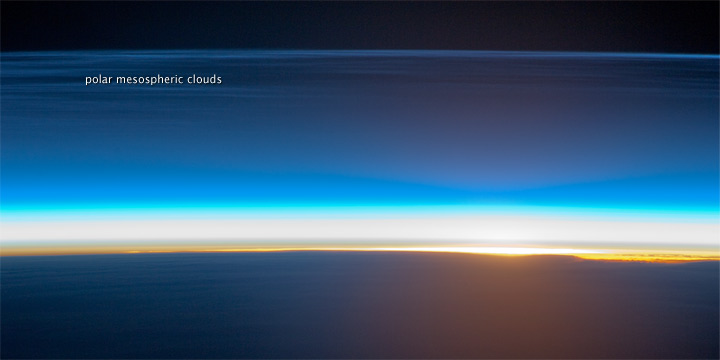
Figure \(\PageIndex{2}\) shows Earth’s atmosphere near the horizon as seen from very high altitude, likely from space or the upper atmosphere. The curved, dark lower portion of the image represents Earth’s surface. Along the horizon, a thin bright band marks the place where sunlight is reaching the atmosphere at a shallow angle.
Above the horizon, the atmosphere appears as a series of smooth horizontal layers. These layers are brightest near the horizon and gradually become darker with increasing altitude. The gradual change in brightness and color shows how sunlight is scattered differently through thicker and thinner parts of the atmosphere.
A labeled layer identified as polar mesospheric clouds appears above most of the other visible atmospheric bands, showing that these clouds occur at very high altitude in the upper atmosphere.
Toward the top of the image, the atmosphere fades into very dark space. This gradual darkening shows that atmospheric density decreases with altitude and that the atmosphere transitions continuously into space rather than ending at a sharp boundary.
Overall, the image illustrates three main ideas: sunlight enters and illuminates the atmosphere most strongly along the horizon, the atmosphere is vertically layered, and polar mesospheric clouds form high above the denser lower layers.
Polar mesospheric clouds are also known as noctilucent or "night-shining" clouds as they are usually seen at twilight. These clouds form at high latitudes and high altitudes (76 - 85 kilometers) near the boundary of the mesosphere and thermosphere.
Functional layers
Two layers, the ionosphere and ozonosphere are identified when using function as the criterion for subdivision.
Ionosphere which is present in the upper atmosphere is made up of parts of mesosphere, thermosphere and exosphere. The ionosphere is not really a layer of the atmosphere, but an electrified field of ions and free electrons. Here gases are turned into ions by the solar rays (X-rays and UV rays). While the ionosphere absorbs high-energy radiation, the ionization process itself is the mechanism that creates the charged particles that define the ionosphere. The ionosphere absorbs cosmic rays, gamma rays, X-rays, and shorter wavelengths of ultraviolet radiation. The spectacular display of auroral lights is generally found in this region. During a solar storm, charged particles move towards the earth. Most of it gets deflected by the earth's magnetic field. Earth's magnetic field acts like a giant funnel, guiding the high-speed, electrically charged particles toward the North and South Poles in a big circle called the auroral oval. When the high speed particles collide with oxygen and nitrogen from the atmosphere, they excite them and add to their energy. When they slow down and release energy in the form of light. Oxygen emits green or red light while nitrogen emits blue or violet light. The electronically charged particles in the ionosphere also reflects and refracts radio waves back to the earth and thus helps with communication.

Figure \(\PageIndex{3}\) shows a nighttime outdoor landscape beside a calm body of water, with a bright aurora (northern lights) illuminating the sky. A distant shoreline and small land features are visible under a star-filled sky.
The ozonosphere, also called the "ozone layer", is the concentrated layer of ozone found in the stratosphere. Ozone (O3) absorbs ultraviolet light between 0.1 - 0.3ตm. The ozone layer absorbs 97 - 99% of the Sun's ultraviolet light that can be harmful to life on earth. Though relatively constant through millions of years, seasonal fluctuations of ozone especially over the Arctic and Antarctic are common. The ozone layer is thinner at the equator and thicker at the poles. Ozone concentrations are highest in the spring and generally lowest during the autumn.
Assess your basic understanding of the preceding material by "Looking Back at Atmospheric Structure" or skip and continue reading.
Explain what normally happens to air temperature as one moves upward through the troposphere.
- Answer
-
Temperature decreases.
Define the normal and environmental lapse rate of temperature.
- Answer
-
The normal lapse rate of temperature is the average decrease in temperature with an increase in elevation. The environmental lapse rate is the decrease in temperature with an increase in elevation at any given time.
What happens to air temperature as one moves upward through the stratosphere?
- Answer
-
Generally increases.
Define "temperature inversion".
- Answer
-
A temperature inversion is a situation in which air temperature increases with increasing elevation.
Describe the "functional layers" of the atmosphere and explain what do they do?
- Answer
-
The ionosphere absorbs cosmic rays, gamma rays, X-rays, and shorter wavelengths of ultraviolet radiation. The ozonosphere absorbs 97% of the Sun's ultraviolet light that can be harmful to life on earth.