

2.2: Atmospheric Composition
- Page ID
- 40012

\( \newcommand{\vecs}[1]{\overset { \scriptstyle \rightharpoonup} {\mathbf{#1}} } \)
\( \newcommand{\vecd}[1]{\overset{-\!-\!\rightharpoonup}{\vphantom{a}\smash {#1}}} \)
\( \newcommand{\dsum}{\displaystyle\sum\limits} \)
\( \newcommand{\dint}{\displaystyle\int\limits} \)
\( \newcommand{\dlim}{\displaystyle\lim\limits} \)
\( \newcommand{\id}{\mathrm{id}}\) \( \newcommand{\Span}{\mathrm{span}}\)
( \newcommand{\kernel}{\mathrm{null}\,}\) \( \newcommand{\range}{\mathrm{range}\,}\)
\( \newcommand{\RealPart}{\mathrm{Re}}\) \( \newcommand{\ImaginaryPart}{\mathrm{Im}}\)
\( \newcommand{\Argument}{\mathrm{Arg}}\) \( \newcommand{\norm}[1]{\| #1 \|}\)
\( \newcommand{\inner}[2]{\langle #1, #2 \rangle}\)
\( \newcommand{\Span}{\mathrm{span}}\)
\( \newcommand{\id}{\mathrm{id}}\)
\( \newcommand{\Span}{\mathrm{span}}\)
\( \newcommand{\kernel}{\mathrm{null}\,}\)
\( \newcommand{\range}{\mathrm{range}\,}\)
\( \newcommand{\RealPart}{\mathrm{Re}}\)
\( \newcommand{\ImaginaryPart}{\mathrm{Im}}\)
\( \newcommand{\Argument}{\mathrm{Arg}}\)
\( \newcommand{\norm}[1]{\| #1 \|}\)
\( \newcommand{\inner}[2]{\langle #1, #2 \rangle}\)
\( \newcommand{\Span}{\mathrm{span}}\) \( \newcommand{\AA}{\unicode[.8,0]{x212B}}\)
\( \newcommand{\vectorA}[1]{\vec{#1}} % arrow\)
\( \newcommand{\vectorAt}[1]{\vec{\text{#1}}} % arrow\)
\( \newcommand{\vectorB}[1]{\overset { \scriptstyle \rightharpoonup} {\mathbf{#1}} } \)
\( \newcommand{\vectorC}[1]{\textbf{#1}} \)
\( \newcommand{\vectorD}[1]{\overrightarrow{#1}} \)
\( \newcommand{\vectorDt}[1]{\overrightarrow{\text{#1}}} \)
\( \newcommand{\vectE}[1]{\overset{-\!-\!\rightharpoonup}{\vphantom{a}\smash{\mathbf {#1}}}} \)
\( \newcommand{\vecs}[1]{\overset { \scriptstyle \rightharpoonup} {\mathbf{#1}} } \)
\(\newcommand{\longvect}{\overrightarrow}\)
\( \newcommand{\vecd}[1]{\overset{-\!-\!\rightharpoonup}{\vphantom{a}\smash {#1}}} \)
\(\newcommand{\ket}[1]{\left| #1 \right>}\)
\(\newcommand{\bra}[1]{\left< #1 \right|}\)
\(\newcommand{\braket}[2]{\left< #1 \vphantom{#2} \right| \left. #2 \vphantom{#1} \right>}\)
\(\newcommand{\braopket}[3]{\left< #1 \vphantom{#2}\vphantom{#3} \right| #2 \vphantom{#1}\vphantom{#3} \left| #3 \vphantom{#1}\vphantom{#2} \right>}\)
\(\newcommand{\qmvec}[1]{\mathbf{\vec{#1}}}\)
\(\newcommand{\op}[1]{\hat{\mathbf{#1}}}\)
\(\newcommand{\expect}[1]{\langle #1 \rangle}\)
\(\newcommand{\dfn}[1]{\emph{\textbf{#1}}}\)
Homo sphere and Hetero sphere
The Earth's atmosphere is a dynamic mix of gases that surrounds our planet.
While the air is mostly made up of nitrogen and oxygen—both critical for life and surface processes—it's the so-called "variable gases" that often have the greatest impact on our climate. These minor gases, such as carbon dioxide and water vapor, are essential because they largely control Earth's heat budget and the distribution of moisture.
The atmosphere is not a uniform mass; instead, it's organized in layers defined by how its temperature changes vertically. Scientists also divide the atmosphere into two broad regions based on air composition homo sphere and hetero sphere.
The Homo sphere
This is the inner region, extending from the surface up to about 80 km (50 mi). Here, the gases are generally uniformly mixed, though there are exceptions like the ozone layer and variations in water vapor and pollutants near the ground.
The Hetero sphere
This is the outer region, starting around 80 km (50 mi). In this layer, gases are so sparse that gravity sorts them by weight. The heaviest elements (nitrogen and oxygen) settle at the bottom, while the lightest elements (hydrogen and helium) are found at the very edges of space.
Constant Gases
The atmosphere is dominated by constant gases—those whose concentration has barely changed throughout Earth's recent history. These make up almost all of the air we breathe:
Nitrogen (78%)
Nitrogen is the most abundant gas, and it's chemically inert (unreactive). While it originated primarily from volcanic activity, organisms can't use it directly from the air. Instead, it's a critical element in proteins and is made available to plants and animals only after specialized microorganisms in the soil convert it into usable compounds (a process called nitrogen fixation)
Oxygen (21%)
Oxygen is vital because it supports both plant and animal respiration. It also drives oxidation, a type of chemical reaction necessary for processes like chemical weathering (the breakdown of rocks) and combustion (burning). All free oxygen in the atmosphere is a product of photosynthesis, where plants absorb carbon dioxide and release oxygen.
Argon (0.93%)
Argon is a colorless, odorless, and highly inert gas. Because it doesn't react with other elements, it has important industrial uses, such as providing a protective, non-reactive atmosphere for arc welding and being used in electric light bulbs and fluorescent tubes.
Variable Gases
The so called "variable gases" are those present in small and variable amounts. These include carbon dioxide, methane, ozone, water vapor, and particulates among others. Even though they represent a tiny portion of the atmosphere as a whole, they exert a great control over our environment.
Carbon dioxide
Carbon dioxide(CO2) makes up only 0.036% of the atmosphere by volume. Carbon dioxide is essential to photosynthetic processes of plants. Huge quantities of carbon are stored in plant tissue, deposits of coal, peat, oil, and gas. Carbon dioxide is taken in by plants and during photosynthesis is combined with water and energy to form oxygen and carbohydrates. The stored carbohydrates are used to fuel plant respiration and growth. Carbon is also stored in limestone rocks that have formed by the compaction of carbonate-rich shells of ocean life. Because vegetation takes in so much carbon dioxide, we often refer to plants as a "sink" for it.
Carbon dioxide in the atmosphere varies throughout the year, decreasing slightly during the summer as plants leaf out, and then increases during the winter as plants go dormant and photosynthesis decreases. The zigzag pattern of carbon dioxide measurements taken at Mauna Loa, Hawaii in Figure \(\PageIndex{1}\) below illustrates this seasonality. The black line shows the seasonally adjusted trend of CO2 concentration, rising from approximately 315 ppm in 1958 to over 425 ppm (approximately) in 2024.

Figure \(\PageIndex{1}\) is titled Atmospheric CO2 at Mauna Loa Observatory, is a line graph showing direct measurements of atmospheric carbon dioxide concentration from 1958 to the early 2020s.
The horizontal axis shows year, beginning around 1958 and extending to the early 2020s. The vertical axis shows CO2 mole fraction in parts per million (ppm), ranging from about 315 to 425 ppm.
The graph contains one continuous data line. This line shows two important patterns.
First, there is a clear long-term upward trend. Atmospheric CO2 begins at about 315 ppm in 1958 and increases steadily over time. By the early 2020s, it rises to more than 420 ppm. This shows that atmospheric carbon dioxide has accumulated continuously over several decades.
Second, the line shows regular repeating yearly fluctuations. The graph has a zigzag pattern, with small increases followed by small decreases that repeat about once each year. These seasonal cycles reflect natural changes in plant growth and decay.
Text at the bottom identifies the data sources as the Scripps Institution of Oceanography and the NOAA Global Monitoring Laboratory. Their logos also appear, but the logos are decorative unless the source attribution is instructionally important.
Overall, the graph shows that atmospheric CO2 has increased substantially since 1958 while also following a predictable annual seasonal cycle.
Figure \(\PageIndex{2}\) is a pie chart illustrating the breakdown of U.S.A. carbon dioxide emissions in 2022 by the economic sector that produces them. The largest source of carbon dioxide emissions is the Transportation sector at 35%, emitted due to the combustion of fossil fuels for road vehicles, air travel, rail, and marine transport. The second leading source is Electricity at 30% resulting from the combustion of fossil fuels to generate power for homes, businesses, and industry. Industrial emission at 16% ranks third.

Figure \(\PageIndex{2}\) is a pie chart showing the percentage distribution of emissions by sector. Each slice represents a sector’s contribution to the total.
Sectors and values
The chart includes six labeled categories:
- Transportation – 35%
- Largest slice.
- Function: Primary contributor among all sectors.
- Electricity – 30%
- Second largest slice.
- Function: Major source of emissions, close to transportation.
- Industrial – 16%
- Moderate-sized portion.
- Function: Significant but smaller contributor than the top two.
- Residential & Commercial – 12%
- Smaller share.
- Function: Represents emissions from buildings and daily energy use.
- Other – 5%
- Small slice.
- Function: Minor contributors grouped together.
- Non-Energy Use of Fuels – 2%
- Smallest slice.
- Function: Minimal contribution compared to all other sectors.
Relative relationships (key comparisons)
- Transportation and electricity together make up 65% of total emissions, which is nearly two-thirds.
- Industrial and residential/commercial combined contribute 28%, representing secondary sources.
- The remaining categories (other and non-energy use) together contribute only 7%.
Methane
Methane (CH4) is a greenhouse gas contributing to about 18% of global warming and has been on the rise over the last several decades. Though methane makes up far less of the atmosphere (.0002%) than carbon dioxide, it is 20 times more potent than CO2 as a greenhouse gas. Methane is a product of the decomposition of organic matter, with major natural sources being that which occurs from wetlands, termites, the oceans, and hydrates.

Figure \(\PageIndex{3}\) is a pie chart showing the distribution of methane emissions by source category. Each slice represents a source and its percentage contribution to total methane emissions.
Sources and values
The chart includes eight labeled categories:
- Natural Gas and Petroleum Systems – 28%
- Largest share.
- Function: Primary source of methane emissions, related to extraction and distribution of fossil fuels.
- Enteric Fermentation – 25%
- Second largest share.
- Function: Methane produced during digestion in livestock.
- Landfills – 16%
- Moderate contribution.
- Function: Methane released from decomposition of waste.
- Manure Management – 9%
- Smaller portion.
- Function: Methane generated during storage and treatment of animal waste.
- Other – 9%
- Comparable to manure management.
- Function: Miscellaneous minor sources combined.
- Coal Mining – 6%
- Smaller contribution.
- Function: Methane released during coal extraction.
- Flooded Land – 6%
- Similar share to coal mining.
- Function: Methane produced in waterlogged soils, such as rice paddies.
- Other (LULUCF) – 2%
- Smallest share.
- Function: Methane from land use and land-use change processes.
Relative relationships
- The top two sources (natural gas/petroleum and enteric fermentation) together contribute 53%, which is over half of total methane emissions.
- Waste-related sources (landfills + manure management) together contribute 25%, matching the contribution of enteric fermentation alone.
- Smaller categories each contribute less than 10%, indicating more minor roles individually.
A major source of methane is from termites. Termites eat wood and produce methane as a result of the breakdown of cellulose in their digestive tracts. They are thought to be responsible for 11% of the methane in the atmosphere (some estimates are as high as 20% - 40%). The clearing of the rain forests greatly impacts termite populations and in turn the methane content of the atmosphere. When a patch of rain forest is cleared, termite populations explode due to the ample food source that is left behind.

Human activities have contributed to the rise of methane in our atmosphere. Landfills, rice paddy agriculture, natural gas systems, and livestock production appear to be significant contributors of anthropogenic sources of methane. Figure \(\PageIndex{3}\) illustrates a pie chart titled 'U.S. Methane Emissions, by Source' showing the distribution of human-related methane emissions in the United States in 2022. The largest source is the Agriculture sector (from livestock and manure management). The second largest source is the Energy and Industry sector (from natural gas and petroleum systems, and coal mining). The third largest source is Waste from Homes and Businesses (from landfills and wastewater). Figure \(\PageIndex{4}\) provides an image of women working in an Indian paddy field. In a paddy field the stagnant water facilitates anaerobic decomposition of organic matter resulting in the production of methane.
Ozone
Ozone (O3) is both beneficial and harmful to life on Earth. Much of the ozone in the atmosphere is found in the stratosphere. Here, ozone absorbs UV light from the Sun preventing it from reaching the surface. Without this blanket, humans would be exposed to serious sun burn and potential risk of skin cancer. Ozone is also found in the lowest layer of the atmosphere, the troposphere. Here ozone can act as an eye and respiratory irritant. Ozone also causes cellular damage inside the leaves of plants causing brown splotches, impairing carbon dioxide uptake and disrupting the photosynthetic apparatus. Such damage can cause economic losses through reduced crop yields. It also damages the carbon "sink" role of vegetation leaving more carbon dioxide in the atmosphere to enhance the greenhouse effect and potential global warming.
Human-produced compounds such as chlorofluorocarbons and halides containing chlorine and bromine destroy ozone, and have disrupted the fragile stratospheric ozone layer over Antarctica and the Arctic. Ozone depletion over Antarctica occurs during the spring when sunlight returns to the South Pole and the temperatures are still very cold.
Water Vapor
Water vapor is an extremely important gas found in the atmosphere. It can vary from 4% in the steamy tropics to nearly nonexistent in the cold dry regions of the Antarctic. Water vapor is a good absorber of Earth's outgoing radiation and thus is considered a greenhouse gas. When water vapor is converted to a liquid during condensation, clouds are formed. Clouds are good absorbers of radiation given off by the Earth's surface. The absorption of this energy raises the temperature of the air. But clouds are generally light-colored and hence reflect incoming solar radiation off their tops. The reflected light is sent back to space, never reaching the ground to warm the Earth. Thus clouds can have either a warming or a cooling effect on air temperature.
Particulates and Aerosols
Atmospheric particulates and aerosols are very small particles of solid or liquid suspended in the air. Particulates and aerosols play several important roles in atmospheric processes. Particulate matter includes dust, dirt, soot, smoke, and tiny particles of pollutants. Major natural sources of particulates are volcanoes, fires, wind-blown soil and sand, sea salt, and pollen. Human sources such as factories, power plants, trash incinerators, motor vehicles, and construction activity also contribute particulates to the atmosphere. Figure \(\PageIndex{5}\) illustrates the natural and human generated sources of aerosols. Salt present in sea spray and bursting bubbles from oceans provide aerosols to the atmosphere. Dust from deserts, sulphur di oxide from volcanoes and soot and smoke from burning fossil fuels and biomass all add aerosols to the atmosphere. From precipitation, once the water drops hit the ground, the aerosol particle it was carrying is washed out and removed from the atmosphere.
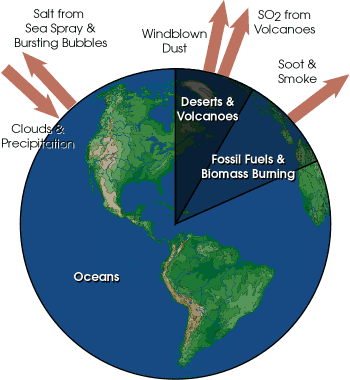
Figure \(\PageIndex{5}\) shows a global Earth diagram (Western Hemisphere view) illustrating sources of airborne particles (aerosols) and how they originate from both natural processes and human activities.
Main visual structure
- A circular image of Earth is shown, centered on North and South America.
- Arrows extend outward from different regions of the Earth, each labeled with a source of aerosols.
- A wedge-shaped section divides and labels two broad categories of sources.
Labeled categories and sources
1. Natural sources (left side of Earth) - These processes occur without human involvement:
- Oceans
- Largest labeled region on the left.
- Produces salt particles through sea spray and bursting bubbles.
- Function: Generates marine aerosols that enter the atmosphere.
- Clouds & Precipitation
- Label near the Earth’s surface.
- Function: Participate in cycling aerosols through condensation and removal.
- Windblown Dust
- Arrow pointing upward from land areas.
- Function: Wind lifts soil and dust into the air.
- Deserts & Volcanoes
- Shown in a labeled wedge section.
- Produces dust and volcanic emissions such as sulfur dioxide.
- Function: Major natural contributors of airborne particles.
- SO₂ from Volcanoes
- Arrow pointing upward.
- Function: Volcanic gases form aerosols in the atmosphere.
2. Human-related sources (right side of Earth) - These arise from human activities:
- Fossil Fuels & Biomass Burning
- Labeled wedge covering part of the right side.
- Function: Major anthropogenic source of particles released during combustion.
- Soot & Smoke
- Arrow pointing upward.
- Function: Fine particles produced from burning fuels and organic matter.
Arrows and their meaning
- All arrows point away from the Earth’s surface into the atmosphere.
- Function: Indicates that these sources release particles or gases that become aerosols in the air.
Relationships and key comparisons
- Both natural processes (oceans, dust, volcanoes) and human activities (fuel burning) contribute aerosols.
- Natural sources are spread across land, oceans, and geologic activity.
- Human sources are concentrated in processes involving combustion.
- The diagram groups sources to show that aerosols come from multiple interacting systems.
Particulates are very effective at altering the energy and moisture balances of the Earth system. Particulates diffuse sunlight reducing the amount and intensity of solar radiation reaching the Earth's surface. The most spectacular sunrises and sunsets are a result of light being refracted from particulates in the atmosphere. Particulates will also reflect sunlight back out to space, never letting it reach the surface. Decreasing significant amounts of incoming solar radiation can cause global temperatures to decrease. The eruption of Mt. Pinatubo in 1991 caused a .5o C decrease in global temperatures. However, particulates can absorb long wave radiation emitted by the Earth, causing the atmosphere to warm as well. Particulates serve as condensation nuclei for water. In order for water to change from a gas to a liquid, a nucleus upon which water vapor can attach itself is nearly always required. Without particulates, little water would condense to form clouds and precipitation.
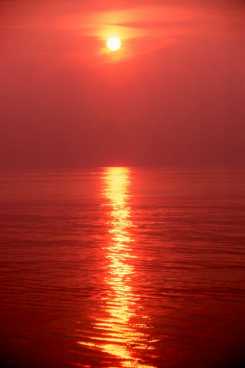
NASA scientists using satellite data and computer models found black soot from incomplete combustion may be contributing to changes in sea ice, snow and atmospheric temperatures near the North Pole. They found the timing and location of rising temperatures and loss of sea ice during the end of the 20th century is consistent with a significant rise in human produced aerosols. Their models suggest that one third of the soot comes from South Asia, one third from biomass burning, and the rest from Russia, Europe, and North America. Soot deposited on snow and sea ice decreases the surface reflectivity causing more sunshine to be absorbed. Airborne soot warms the Arctic atmosphere and affects weather patterns and clouds.
Assess you understanding of the preceding material by "Looking Back: Atmospheric Composition" or skip and continue reading
Assess your understanding of concepts related to this chapter section by answering the questions below before proceeding with this chapter. Click the "Answer" to reveal the correct answer.
Define homo sphere and hetero sphere
- Answer
-
Homo sphere: Sphere that lies between the surface and hetero sphere where gases are uniformly mixed. Hetero sphere: Outermost "sphere" of the atmosphere where gases are distributed into distinct layers.
List the "permanent (constant)" gases.
- Answer
-
nitrogen, oxygen, argon
Which greenhouse gas is more effective at heating the atmosphere, carbon dioxide or methane?
- Answer
-
Methane
Which gas filters UV light in the stratosphere, carbon dioxide, ozone, or methane?
- Answer
-
Ozone.
Soot increases or decreases reflectivity resulting in melting when deposited on snow?
- Answer
-
Decreases