

1.9: Future Geographies
- Page ID
- 39981

\( \newcommand{\vecs}[1]{\overset { \scriptstyle \rightharpoonup} {\mathbf{#1}} } \)
\( \newcommand{\vecd}[1]{\overset{-\!-\!\rightharpoonup}{\vphantom{a}\smash {#1}}} \)
\( \newcommand{\dsum}{\displaystyle\sum\limits} \)
\( \newcommand{\dint}{\displaystyle\int\limits} \)
\( \newcommand{\dlim}{\displaystyle\lim\limits} \)
\( \newcommand{\id}{\mathrm{id}}\) \( \newcommand{\Span}{\mathrm{span}}\)
( \newcommand{\kernel}{\mathrm{null}\,}\) \( \newcommand{\range}{\mathrm{range}\,}\)
\( \newcommand{\RealPart}{\mathrm{Re}}\) \( \newcommand{\ImaginaryPart}{\mathrm{Im}}\)
\( \newcommand{\Argument}{\mathrm{Arg}}\) \( \newcommand{\norm}[1]{\| #1 \|}\)
\( \newcommand{\inner}[2]{\langle #1, #2 \rangle}\)
\( \newcommand{\Span}{\mathrm{span}}\)
\( \newcommand{\id}{\mathrm{id}}\)
\( \newcommand{\Span}{\mathrm{span}}\)
\( \newcommand{\kernel}{\mathrm{null}\,}\)
\( \newcommand{\range}{\mathrm{range}\,}\)
\( \newcommand{\RealPart}{\mathrm{Re}}\)
\( \newcommand{\ImaginaryPart}{\mathrm{Im}}\)
\( \newcommand{\Argument}{\mathrm{Arg}}\)
\( \newcommand{\norm}[1]{\| #1 \|}\)
\( \newcommand{\inner}[2]{\langle #1, #2 \rangle}\)
\( \newcommand{\Span}{\mathrm{span}}\) \( \newcommand{\AA}{\unicode[.8,0]{x212B}}\)
\( \newcommand{\vectorA}[1]{\vec{#1}} % arrow\)
\( \newcommand{\vectorAt}[1]{\vec{\text{#1}}} % arrow\)
\( \newcommand{\vectorB}[1]{\overset { \scriptstyle \rightharpoonup} {\mathbf{#1}} } \)
\( \newcommand{\vectorC}[1]{\textbf{#1}} \)
\( \newcommand{\vectorD}[1]{\overrightarrow{#1}} \)
\( \newcommand{\vectorDt}[1]{\overrightarrow{\text{#1}}} \)
\( \newcommand{\vectE}[1]{\overset{-\!-\!\rightharpoonup}{\vphantom{a}\smash{\mathbf {#1}}}} \)
\( \newcommand{\vecs}[1]{\overset { \scriptstyle \rightharpoonup} {\mathbf{#1}} } \)
\(\newcommand{\longvect}{\overrightarrow}\)
\( \newcommand{\vecd}[1]{\overset{-\!-\!\rightharpoonup}{\vphantom{a}\smash {#1}}} \)
\(\newcommand{\ket}[1]{\left| #1 \right>}\)
\(\newcommand{\bra}[1]{\left< #1 \right|}\)
\(\newcommand{\braket}[2]{\left< #1 \vphantom{#2} \right| \left. #2 \vphantom{#1} \right>}\)
\(\newcommand{\braopket}[3]{\left< #1 \vphantom{#2}\vphantom{#3} \right| #2 \vphantom{#1}\vphantom{#3} \left| #3 \vphantom{#1}\vphantom{#2} \right>}\)
\(\newcommand{\qmvec}[1]{\mathbf{\vec{#1}}}\)
\(\newcommand{\op}[1]{\hat{\mathbf{#1}}}\)
\(\newcommand{\expect}[1]{\langle #1 \rangle}\)
\(\newcommand{\dfn}[1]{\emph{\textbf{#1}}}\)
The Geographer's Role in Understanding Environmental Change
During the summer of 2005, the United States was pounded by a record number of hurricanes, some the most intense to ever strike the mainland. The southwest desert of the United States continues in the grip of one of the longest periods of drought. For the first time in centuries, the fabled arctic northern route is open between North America and Asia. Are these events caused by climate change due to global warming? If so, the future physical geography of planet Earth may be drastically and irreversibly changed if current global warming predictions are realized.
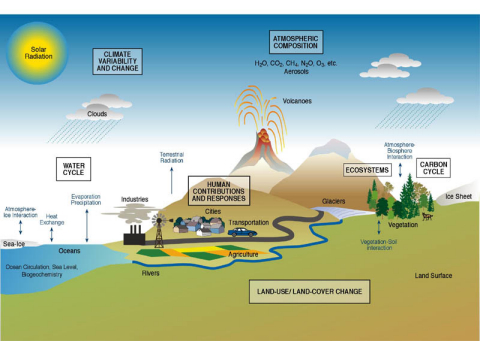
Figure \(\PageIndex{1}\) is a conceptual diagram of interconnected Earth systems. It shows a landscape that includes oceans, rivers, land, vegetation, mountains, glaciers, and the atmosphere above. Arrows and labels indicate processes linking different systems.
The water cycle is shown with evaporation from oceans, cloud formation, and precipitation falling onto land. The carbon cycle appears on the right, with arrows connecting vegetation, soil, and the atmosphere to show carbon movement. The atmosphere is labeled with components such as carbon dioxide, methane, and aerosols, while solar radiation and terrestrial radiation illustrate energy flow into and out of Earth.
Human activities—including cities, industry, transportation, and agriculture—are shown influencing land use and atmospheric processes. Additional features such as volcanoes, glaciers, and ecosystems highlight natural processes that interact with climate and environmental change.
The diagram demonstrates how Earth’s systems are interconnected and how both natural processes and human activities influence climate variability, land use, and environmental change.
Environmental change caused by global warming involves a complex set of interactions between the subsystems of the Earth system and human activities. Figure \(\PageIndex{1}\) illustrates some of the major components needed to understand the climate systems and climate change. These interactions vary across geographic scales. The timing and impact of future warming will not be the same for all regions of the Earth. Research methodologies that consider place and scale are therefore essential in understanding future environmental changes.
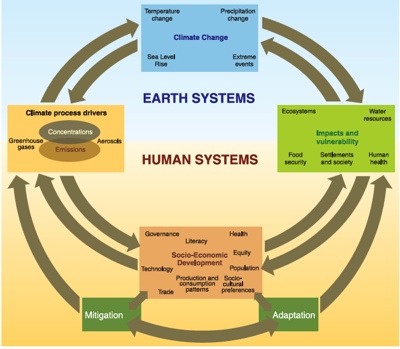
Figure \(\PageIndex{2}\) is a circular systems diagram showing interactions between Earth systems and human systems. At the top, a box labeled “Climate Change” includes factors such as temperature change, precipitation change, sea level rise, and extreme events. This box connects to both Earth systems and human systems.
On the left, a box labeled “Climate Process Drivers” includes greenhouse gases, aerosols, and emissions. On the right, a box labeled “Impacts and Vulnerabilities” includes ecosystems, water resources, food security, settlements, and human health.
At the bottom center, a box labeled “Human Systems” includes governance, technology, population development, socio-economic factors, and trade. Two pathways labeled “Mitigation” and “Adaptation” connect human systems back to climate processes and impacts.
Large circular arrows surround the diagram, showing feedback loops between these components. These arrows indicate that changes in one system influence others and that responses from human systems can either reduce or adjust to climate change effects.
The diagram demonstrates how climate change is driven by human and natural processes, how it affects environmental and social systems, and how mitigation and adaptation strategies can influence future outcomes.
The continuum of geography permits a holistic view of Earth systems analysis. Geographers are therefore perfectly positioned to answer questions concerning global warming and environmental change. Geographers are engaged in all aspects of environmental change research, from field monitoring glacier movements to computer modeling of future climates. Straddling both social and physical sciences, geographers play an important role in unwinding the social and economic drivers behind climate change.Figure \(\PageIndex{2}\) illustrates the complex relationship between anthropogenic drivers (human activities) and their impacts on ecosystem services and human well-being. This chart is a model of the human-environment system, highlighting how our actions at various scales reverberate through the natural world and back to us. In essence, the flow chart depicts a cause-and-effect relationship where human activities (drivers) lead to environmental changes (processes), which in turn impact both natural systems and human society (consequences). It's a powerful visual tool that encapsulates a core theme in geography: understanding the interconnectedness of human and physical systems. It serves as a stark reminder that our actions have global and often long-term consequences.
Observing Environmental Change
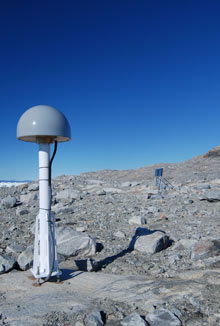
Geographers bring their unique talents to recording changes in Earth systems. Geographical positioning systems (GPS) provide precise measurements of environmental change. For example, isostatic rebound of the Earth's surface after the last ice age complicates measurements of melt from the expansive ice sheets that cover present-day Greenland and Antarctica. Recently, several GPS stations were deployed around the Greenland ice sheet to measure minute changes in Earth surface elevation as a result of rebound. This data is being combined with that from sensors measuring elevation changes, glacial outflow rates and the mass balance to provide a more complete assessment of the sheets' melting. Figure \(\PageIndex{3}\) shows a GPS station installed near Ilulissat to measure Earth's crustal rebounds caused by melting of ice sheets.
Databases for analyzing the effects of climate change are large and complex. As databases documenting environmental changes across the Earth are developed, geographers will provide the tools for teasing out spatial and temporal signals in the observations. Geographic Information Systems are well-suited for handling complex databases to map the potential spread of diseases, ecosystem changes, and sea-level rise as a result of global warming.
Analyzing Environmental Change
Geographer's have a number of tools and skills to analyze impact of environmental change on Earth systems. Geographers are actively engaged in projects to identify and understand patterns of deforestation and habitat fragmentation. Geographer Eric Larsen has studied the decline of aspen trees in Yellowstone for several years. Though climate change was first suspected, he and ecologist William Ripple, realized that aspens outside the park flourished. If climate change was responsible, trees inside and outside the park would have suffered a decline. Analyzing cores from trees within the park, they found that most were 70 years old, aspens had apparently stopped regenerating around the 1930s.

Between the late 1880s until the mid-1900s, more than bounty hunters killed 100,000 wolves in Wyoming and Montana. By the 1970s, the wolf was classified as an endangered species. A controversial reintroduction program brought 31 gray wolves back to the Yellowstone ecosystem. It appears that the removal of a top predator, allowed browsing elk populations to flourish and devastate young aspens. With the reintroduction, diversity and stability of the ecosystem appears to be on the rise.
Explaining Environmental Change
Geographers can play a significant role in hypothesis and theory development. Geographers are particularly suited for building numerical models of the complex coupling between the Earth's surface and atmosphere above. Their strong field orientation and integrated methods will help hone the parametrization of climate models.
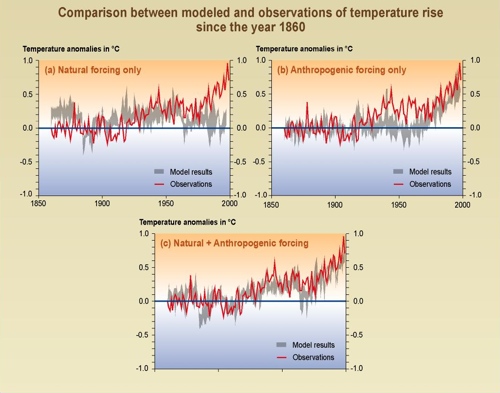
Figure \(\PageIndex{5}\) contains three line graphs titled “Comparison between modeled and observations of temperature rise since the year 1860.” Each graph plots temperature anomalies in degrees Celsius over time, from about 1850 to 2000, with values ranging from about negative 1.0 to positive 1.0.
The first graph shows natural forcing only, where model results and observed data do not match closely, especially in the later years when observed temperatures rise more steeply.
The second graph shows anthropogenic forcing only, where model results better follow the increasing trend seen in observations, though with some differences.
The third graph combines natural and anthropogenic forcing, where model results closely align with observed temperature increases, especially after about 1950.
In all graphs, a red line represents observed temperatures, and a gray shaded line represents model results. The comparison demonstrates that models including human influences best explain the observed rise in global temperatures, supporting the conclusion that human activity contributes significantly to climate change.
Geography's human-environment tradition provides a foundation for answering some of the most vexing issues of the global warming. The crux of the global warming issue is identifying the "fingerprint" of human activities in creating the enhanced greenhouse effect. For example, models like the ones shown in Figure \(\PageIndex{5}\) attempt to explain the warming experienced over the last several decades using only natural factors fail to adequately explain the actual pattern temperature. When human factors that influence warming are added, a much better correspondence with reality is uncovered.
Because geography uniquely straddles both physical and social sciences, geographers play an important role will play a role in future policy formulation and decision making. Geographers are well-suited for evaluating the costs and benefits of various global warming mitigation strategies.
Predicting Environmental Change
Climate models have demonstrated that the impact of global warming will vary across the Earth. Geographers have been at the forefront of predicting the potential changes that our environment will undergo. Based on recent analyses, Geographer Jack Williams found that, we're headed for major change -- fast. He suggests areas that currently have a tropical climate will become warmer, pushing vegetation and animal life northward. Williams believes these changes will lead to the spread of insect-borne diseases like Malaria, increased catastrophic natural disasters and greater risks to human well-being. Temperatures rising just a few degrees will affect where particular plant and animal species will thrive. The question is if they will be able to migrate or adapt to a rapidly changing climate. If not, some face extinction.
Williams work predicts that many current climates may entirely vanish by the year 2100. He foresees "no-analog" communities of plants and animals arising from "novel" climates. No-analog communities consist of species that exist today but in different combinations from those presently inhabiting the Earth. The species exist today, they have just been "reshuffled" into new combinations not found at the present. Such no-analog combinations have been found recorded in fossil pollen assemblages extracted from lake sediments dating from the late-glacial periods in North America. These seemingly odd past combinations of species are thought to be a product of "novel" or no-analog climates, characterized by higher-than-present temperature seasonality. Professor Williams recognizes that with current trends in global warming, such new communities of species may be in our future. His climate models project the disappearance of many existing climates in tropical highlands and near the poles. Large swaths of the tropics and subtropics may develop new climates unlike anything seen today.
In coming chapters we'll examine the future geography of Earth as predicted by geoscientists of all kinds and particularly physical geographers. You'll explore how Earth's gaseous composition is predicted to change, how and where temperature changes occur, the impact of rising oceans, and the displacement of ecosystems. Though dire conditions are predicted, the challenges posed can be addressed and geographers will be at the forefront.