

1.6.2: Geographical Zones
- Page ID
- 39979

\( \newcommand{\vecs}[1]{\overset { \scriptstyle \rightharpoonup} {\mathbf{#1}} } \)
\( \newcommand{\vecd}[1]{\overset{-\!-\!\rightharpoonup}{\vphantom{a}\smash {#1}}} \)
\( \newcommand{\dsum}{\displaystyle\sum\limits} \)
\( \newcommand{\dint}{\displaystyle\int\limits} \)
\( \newcommand{\dlim}{\displaystyle\lim\limits} \)
\( \newcommand{\id}{\mathrm{id}}\) \( \newcommand{\Span}{\mathrm{span}}\)
( \newcommand{\kernel}{\mathrm{null}\,}\) \( \newcommand{\range}{\mathrm{range}\,}\)
\( \newcommand{\RealPart}{\mathrm{Re}}\) \( \newcommand{\ImaginaryPart}{\mathrm{Im}}\)
\( \newcommand{\Argument}{\mathrm{Arg}}\) \( \newcommand{\norm}[1]{\| #1 \|}\)
\( \newcommand{\inner}[2]{\langle #1, #2 \rangle}\)
\( \newcommand{\Span}{\mathrm{span}}\)
\( \newcommand{\id}{\mathrm{id}}\)
\( \newcommand{\Span}{\mathrm{span}}\)
\( \newcommand{\kernel}{\mathrm{null}\,}\)
\( \newcommand{\range}{\mathrm{range}\,}\)
\( \newcommand{\RealPart}{\mathrm{Re}}\)
\( \newcommand{\ImaginaryPart}{\mathrm{Im}}\)
\( \newcommand{\Argument}{\mathrm{Arg}}\)
\( \newcommand{\norm}[1]{\| #1 \|}\)
\( \newcommand{\inner}[2]{\langle #1, #2 \rangle}\)
\( \newcommand{\Span}{\mathrm{span}}\) \( \newcommand{\AA}{\unicode[.8,0]{x212B}}\)
\( \newcommand{\vectorA}[1]{\vec{#1}} % arrow\)
\( \newcommand{\vectorAt}[1]{\vec{\text{#1}}} % arrow\)
\( \newcommand{\vectorB}[1]{\overset { \scriptstyle \rightharpoonup} {\mathbf{#1}} } \)
\( \newcommand{\vectorC}[1]{\textbf{#1}} \)
\( \newcommand{\vectorD}[1]{\overrightarrow{#1}} \)
\( \newcommand{\vectorDt}[1]{\overrightarrow{\text{#1}}} \)
\( \newcommand{\vectE}[1]{\overset{-\!-\!\rightharpoonup}{\vphantom{a}\smash{\mathbf {#1}}}} \)
\( \newcommand{\vecs}[1]{\overset { \scriptstyle \rightharpoonup} {\mathbf{#1}} } \)
\(\newcommand{\longvect}{\overrightarrow}\)
\( \newcommand{\vecd}[1]{\overset{-\!-\!\rightharpoonup}{\vphantom{a}\smash {#1}}} \)
\(\newcommand{\ket}[1]{\left| #1 \right>}\)
\(\newcommand{\bra}[1]{\left< #1 \right|}\)
\(\newcommand{\braket}[2]{\left< #1 \vphantom{#2} \right| \left. #2 \vphantom{#1} \right>}\)
\(\newcommand{\braopket}[3]{\left< #1 \vphantom{#2}\vphantom{#3} \right| #2 \vphantom{#1}\vphantom{#3} \left| #3 \vphantom{#1}\vphantom{#2} \right>}\)
\(\newcommand{\qmvec}[1]{\mathbf{\vec{#1}}}\)
\(\newcommand{\op}[1]{\hat{\mathbf{#1}}}\)
\(\newcommand{\expect}[1]{\langle #1 \rangle}\)
\(\newcommand{\dfn}[1]{\emph{\textbf{#1}}}\)
Natural systems of climate, vegetation, and soil change substantially as one travels from the equator to the pole due largely to the latitudinal variation in energy input to the Earth system. The early Greek scholar Aristotle was the first to divide the Earth into zones based on climate as shown in Figure \(\PageIndex{1}\) based on the intensity of solar rays. His "torrid zone" which lay between 23.5o N and 23.5o S, thought to be too hot for human habitation. Aristotle thought that the "temperate zones" between 23.5o N - 66.5o N and 23.5o S - 66.5o S were the only livable zones. From the arctic (66.5o N) and antarctic circles (66.5o S) to the poles (90o N and S) were the uninhabitable "frigid zones". Figure \(\PageIndex{1a}\) provides an illustration of these zones.
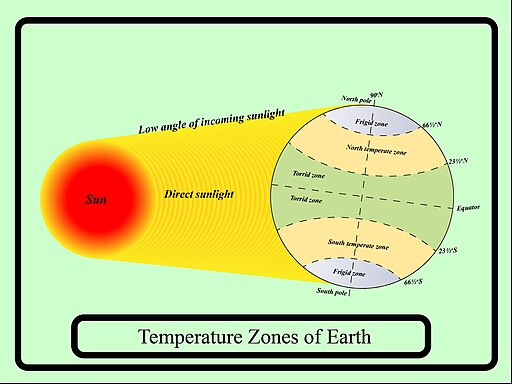
Figure \(\PageIndex{1}\) shows Earth divided into temperature zones based on how sunlight reaches the surface. Direct sunlight strikes the region near the equator, creating the warm tropical, or torrid, zone. Farther from the equator, sunlight reaches Earth at a lower angle, producing the cooler temperate zones. Near the poles, sunlight is least direct, creating the coldest frigid zones. The diagram uses important latitude lines to mark these regions, including:
- the Equator
- the Tropic of Cancer
- the Tropic of Capricorn
- the Arctic Circle
- the Antarctic Circle
Zone breakdown:
- Tropical or torrid zone: located around the equator, between the Tropic of Cancer and the Tropic of Capricorn
- North and South Temperate Zones: located between the tropics and the polar circles
- North and South Frigid Zones: located within the Arctic and Antarctic Circles near the poles

Figure \(\PageIndex{2}\) is a world map that highlights the torrid zone, the warm region of Earth located between the Tropic of Cancer in the Northern Hemisphere and the Tropic of Capricorn in the Southern Hemisphere. The illustrated area forms a horizontal band around the middle of the globe, centered on the equator. It includes parts of:
- Central America and northern South America
- Central and southern Africa
- South and Southeast Asia
- Northern Australia
- Tropical islands in the Atlantic, Pacific, and Indian Oceans
Geographers continue to use latitudinal variation of climate characteristics as a way of dividing the Earth into fairly homogeneous geographical zones. These zones are:
Equatorial: 10o N - 10o S
- Tropical: 10oN - 25oN and 10oS - 25oS
- Subtropical: 25oN - 35oN and 25oS - 35oS
- Midlatitude: 35oN - 55oN and 35oS - 55oS
- Subarctic: 55oN - 60oN
- Subantarctic: 55oS - 60oS
- Arctic: 60oN - 75oN
- Antarctic: 60oS - 75oS
- North Polar: 75oN - 90oN
- South Polar: 75oS - 90oS
The equatorial zone is characterized by warm temperatures and nearly uniform day length throughout the year. The boundary of the tropical zone lies close to the Tropic of Cancer (23.5oN) and Capricorn (23.5oS), the latitudinal limit where the Sun is directly overhead at noon at different times of the year. The subtropical zone includes Aristotle's home of Greece, and seasonal changes in temperature become more pronounced. The temperate midlatitudes zone is noted for it's variable weather conditions. Large annual swings in temperature are characteristic of the subarctic and subantarctic zone where extensive areas of cold air form during winter and milder conditions prevail during summer. The coldest zones are the Arctic and Antarctic, where the Sun never rises above the horizon for several months at a time. Much of the light that does reach the surface is reflected off the light colored surfaces of the North (sea ice) and South (mostly glacial ice) poles. The coldest zones are the North and South Polar. Like the Arctic and Antarctic Zones, the Sun never rises above the horizon for many months of the year. The coldest temperatures are near the South Pole, far from any moderating influence of an ocean and the little light that does make it to the surface is reflected from glacier ice.