
4.1: Overview
- Page ID
- 7004

The map below is a seismic hazard map of the continental United States produced by the USGS. The red bull's eye covering the bootheel of Missouri is the New Madrid Seismic Zone. In this lesson, we will learn about the 1811-12 earthquake sequence in the New Madrid Seismic Zone and discuss the controversy regarding the extent of seismic risk in the central United States today. We will learn how to estimate earthquake recurrence interval using a variety of methods.
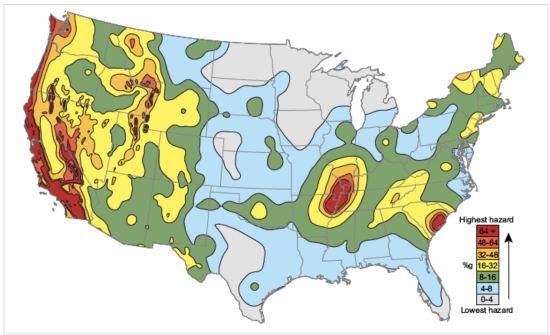
Credit: Gomberg, J., & Schweig, E. (2002). Earthquake hazard in the heart of the homeland. Fact Sheet - U. S. Geological Survey, 4pp.
Video: USGS Seismic Hazard Maps Explained (1:05)
- USGS Seismic Hazard Maps Explained
- Click here for the transcript of USGS Seismic Hazard Maps Explained.
-
PRESENTER: This is a seismic hazard map of the continental US produced by the US Geological Survey. There's two types of data that go into making a map like this. And one is knowledge of where earthquakes happen. The second is knowledge of how far away you can feel shaking from any given earthquake. How far away you can feel shaking is a function of both the size of the earthquake and also some characteristics of the rocks in that area of the country.
Now, the colors denote the level of horizontal shaking that is calculated to have a 1 in 50 chance of being exceeded in a 50-year period. And the colors are all percentages of little g, where little g is 9.8 meters per second squared.
So for the next three weeks, we will explore why the [INAUDIBLE] seismic zone, which is right here, has a color that is just as high as the West Coast of the United States over here. So this is far away from a plate boundary. Why is the seismic hazard so high there?Credit: Dutton
About Lesson 4
Most people on the West Coast of the United States who live near faults or volcanoes (or both) are somewhat familiar with the risks involved with these phenomena. Far fewer East Coast dwellers have felt an earthquake. However, the central U.S. is actually fairly seismically active for a continental interior. This region has experienced large earthquakes in the past and these may happen again. How should residents of this area plan for a potential earthquake hazard? In this lesson, we will explore intraplate seismicity and the New Madrid region in particular. We'll use seismic catalogs to estimate earthquake recurrence interval and we'll discuss the scientific controversy surrounding the potential for large earthquakes in this region.
What will we learn in Lesson 4?
By the end of Lesson 4 you should be able to:
- Describe the cyclical process of strain accumulation, earthquake generation, and post-seismic relaxation along plate boundaries.
- Define "recurrence interval."
- Explain ways in which recurrence interval is estimated for a given fault, and compare the inherent uncertainties with each method.
- Explain the basic mathematical and physical tenets of plate tectonics.
- Summarize various hypotheses for the existence of seismicity away from plate boundaries.
- Describe the 1811–1812 sequence of large events on the New Madrid Seismic Zone and explain how scientists have determined the properties of these events.
- Describe potential hazards/consequences of a sequence similar to the 1811–1812 sequence occurring today.
- Construct a frequency-magnitude plot using earthquake catalog data
- Compare frequency-magnitude diagrams for intraplate regions, plate boundary regions, and global datasets
- Extrapolate from a frequency-magnitude diagram to estimate an earthquake recurrence interval
- Analyze a collection of various datasets to compare their predictions of seismic hazard at New Madrid.
What is due for Lesson 4?
Lesson 4 will take three weeks to complete. 9 -29 Oct 2019. You will complete reading assignments by the end of the first week. You'll submit the data analyses at the end of the second week. The team reading and discussion assignments will take place over the second week. The whole class paper discussion and the teaching and learning discussion will take place during the third week. The fact sheet paper is due at the end of the third week. See the table below for complete details.
Lesson 4 Assignments
| Requirement | Submitted for Grading? | Due Date |
|---|---|---|
| Reading: "The Mississippi Valley Earthquakes of 1811 and 1812: Intensities, Ground Motion, and Magnitudes" | No | 15 Oct (end of 1st week) |
| Reading: "Earthquake hazard in the heart of the homeland" | No | 15 Oct (end of 1st week) |
| Reading: "Earthquake hazard in the heart of the homeland" | No | 15 Oct (end of 1st week) |
| Problem set: Earthquake catalog data analyses | Yes - Submitted to "Earthquake catalog problem set" assignment in Canvas | 22 Oct (end of 2nd week) |
| Reading/Discussion: "Debating hazard at New Madrid" | Yes - Graded group discussion in Canvas | participation spanning 16 - 22 Oct (2nd week) |
| Reading/Discussion: "Debating hazard at New Madrid" | Yes - Graded whole-class discussion in Canvas | participation spanning 23 - 29 Oct (3rd week) |
| Paper: NMSZ Fact Sheet paper | Yes - Submitted to the "Fact Sheet Paper" assignment in Canvas | 29 Oct (end of 3rd week) |
| Discussion: "Teaching and Learning About Earthquakes" | Yes - Submitted to the "Fact Sheet Paper" assignment in Canvas | participation spanning 23 - 29 Oct (3rd week) |
Questions?
If you have any questions, please post them to our Questions? discussion forum (not e-mail). I will check that discussion forum daily to respond. While you are there, feel free to post your own responses if you, too, are able to help out a classmate.