
4.4: The Climate is always changing
- Page ID
- 11089
So, climate is always changing, at least on time scales of hundreds of thousands of years. Can the orbital mechanism explain the recent warming?
No, because the Milanković forcing, that is, the response of climate due to cyclical changes in Earth’s orbit, is headed downward now, and the planet should be cooling. This cooling is illustrated in Figure \(\PageIndex{1}\), which zooms in on the last 2000 years of temperatures in the Arctic, deduced using not just one but several proxies for temperature. (Note that the last 2000 years is a tiny, tiny spec on the far right side of Figure 4.2.1, so that part of the figure is greatly magnified in Figure \(\PageIndex{1}\).) The Arctic is a good place to look, because, as is clear in Figure 4.1.2 and from basic climate physics, climate signals are amplified at high latitudes.
2000 Years of Arctic Summer Temperature
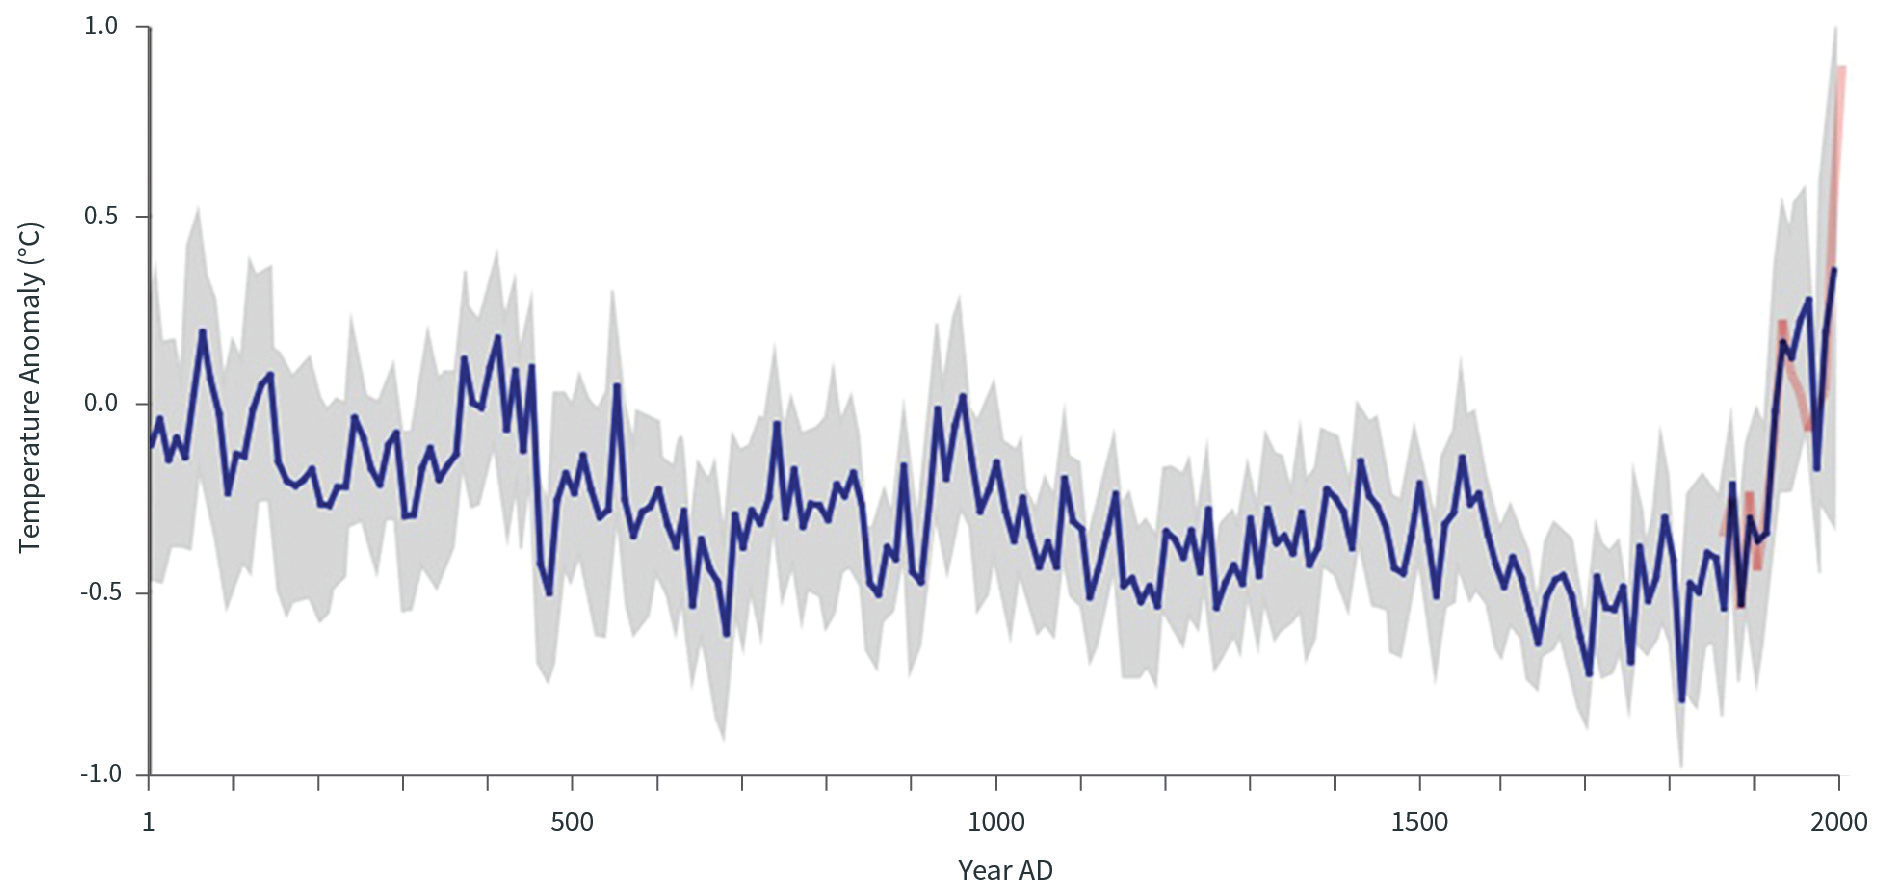
The slow, steady cooling trend from the beginning of the record to around AD 1700–1800 probably reflects the slow decline in sunlight reaching the Arctic due to the Milanković orbital mechanism. Unimpeded, this mechanism would lead the earth toward another ice age, with continental ice sheets beginning to grow some thousands of years from now. But note the strong uptick in temperature toward the end of the record, particularly after about 1900. This is quite unusual by the standards of the last few thousand years and reflects the anthropogenic increase in carbon dioxide brought about by rapid consumption of fossil fuels.
Besides chemical proxies for temperature, there are physical proxies as well. Most of the world’s alpine glaciers are retreating, and the snows of Kilimanjaro, about which Hemingway wrote so movingly, are on the verge of disappearing for the first time in at least 11,700 years.