
6.2: Earthquake Magnitude
- Page ID
- 3548

In order to measure the size and intensity of earthquakes, we have devised several scales to measure them. The Richter Magnitude scale is one such scale that you have likely heard of.
One issue with measuring earthquakes is that as the waves propagate, the energy is spread out over more area.
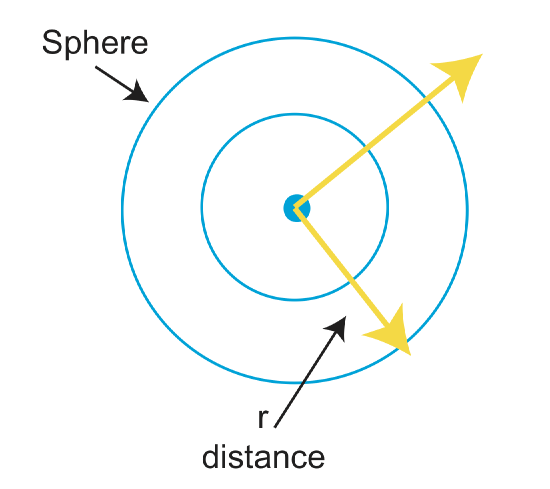
As \(\frac{E}{Area}\downarrow\), the amplitude decreases with distance. So how do we get around this problem? We discovered that amplitude \(\propto\) the initial energy of the earthquake. Thus, we can measure earthquake size/magnitude. Charles Richter took this principle and devised a magnitude scale to relate amplitude of seismic waves to 'size' of the event. This scale takes into account distance from the source and instrument response. The Richter scale is based off of using a particular seismometer, the Wood-Anderson seismometer. The scale was developed to work best only in Southern California, and can not accurately measure earthquakes above a 6.8. To get an idea of how the Richter scale measures earthquakes, look at the figure below.
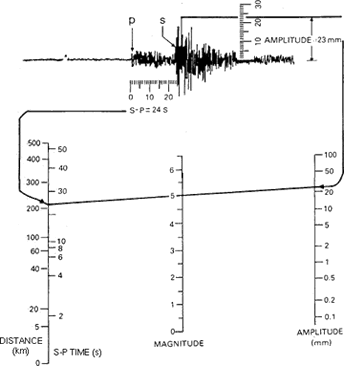
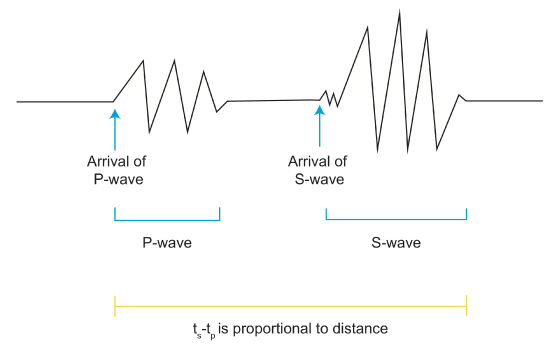
First, we measure the amplitude. Then, we also know that the difference in arrival times between the P and S waves is proportional to the distance, ie ts-tp \(\propto\) distance. So we next measure the ts-tp \(\propto\) distance. Then, draw a line between the amplitude and the distance. The line will cross a point on the Richter magnitude scale and give the approximate earthquake size. The actual equation for determining Richter magnitude is:
\[M_L=log_{10}A-log_{10}A_0(\delta)=log_{10}[\frac{A}{A_0(\delta)}]\]
where A is the maximum excursion of the Wood–Anderson seismograph and A0 depends on the distance of the station from the epicenter (\(\delta\)).
Logarithm Review
Logarithms are useful for looking at really large data sets (like earthquakes). In case its been a while since you last dealt with logarithms, here is a quick review.
\[\log_{10}y=x \nonumber\]
The 10 is the base of the logarithm, and 'base 10' is the most common base for a logarithm. The above equation can also be written as
\[10^x=y\nonumber\]
where x becomes the power of 10. Another example of rewriting logarithms:
\[ \begin{align*} \log_{10}(100) &=y \\[4pt] 10^y &=100 \\[4pt] y&=2 \end{align*}\]
We could also go the other direction and solve with a calculator:
\[ \begin{align*} 10^y &=980 \\[4pt] \log_{10}(980) &=y \\[4pt] y&=2.99 \end{align*}\]
A basic log vs log plot looks like this:
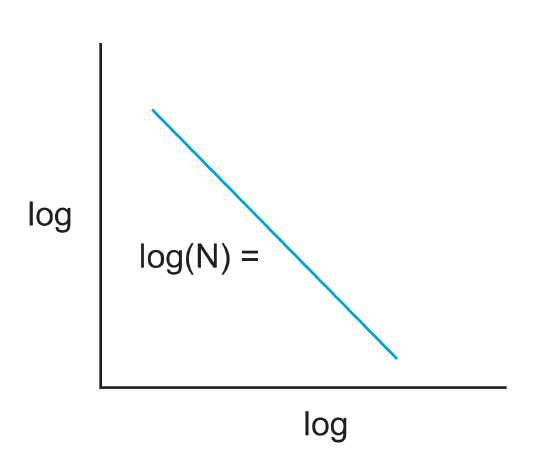
Using a log scale when plotting is very useful when modeling frequency-magnitude relationships as we will see in section 6.4.
The Richter scale both logarithmic and 'empirical'. Empirical means that it is chosen to fit a range of observation of both very small and very large earthquakes. The fact that the scale is logarithmic indicates that there is an order of magnitude difference between each number. A 0 magnitude would have a relative size (energy) of 100, a 5 would have 105 energy, and an 8 would have 108 energy. Thus you can see that an increase by even one order of magnitude, like from a 7 to 8, is a 32-fold increase in energy.
Another problem we have in measuring earthquakes is how to compare the physical size rupture area from the aftershocks and the surface rupture. The magnitude stopped increasing because big earthquakes put more energy into the surface waves and therefore the energy in S waves does not continue to increase as the size of the earthquake grows. We need to measure all the energy in order to get an accurate measure of the size of the earthquake. To solve this problem, we need to integrate the full seismogram (sum up all the energy) and then match the Richter magnitude scale for moderate sized earthquakes. We can also relate this magnitude to the physical size of the earthquake, in terms of the rupture area, and something else, called moment. Moment is literally a torque.
\[\tau=F\cdot l\]
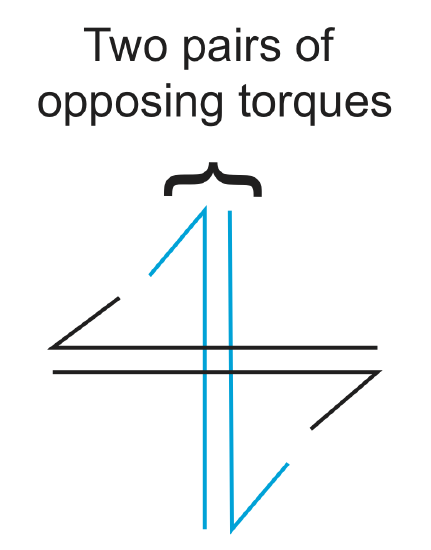
An earthquake can be thought of as two pairs of opposing torques.
For earthquakes, the physical moment can be written as
\[m_o=\mu A\cdot D\]
where \(\mu\) is the rock rigidity (usually ~ 30 GPa), \(A\) is the fault area that slipped, and \(D\) is the average slip. The famed seismologist Hiroo Kanamori took these principals to create a new magnitude scale, the Moment magnitude scale.
\[M_w=\frac{2}{3}(log(M_o)-10.7)\]
\(M_o\) integrates seismogram data and relates to physical size of the earthquake. Instead of solving for \(M_w\), we can also solve for \(M_o\).
\[M_o=10^{\frac{3}{2}M_w+10.7}\]
The Mw is what is most commonly reported however. The largest recorded earthquake in history (since 1900) is a Mw 9.5, which occurred in Chile in 1960. The earthquake lasted nearly 10 minutes.
Example Expected Magnitude
Here is an example to get you thinking about the concepts we have just discussed.
If I have a fault of A=100 km2 and D=5 m, where \(\mu\)=30 GPa, what is the expected magnitude?
Or given Mw and A from aftershocks, determine the amount of slip.
Try to answer these questions now and we will go over them in class.