1.2: Strain and Strain Rate
- Page ID
- 11606

Supporting Topics
Prior to reading the page, please review the following topics if you are unfamiliar with them.
Resources for each topic can be found here: Supporting Topics
Math/Calculus
- Converting Degrees to Radians
- arctan vs arctan2
In introductory physics we learn to relate the forces applied to an object to the resulting displacement or velocity of the object, but we do not consider how an object deforms internally in response to the applied forces. To understand how rocks deform through the slow movement of tectonic plates, or rapid movement occurring during an earthquake, we need to consider the internal deformation of the rocks. Given an applied stress, the amount of deformation that an object experiences depends on the material properties of the object and the orientation of the applied stresses. The final deformation of the object depends on how fast the deformation occurs and for how long. In this section you will learn how to described the internal deformation of a rock in terms of the components of strain, and how to describe the rate of deformation occurring in terms of the strain-rate.
Strain
When a stress is applied to an object (a rock, the crust, the lithosphere), the material deforms or squishes. Think again of squeezing an eraser between your fingers. You can feel the eraser give a little bit. While rocks appear perfectly rigid, the stresses acting in the Earth are large enough that they also cause rocks to deform internally. This internal deformation is called strain. Strain is a measure of the change in shape or size of an object relative to its original shape or size.
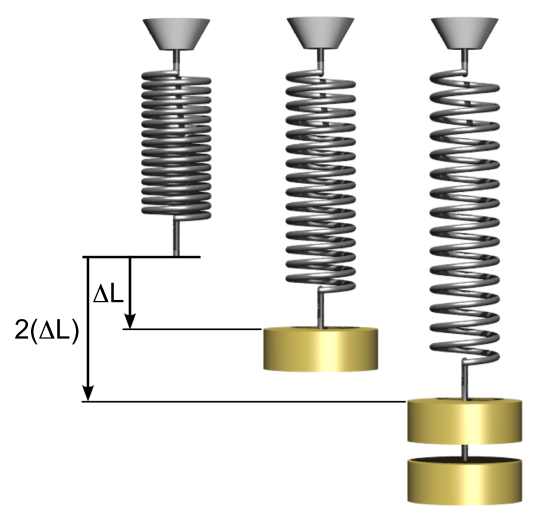
For example, the change in length of a spring, \(\Delta L\) relative to the original length of the spring, \(L\) describes the strain of the spring, \(\epsilon = \Delta L/ L\). Both \(\Delta L\) and \(L\) must be measured in the same units (e.g., cm or mm). Notice that the strain, \(\epsilon\) has units of meters divided by meters, so it ends up without physical units. Strain is also sometimes given the symbol, \(e\) instead of the greek symbol, epsilon, \(\epsilon\).
Normal (Linear) Strain
Normal strain occurs perpendicular to the sides of an object, similar to normal stress. It describes the change in length of the object in one direction relative to the original length of the object in the same direction,
\[\epsilon =\frac{l_f-L}{L}=\frac{\Delta L}{L}\]
where \(L\) is the original length of the material and \(l_f\) is the final length. Normal strain is also referred to as linear strain or elongation. If the final length of the object is smaller than the original object, then the strain is a negative number between 0- and -1, and the object has undergone shortening. If the final length of the object is greater than the original object, then the strain is a positive number in the range of 0+ and infinity, and the object has undergone stretching.
The linear strain is also often expressed as a percent strain given by \(100 \times \epsilon\). For example, if the strain is 0.02, then the percent strain is 2%.
Observations of strain in rocks is used to quantify the magnitude and directions of permanent deformation recorded in rocks from the out-crop scale (centimeters) to the plate boundary scale (100s of kilometers). For example, measurements of change in the relative distance between two permanent GPS locations can be used to calculate the strain occurring in the crust in between.
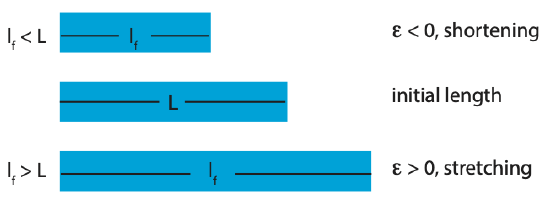 Figure \(\PageIndex{2}\): Normal strain leads to shortening or stretching of an object.
 Shear Strain
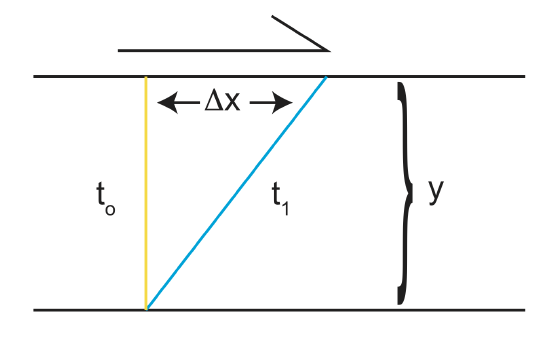
The second type of strain is shear strain, which results from a shear stress. The shear strain is given by the displacement in one direction (x) occurring across a region in the other direction (y). In the figure below, an applied shear stress slides the top of the layer of thickness y, side-ways by an amount \(\Delta x\). The shear strain is then given by,
\[\epsilon_{s}=\frac{\Delta x}{y}\]
The shear angle, \(\gamma\) is also used is to describe the shear strain within an outcrop. For example, it may be easier the measure the rotation of a feature on a trilobite fossil than to measure the offset of that feature. The shear strain and the shear angle are related as,
\[\epsilon_s = \tan{\gamma}=\frac{\Delta_{x}}{y}\]
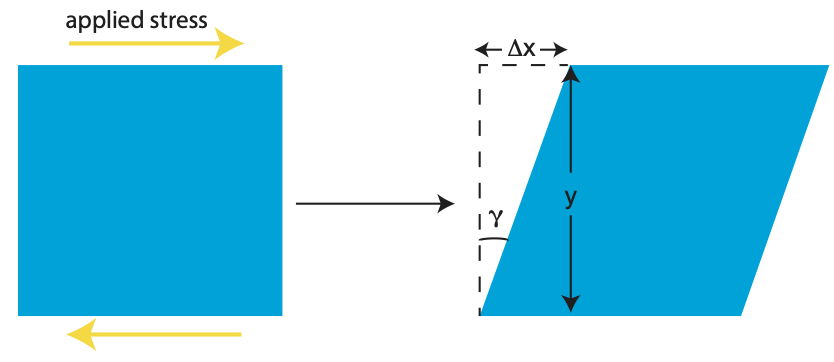 Figure \(\PageIndex{4}\): Shear angle, \(\gamma\), is also used to describe the shear strain of features.
Convention states that if the angle between the x and y axes decreases, the shear strain is positive, and if the angle increases, the shear strain in negative. Like normal strain, shear strain is a ratio and is thus dimensionless.
Calculating Shear Strain
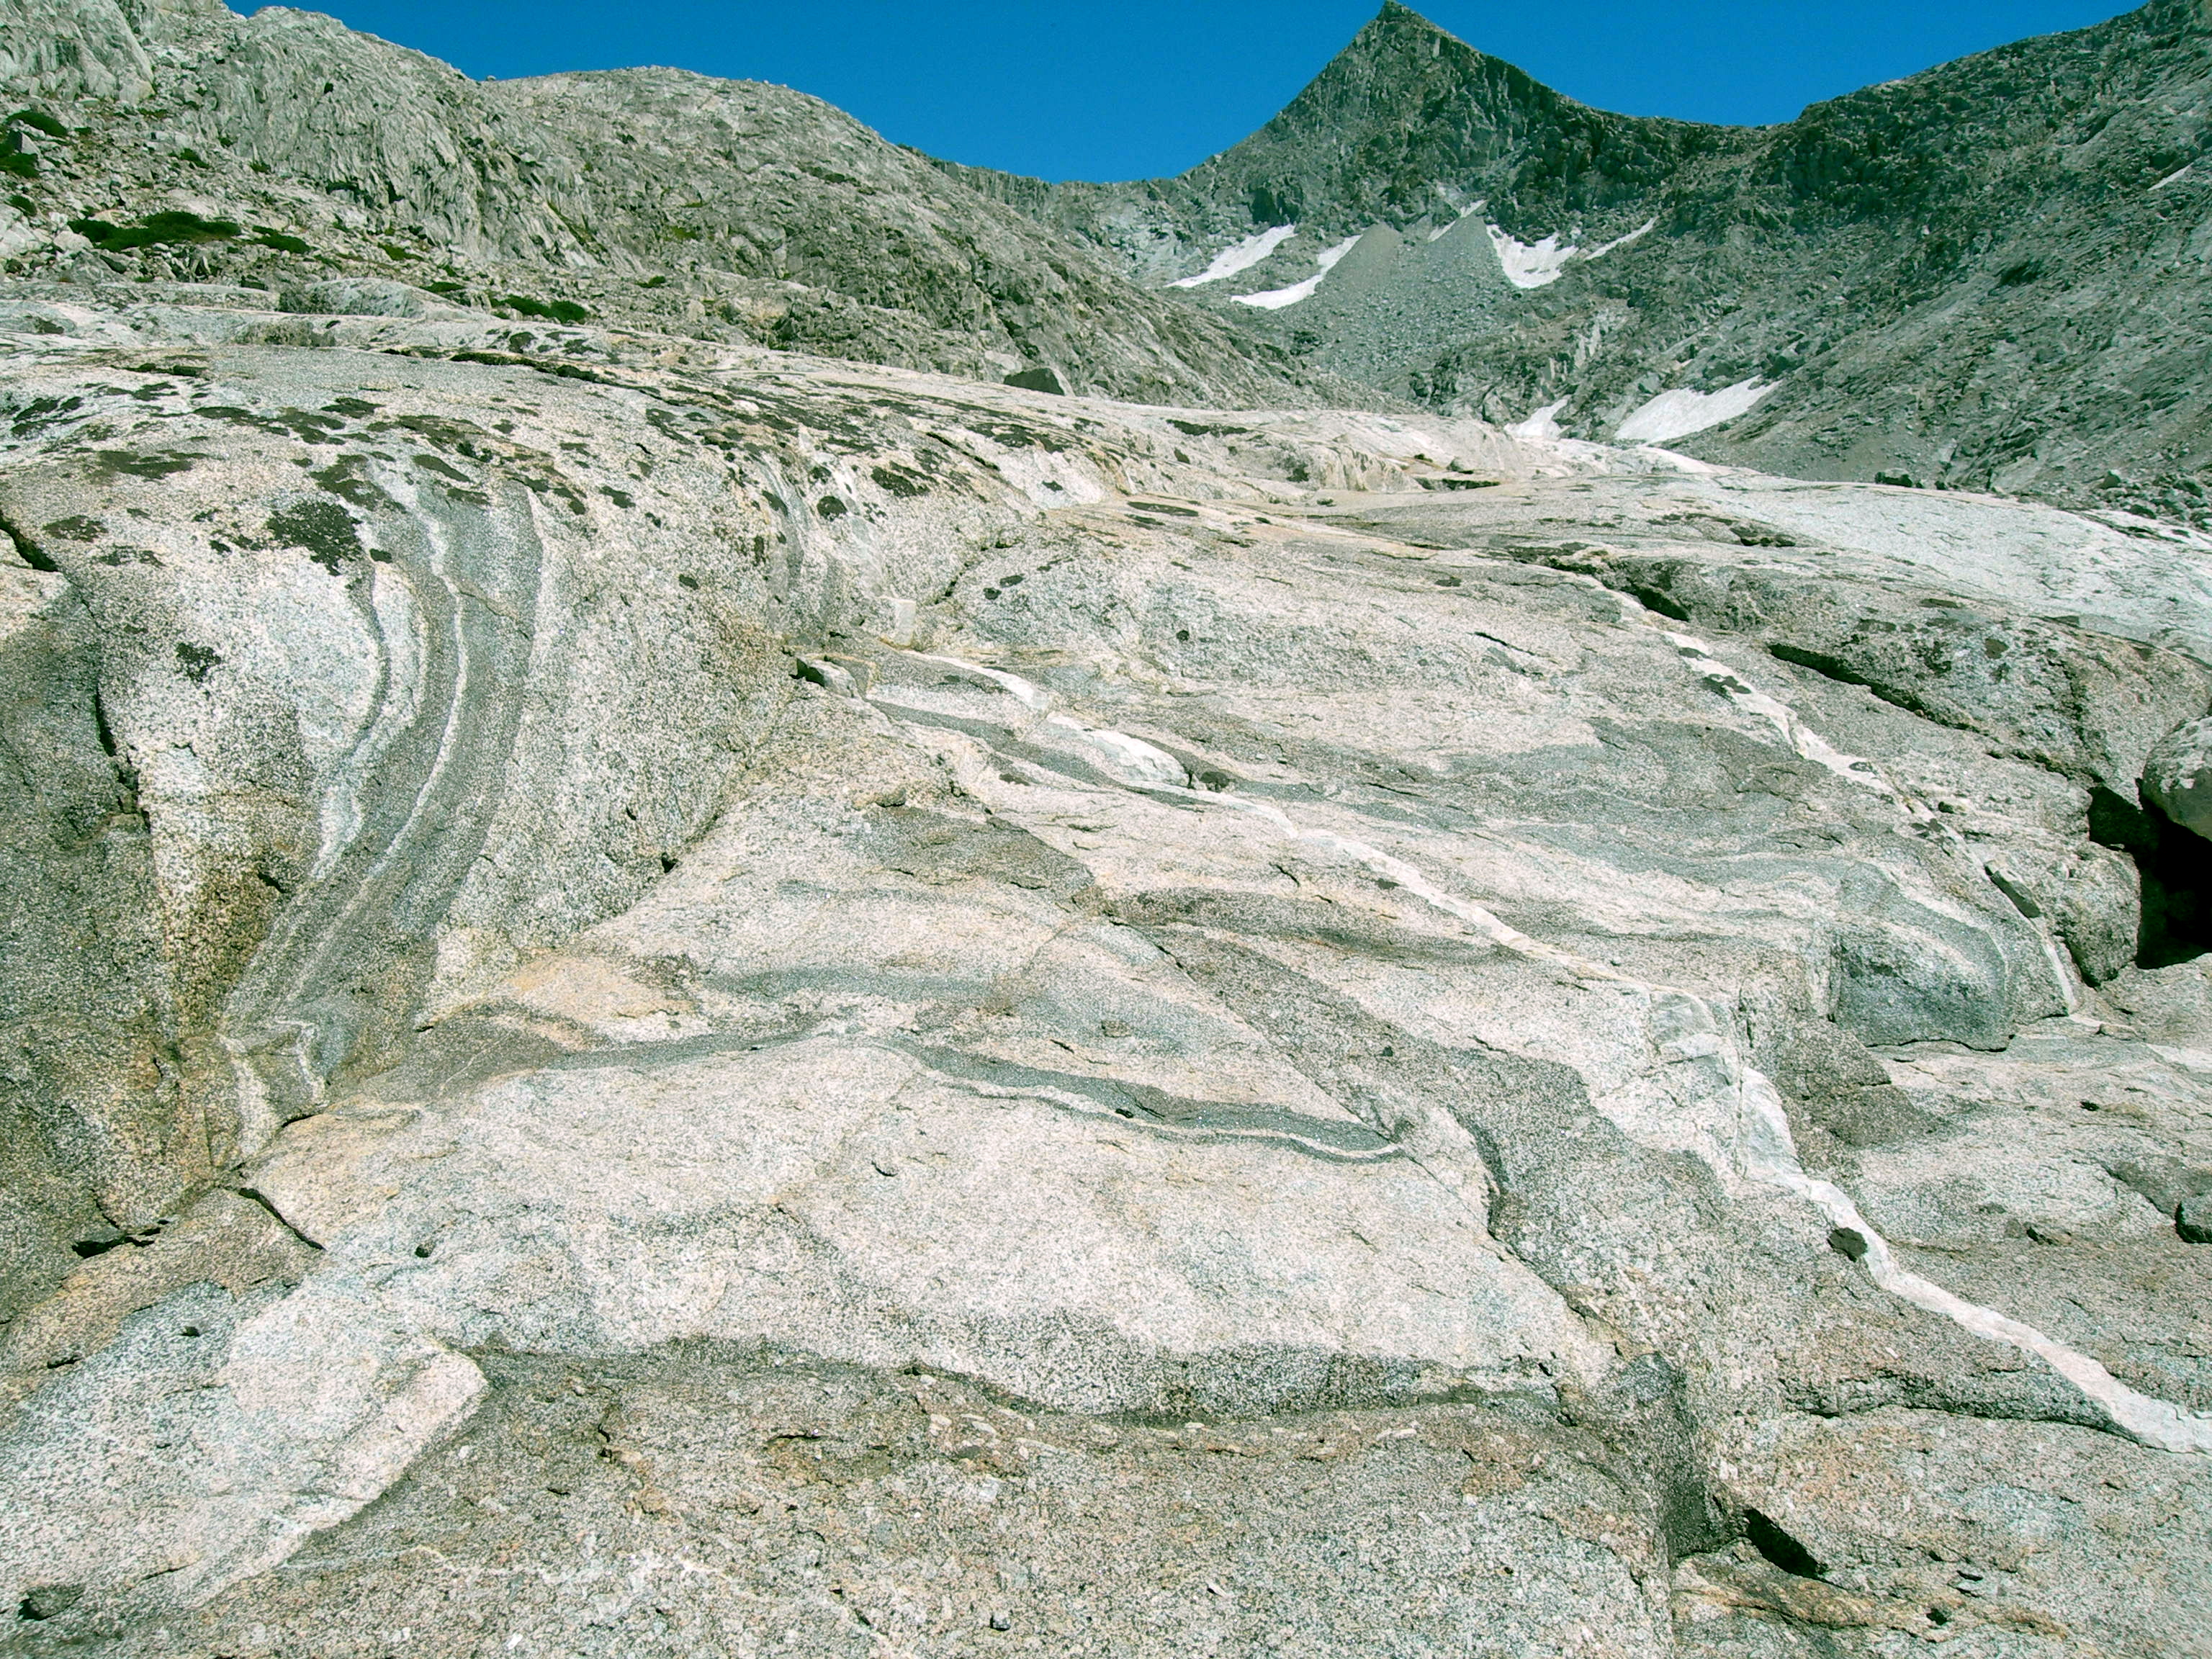
To calculate the shear strain across a fault or shear zone, we need to first identify a feature that has been offset by the fault or shear zone. Note the brunton for scale. The photo below shows an outcrop in an exhumed section of the mantle within the Josephine Ophiolite in southern Oregon. An ophiolite is a section of oceanic plate preserving all or part of the crust, and sometimes includes the top of the mantle section of the plate. This mantle section is made up of a mix of olivine (weathered, so they appear light brown) and pyroxenes (weathered, so they appear dark reddish-brown or black). The pyroxenes sometime appear in distinct layers that can be traced for tens of meters. The photo shows where one of these pyroxene layers has been offset by a fault or localize shear zone.
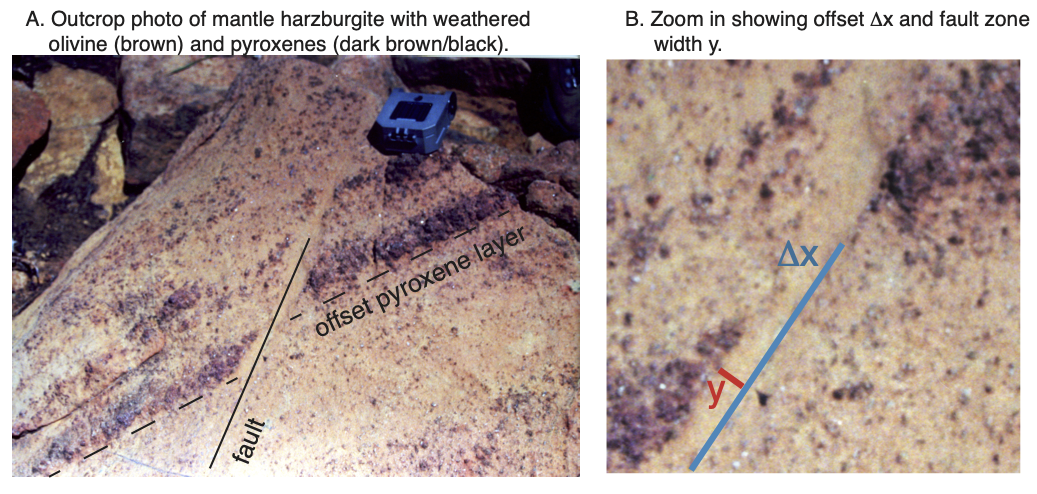
By marking the bottom of the pyroxene layer on either side of the fault we can measure the offset, \(\Delta x = 5\) cm. Similarly we can measure the width of the fault zone, \(y = 0.5\) cm. The figure below shows these two parameters schematically. (Note there is no sheared feature visible within the fault zone in the photo above. Therefore, the shear strain is
\[\epsilon_{s}=\frac{5}{0.5} = 10 \]
This value indicates a localized shear in a narrow zone, with the offset being 10 times greater than the width of the layer.
Similarly, the shear angle is
\[ \gamma = tan^{-1}(10)*180/\pi = 84.3^\circ\]
Note, that the output of the inverse tangent (atan or arctan) is an angle in radians, so it is necessary to convert to degrees.
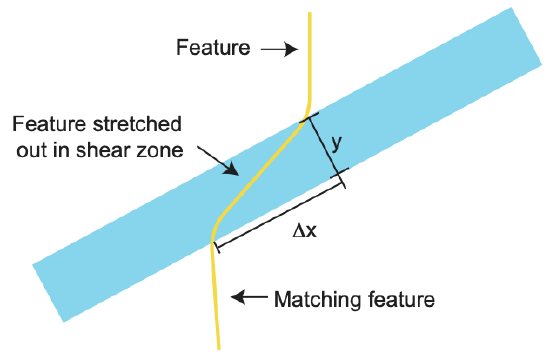 Figure \(\PageIndex{6}\): Schematic showing how to measure shear strain across a fault or shear zone.
Strain Rate
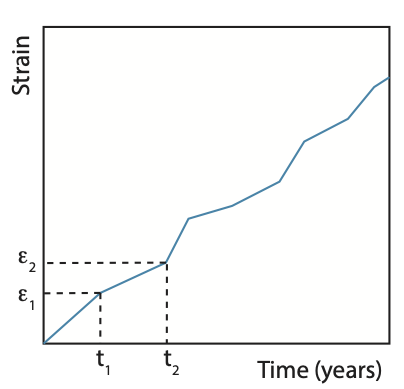
Deformation in the Earth can occur very slowly, such as the motion of plates with speeds of only millimeters or centimeters per year, and it can occur very quickly, such as the motion across a fault with speeds of meters per second. Therefore, strain also accumulates at different rates depending on the process and geologic features involved in the strain accumulation, and can change over time. The figure below shows the net strain accumulating across a shear zone as a function of time. Note the slope of this line changes, being steeper at some times and shallower at other times. The slope of this line, which is the derivative of the strain with respect time, is the strain-rate,
\[\dot{\epsilon} = \frac{d\epsilon}{dt}\]
For any small interval of time, we can measure the strain-rate as simply the amount of strain accumulated, \(\epsilon\), in a time interval, \(\Delta t\). For example, is the strain between times t1 and t2 in the figure is 0.5, and the time interval is t2 - t1 = 10 years, then the strain-rate is 0.05 1/yr.
Observing Strain in Rocks
One of the key observations made by geologists is to note the features indicating how rocks are deformed in an outcrop. They look for indications of how the rock has been folded, sheared, or faulted. These observations are used to describe and quantify the internal strain of the rock. It is important to note then that these are measurements of the total strain experienced by the rock since its emplacement. That is, you observed the final result of some unknown history of deformation occurring over some unknown time interval. It is possible to make observations that might indicate the order of different increments of the strain; for example, that a layer was sheared, and then it was faulted. It is also sometimes possible to make measurements that allow you to determine the time over which these increments of strain occurred using radiogenic dating methods. Gathering these different pieces of data from rocks is a painstaking process that eventually allows you to unravel the deformation history recorded in the rocks themselves.