
Groundwater
- Page ID
- 10886
Effects of Sediment Composition & Compaction on Groundwater Pumping in the San Joaquin Valley
by Veronica Guerra
I. History of Groundwater Use in California’s Central Valley
The original demand for groundwater in the Central Valley dates back to the California Gold Rush (Ref. 1). In the mid-1800s, settlers from the Gold Rush began farming in the Delta and Central Valley (Ref. 1). The rise of agriculture necessitated new water sources and transport methods, especially in the San Joaquin Valley (Ref. 1). This was remedied in part by groundwater development, which began in California around 1880 (Ref. 1). By 1913, pumping wells had become an effective groundwater retrieval method in the Central Valley (Ref. 1). Groundwater pumping persisted for years, but with adverse effects (Ref. 1). From 1926 to 1970, pumping caused widespread compaction of fine-grained sediments and “significant land subsidence” (subsidence exceeding 1 ft.) in about half of the San Joaquin Valley, even exceeding 26 ft. in certain localities (Refs. 1, 2, 3).
In the early 1970s, groundwater pumping finally began to decline (Ref. 2). With the increasing reliance on surface water imports, land compaction slowed down and groundwater levels began to steadily recover (Ref. 2). However, drought conditions from 1976-77, 1986-92, 2007-09, and 2012-2015 reduced surface water availability and thus drove increases in groundwater pumping, causing sediment to compact again and water levels to decline to near-historic lows (Refs. 2, 3).
II. About the San Joaquin Valley
A. Basins
The San Joaquin Valley is made up of two basins: the San Joaquin Basin and the Tulare Basin (Ref. 1).
The San Joaquin Basin is comprised of the San Joaquin River, part of the San Francisco Bay/Sacramento—San Joaquin River Delta (hereafter called “Delta”), and populous cities including Merced, Modesto, Stockton, and Turlock (Ref. 1). Most of the land in this basin is used for agriculture, creating a strong reliance on groundwater (Ref. 1). Groundwater makes up as much as 30% of the region’s annual water supply that is used for agricultural and urban purposes (Ref. 1).
The Tulare Basin is the drainage site for the Kings, Kaweah, Kern, and Tule Rivers (Ref. 1). Many of these rivers formed lakes that have long since dried out and whose feedwaters have been diverted for irrigation (Ref. 1). Today, much of Tulare Basin is used for agriculture and petroleum extraction (Ref. 1). It is also home to major cities including Bakersfield, Fresno, and Visalia (Ref. 1). As such, groundwater has been a major source of water for agricultural and urban uses (Ref. 1). Up until the early 2000s, groundwater made up an overwhelming majority of Tulare Basin’s total water supply (≥ 69% from 1998-2001) and the entirety of Fresno and Visalia’s water supplies (Ref. 1). Since then, groundwater recharge programs have been implemented by water districts to undo some of the damage (Ref. 1).
B. Groundwater Issues
Declines in groundwater storage have been prominent in the San Joaquin Valley (Ref. 1). As a result of groundwater pumping, water levels in the 1960s declined “to historic lows in the western San Joaquin Valley” and major land subsidence occurred (Ref. 1). Later that decade, the issue was somewhat remediated with the onset of a surface water delivery system, which delivered water from the Sacramento Valley and the Delta to the “heavily pumped San Joaquin Valley” (Ref. 1). By the early 1970s, the system “was fully functional” and helped groundwater levels recover “in the northern and western parts of the San Joaquin Valley” (Ref. 1). As of 2009, however, groundwater levels and storage were still declining (Ref. 1).
III. Effects of Groundwater Pumping on Water Quality
While certain minerals and trace elements are usually naturally found in groundwater, human activities can influence their concentration (Ref. 4). Among these materials whose concentrations have been affected by groundwater pumping in the San Joaquin Valley are chloride, nitrate, and arsenic (Refs. 5, 6, 7).
A. Chloride and Nitrate
According to chloride spatial distribution maps of the San Joaquin Basin, groundwater concentrations of chloride increase towards the Delta (see Fig. 1) (Refs. 5, 6). Concentrations from well water locally exceed 100 mg/L or 250 mg/L, while wells further east have concentrations of less than 50 mg/L (Refs. 5, 6). The extra chloride may be entering groundwater from any of three potential sources: irrigation return, delta sediments, and deeper deposits as a result of groundwater pumping (Ref. 5).
Water from these three sources can be distinguished by their chloride concentrations. Water from irrigation return has a relatively low chloride concentration but high nitrate concentration (Ref. 5). In contrast, water from delta sediments and deeper deposits both have high concentrations of chloride (Ref. 5). Izbicki et al. and Metzger suggest that these two sources are the biggest contributors of chloride to groundwater (Refs. 5, 6).
Evidently, sediment composition can have a profound effect on water quality. When water is pumped in areas that are in contact with delta or deep sediments, harmful minerals and elements can be pulled into the water, making the water unfit to drink.
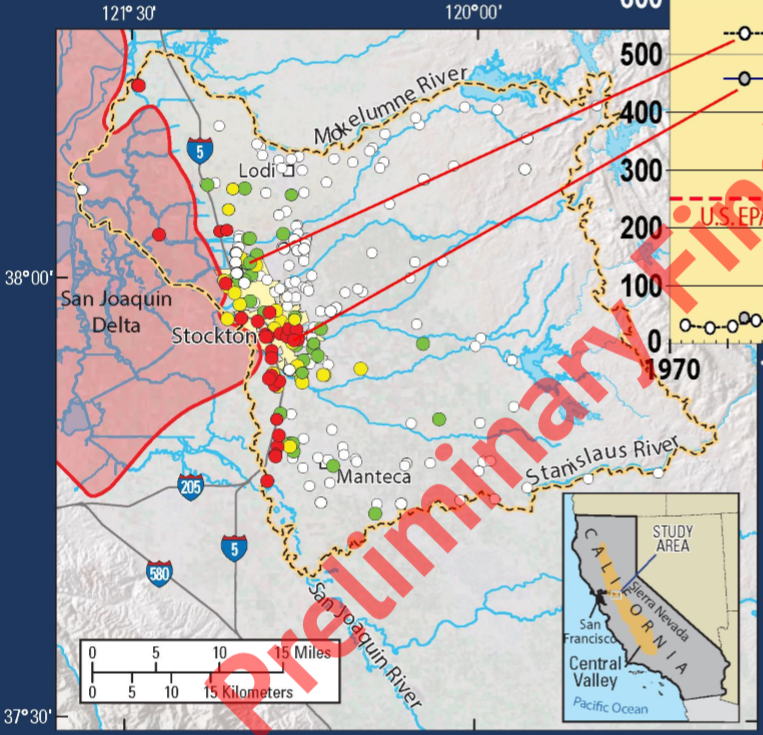
Figure 1. Map of chloride concentrations in the San Joaquin Basin. Legend: white = less than 50 mg/L; green = 50-100 mg/L; yellow = 100-250 mg/L; red = over 250 mg/L. From Metzger (Ref. 6).
B. Arsenic
Two toxic forms of arsenic have appeared in well water in the Eastern San Joaquin Groundwater Subbasin: arsenite (As III) and arsenate (As V) (Ref. 4). From 1974 to 2001, arsenic concentrations in up to one-third of wells in this area exceeded the Maximum Contaminant Level (MCL) of 10 μg/L and locally exceeded 60 μg/L (see Fig. 2) (Ref. 8). Concentrations typically increase towards the Delta, much like chloride concentrations, and increase with depth (Ref. 8). This is concerning because pumping may influence arsenic levels (Ref. 8). Izbicki et al. simulated the response to groundwater pumping in the San Joaquin Groundwater Subbasin using MODFLOW (Ref. 8). They found that when pumping persisted for 1,000 days, deeper deposits “contributed increasingly to the yield of the well”; arsenic levels increased accordingly (Ref. 8).
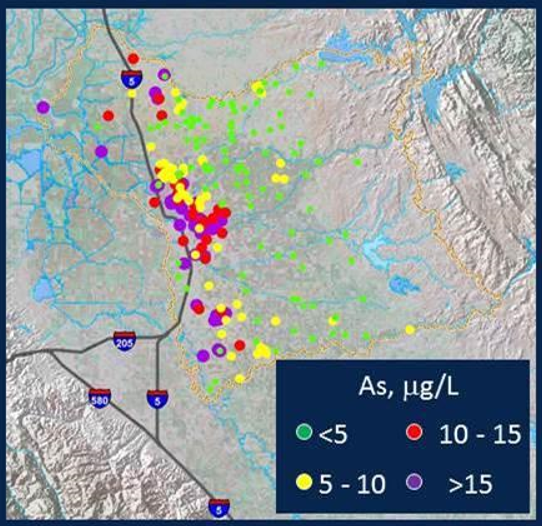
Figure 2. Map of arsenic concentrations in the San Joaquin Basin. From Izbicki et al., 2014 (Ref. 5).
Arsenic in this area can come from a variety of sources. The primary source is weathering of arsenic-bearing minerals from volcanic deposits or alluvium from the Sierra Nevada (Ref. 8). This includes iron-sulfide minerals like pyrite, which often contain arsenic in their crystal structures (Refs. 5, 8). However, the amount of arsenic can vary depending on whether the pyrite is a primary or secondary mineral (Refs. 5, 8). In the San Joaquin Basin, octahedral pyrite crystals, a primary mineral, were found to contain up to 4% arsenic by weight (Refs. 5, 8). In contrast, twinned pyritohedron crystals, a secondary mineral, did not contain any (Refs. 5, 8).
Arsenic concentrations also increase with pH and under anoxic conditions (Ref. 8). When mineral grains are coated in iron and manganese oxide, arsenic can desorb when the pH is greater than 7.6 or be released through reductive dissolution under anoxic conditions (Ref. 8).
Somewhat like chloride and nitrate, arsenic concentrations in groundwater are dependent on the composition of the individual mineral grains making up deep deposits; however, pH and oxygen levels also play a role. It is therefore important that the composition of deep deposits is considered prior to pumping. Otherwise, as the results from Izbicki et al. suggest, the contribution of arsenic from these deposits may be heightened (Ref. 8).
IV. Effects of Groundwater Pumping on Water Levels and Land Subsidence
A. How Groundwater Pumping Causes Land Subsidence
The process of groundwater pumping in the Central Valley has irreversible effects on water levels and land subsidence (see Fig. 3). Persistent pumping since the 1960s has caused water levels to significantly decline (Ref. 9). When water levels decline, fine-grain deposits irreversibly compact because they drain so slowly, causing “extensive land subsidence” in the San Joaquin Valley (Refs. 1, 9). By 1970, about half of the San Joaquin Valley (roughly 5200 mi2) had subsided by at least 1 ft. (Ref. 1).
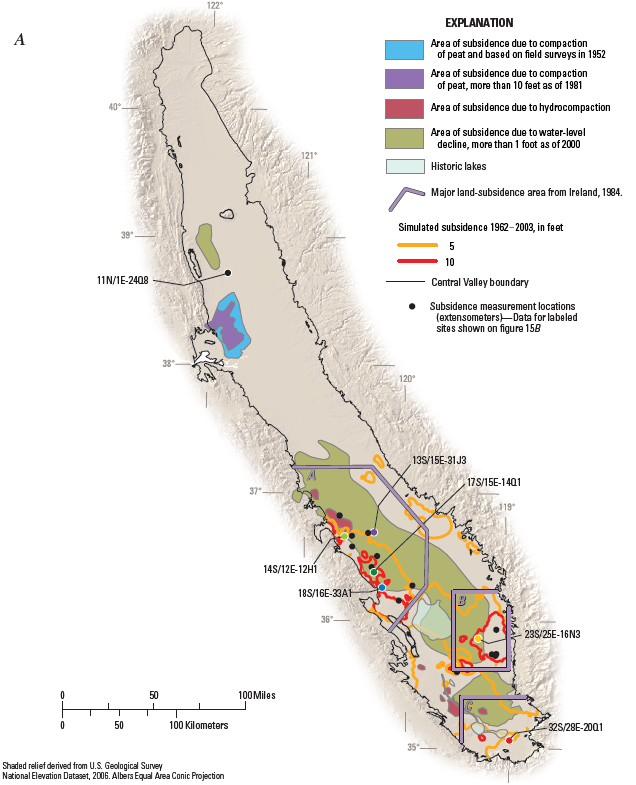
Figure 3. Map of land subsidence in the Central Valley. From Faunt, ed., 2009 (Ref. 1).
B. Areas Affected by Land Subsidence
Three areas in the San Joaquin Valley have been significantly affected by land subsidence as a result of groundwater pumping: "(1) 1500 mi2 in the Los Banos-Kettleman City area, (2) 800 mi2 in the Tulare-Wasco area, and (3) 400 mi2 in the Arvin-Maricopa area" (Ref. 1). The Los Banos-Kettleman City area experienced head declines of up to 500 ft "in the confined part of the aquifer" due to groundwater pumping (Ref. 1). This caused inelastic compaction of clay deposits, resulting in land subsidence of up to 28 ft (Ref. 1).
Other affected areas outside of the San Joaquin Valley include the Sacramento Valley and Yolo County (Ref. 1). Studies from the early to mid-1990s showed that the Sacramento Valley experienced up to 4 ft of subsidence since 1954 while Yolo County was just beginning to experience subsidence of several feet (Ref. 1).
C. Recent Land Subsidence
From 2008-2010, which overlapped with the 2007-09 drought, 1200 mi2 of the northern San Joaquin Valley subsided at a rate of 0.5-11 in/yr (Ref. 10). Surveys showed that those rates continued at least through 2013, even though much of this period was not a drought period (Ref. 10). This suggests that subsidence is highly dependent on surface water imports (Ref. 10). When surface water imports are low, more groundwater is extracted, driving land subsidence (Ref. 10). A reliable surface water supply may be critical for recovering water levels and slowing down subsidence in the future (Ref. 10).
V. Current Endeavors
Models are currently being used to simulate and understand the effects of groundwater pumping in the Central Valley and its future hydrologic conditions, including the Central Valley Hydrologic Model (CVHM), Global Climate Models (GCM), and MODFLOW (Refs. 1, 8, 9). The results of these studies can help guide future decisions made to help monitor and manage groundwater levels and subsidence.
References
1. Faunt, C.C., ed., 2009, Groundwater Availability of the Central Valley Aquifer, California: U.S. Geological Survey Professional Paper 1766, 225 p., https://pubs.usgs.gov/pp/1766/
2. Delta-Mendota Canal: Evaluation of Groundwater Conditions & Land Subsidence: United States Geological Survey, https://ca.water.usgs.gov/projects/c...ota-canal.html.
3. Land Subsidence in the San Joaquin Valley: United States Geological Survey, https://www.usgs.gov/centers/ca-wate...center_objects
4. Fram, M.S., 2017, Groundwater quality in the Western San Joaquin Valley study unit, 2010: California GAMA Priority Basin Project: U.S. Geological Survey Scientific Investigations Report 2017–5032, 130 p., https://doi.org/10.3133/sir20175032.
5. Izbicki, J.A., Metzger, L.F., O'Leary, D.R., 2014, Overview of USGS study results in Northeastern San Joaquin Groundwater subbasin: Implications for water quality and groundwater recharge: U.S. Geological Survey, https://ca.water.usgs.gov/projects/c...y_recharge.pdf.
6. Metzger, L., 2014, Chloride Mapping on the Basis of Electromagnetic Log Data: U.S. Geological Survey, https://ca.water.usgs.gov/projects/c...de_mapping.pdf.
7. O'Leary, D., Izbicki, J., 2014, Movement of recharge water from land surface to wells: U.S. Geological Survey, https://ca.water.usgs.gov/projects/c...rge_water_.pdf.
8. Izbicki, J.A., Stamos, C.L., Metzger, L.F., Halford, K.J., Kulp, T.R., Bennett, G.L., 2008, Source, Distribution, and Management of Arsenic in Water from Wells, Eastern San Joaquin Ground-Water Subbasin, California: U.S. Geological Survey Open File 2008-1272, 8 p, https://pubs.usgs.gov/fs/2009/3057/.
9. Central Valley Hydrologic Model (CVHM): U.S. Geological Survey, https://ca.water.usgs.gov/projects/c...ogic_Model.pdf.
10. Sneed, M., 2014, Land Subsidence along the Delta-Mendota Canal in the Northern Part of the San Joaquin Valley, California: U.S. Geological Survey, https://ca.water.usgs.gov/projects/c...dota-Canal.pdf.