

12.5: Recent Climate Change
- Page ID
- 47819

\( \newcommand{\vecs}[1]{\overset { \scriptstyle \rightharpoonup} {\mathbf{#1}} } \)
\( \newcommand{\vecd}[1]{\overset{-\!-\!\rightharpoonup}{\vphantom{a}\smash {#1}}} \)
\( \newcommand{\dsum}{\displaystyle\sum\limits} \)
\( \newcommand{\dint}{\displaystyle\int\limits} \)
\( \newcommand{\dlim}{\displaystyle\lim\limits} \)
\( \newcommand{\id}{\mathrm{id}}\) \( \newcommand{\Span}{\mathrm{span}}\)
( \newcommand{\kernel}{\mathrm{null}\,}\) \( \newcommand{\range}{\mathrm{range}\,}\)
\( \newcommand{\RealPart}{\mathrm{Re}}\) \( \newcommand{\ImaginaryPart}{\mathrm{Im}}\)
\( \newcommand{\Argument}{\mathrm{Arg}}\) \( \newcommand{\norm}[1]{\| #1 \|}\)
\( \newcommand{\inner}[2]{\langle #1, #2 \rangle}\)
\( \newcommand{\Span}{\mathrm{span}}\)
\( \newcommand{\id}{\mathrm{id}}\)
\( \newcommand{\Span}{\mathrm{span}}\)
\( \newcommand{\kernel}{\mathrm{null}\,}\)
\( \newcommand{\range}{\mathrm{range}\,}\)
\( \newcommand{\RealPart}{\mathrm{Re}}\)
\( \newcommand{\ImaginaryPart}{\mathrm{Im}}\)
\( \newcommand{\Argument}{\mathrm{Arg}}\)
\( \newcommand{\norm}[1]{\| #1 \|}\)
\( \newcommand{\inner}[2]{\langle #1, #2 \rangle}\)
\( \newcommand{\Span}{\mathrm{span}}\) \( \newcommand{\AA}{\unicode[.8,0]{x212B}}\)
\( \newcommand{\vectorA}[1]{\vec{#1}} % arrow\)
\( \newcommand{\vectorAt}[1]{\vec{\text{#1}}} % arrow\)
\( \newcommand{\vectorB}[1]{\overset { \scriptstyle \rightharpoonup} {\mathbf{#1}} } \)
\( \newcommand{\vectorC}[1]{\textbf{#1}} \)
\( \newcommand{\vectorD}[1]{\overrightarrow{#1}} \)
\( \newcommand{\vectorDt}[1]{\overrightarrow{\text{#1}}} \)
\( \newcommand{\vectE}[1]{\overset{-\!-\!\rightharpoonup}{\vphantom{a}\smash{\mathbf {#1}}}} \)
\( \newcommand{\vecs}[1]{\overset { \scriptstyle \rightharpoonup} {\mathbf{#1}} } \)
\(\newcommand{\longvect}{\overrightarrow}\)
\( \newcommand{\vecd}[1]{\overset{-\!-\!\rightharpoonup}{\vphantom{a}\smash {#1}}} \)
\(\newcommand{\ket}[1]{\left| #1 \right>}\)
\(\newcommand{\bra}[1]{\left< #1 \right|}\)
\(\newcommand{\braket}[2]{\left< #1 \vphantom{#2} \right| \left. #2 \vphantom{#1} \right>}\)
\(\newcommand{\braopket}[3]{\left< #1 \vphantom{#2}\vphantom{#3} \right| #2 \vphantom{#1}\vphantom{#3} \left| #3 \vphantom{#1}\vphantom{#2} \right>}\)
\(\newcommand{\qmvec}[1]{\mathbf{\vec{#1}}}\)
\(\newcommand{\op}[1]{\hat{\mathbf{#1}}}\)
\(\newcommand{\expect}[1]{\langle #1 \rangle}\)
\(\newcommand{\dfn}[1]{\emph{\textbf{#1}}}\)
Changes Over the Past 100 Years
Although Earth’s climate is currently changing rapidly relative to past changes, in most regions where we live, changes are slow enough that we do not notice them directly during our daily lives. However, older people may have observed changes over their lifetimes, and in some regions, these changes are larger and more pronounced than elsewhere. In this section, we will discuss observations from the past 100 years and data from regions susceptible to climate change, where the most dramatic effects have occurred. This will not be a comprehensive documentation of existing observations. Additional observations will be discussed throughout the remainder of this book.
The Climate System
Earth’s climate system consists of interacting components, as depicted in Fig. \(\PageIndex{1}\). The atmosphere, which is the air and clouds above the surface, is about 10 km thick (more than two-thirds of its mass is contained below that height). The ocean covers more than two-thirds of Earth’s surface and has an average depth of roughly 4 km. Contrast those numbers with Earth’s radius, which is approximately 6,400 km, and you’ll find that Earth’s atmosphere and ocean are very thin layers compared to the size of the planet itself. In fact, they are about 1,000 times thinner. They are perhaps comparable to the outer layer of an onion or to the water on a wet soccer ball. Yet all life is constrained to these thin layers. The major ocean basins are the Pacific, Atlantic, Indian, and Southern Oceans. The Cryosphere comprises ice and snow, including sea ice, mountain glaciers, and ice sheets. Sea ice is frozen seawater, up to several meters thick, floating on the ocean. Ice sheets on land, composed of compacted snow, can be several kilometers thick. The Biosphere includes all living things on land and in the sea, from the smallest microbes to trees and whales. The Lithosphere, which is the solid Earth (upper crust and mantle), could also be considered an active part of Earth’s climate system because it responds to ice load and influences atmospheric carbon dioxide (CO2) concentrations and climate on long timescales through continental movements.

The components interact by exchanging energy, water, momentum, and carbon, creating a deliciously complex coupled system. Imagine water evaporating from the tropical ocean heated by the sun. The air containing that water rises and cools, which causes the water vapor to condense into a cloud. The cloud is carried by winds over land where it rains. The rain sustains a forest. Trees are dark, having a low albedo. This influences the amount of sunlight absorbed by the Earth. Dark surfaces absorb more sunlight and warm up more than bright surfaces, such as desert sand or snow. Air warmed by the surface rises, affecting the wind.
Atmosphere
Observations indicate that the global climate is changing. Surface air temperature data, averaged over the whole Earth, indicate warming of 0.7-0.9°C over the last ~100 years, as shown in Figure \(\PageIndex{2}\). But that warming was neither steady nor smooth. From 1880 to about 1910, there was cooling, followed by warming until about 1940. After this slight cooling, approximately constant temperatures were observed until the 1970s, after which temperatures rose rapidly to the present. Each year’s temperature differs slightly from the next. Not all of these year-to-year changes are currently understood, but natural variations, which humans do not cause, do play a role. For instance, strong El Niño years, such as 1997-98 or 2015, are particularly warm, whereas La Niña years, such as 1999-2000 or 2011, are relatively cool. El Niño and La Niña are also known together as ENSO (El Niño/Southern Oscillation). ENSO is a climate variability pattern occurring in the tropical Pacific that also impacts many other regions of the Earth.

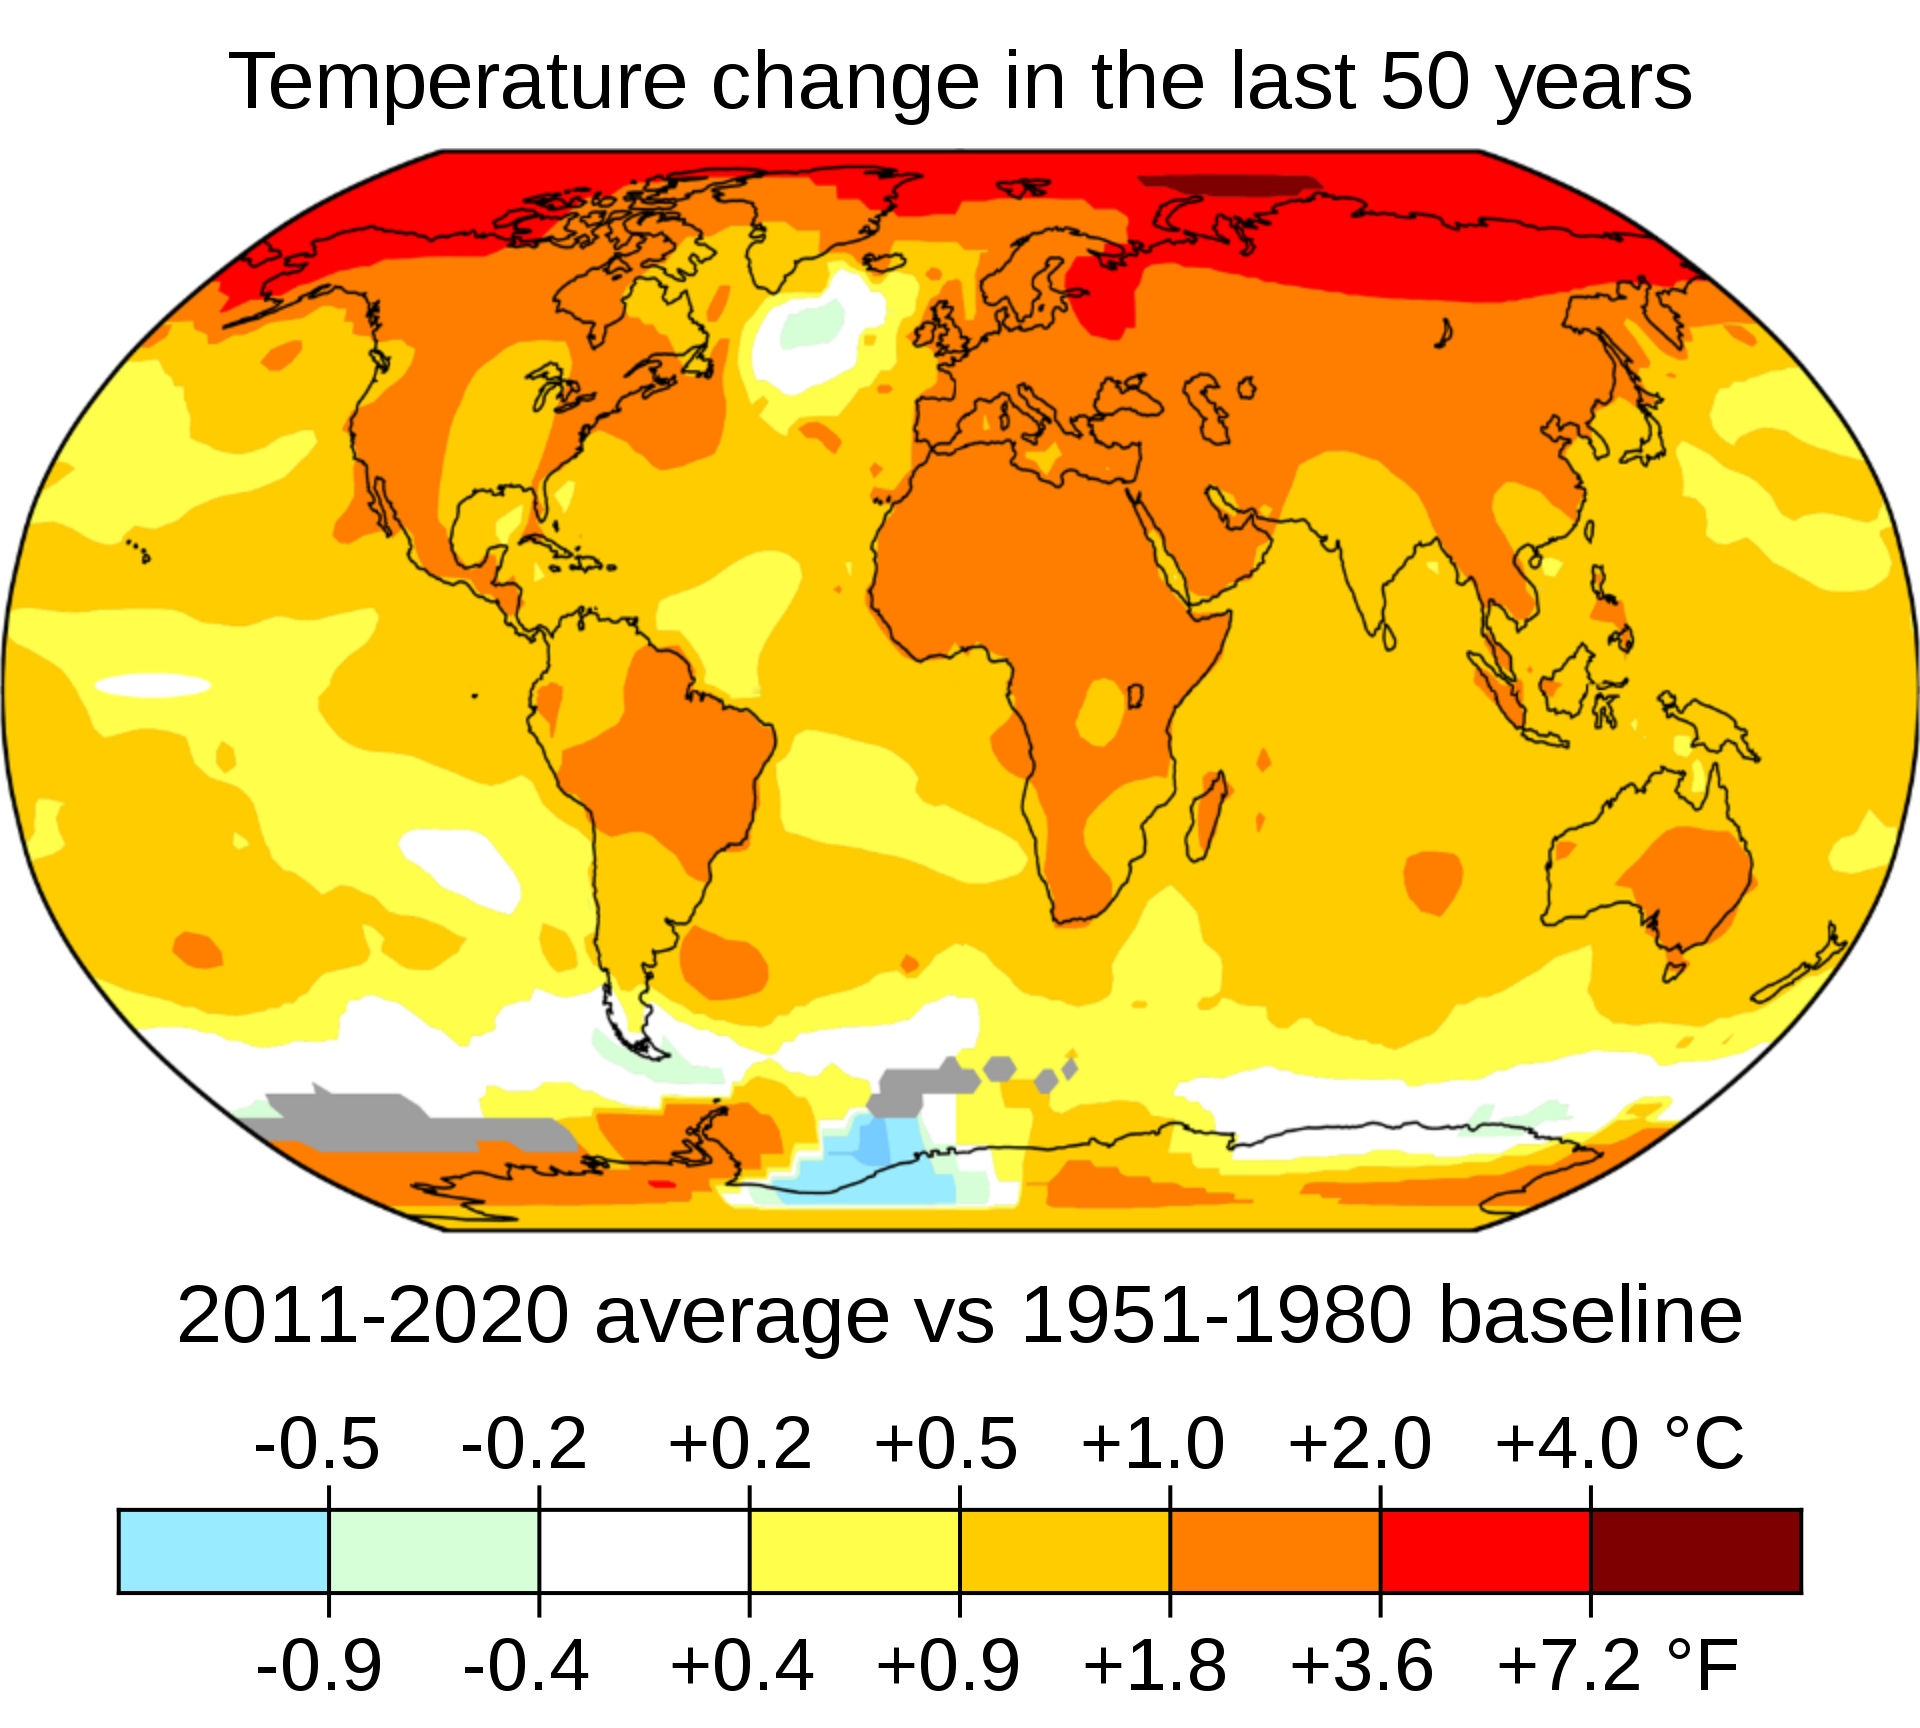
The increase in atmospheric temperatures over the last 100 years has not been uniform worldwide. Figure \(\PageIndex{3}\) shows that temperatures over land changed more than over the oceans, and the Arctic warmed more than the tropics. These patterns, called land-sea contrast and polar amplification, are pretty well understood and simulated in climate models, as we will see later. The warming is indeed almost global. The only exception is the northern North Atlantic, which has been slightly cooling for reasons we will discuss later.
Analysis of thousands of temperature records into an estimate of global mean temperature change, such as Fig. \(\PageIndex{2}\), is not trivial. Issues such as changes in station locations, instrumentation, and data coverage have to be taken into account. Thus, there are a few other groups around the world that calculate global average surface temperatures, e.g. the National Aeronautics and Space Administration’s (NASA) Goddard Institute for Space Science (GISS), the Climate Research Unit (CRU) of the University of East Anglia, or the Berkeley Earth Surface Temperatures (BEST), and all come to very similar results. Errors due to unequal sampling have been estimated at approximately 0.2°C during the early part of the record and decreasing to 0.1°C during the more recent period. The fact that five groups analyzing the data with different methods reach the same conclusions suggests that the results are robust. The data's reliability has been demonstrated, and station locations (e.g., urban versus rural) don’t matter.
The global warming trend has increased the likelihood of warm and extremely warm temperatures and decreased the likelihood of cold and extremely cold temperatures. E.g., extremely warm (more than 3°C above the 1951 to 1980 average) summer temperatures over Northern Hemisphere land areas had only a 0.1% chance of occurring from 1951 to 1980. In contrast, during the decade from 2005 to 2015, the chance of those extreme warm temperatures occurring was 14.5%. Conversely, relatively cold summer temperatures (about 0.5°C cooler than the 1951-1980 average) that occurred about every third year from 1951 to 1980 occurred only 5% of the time during 2005 to 2015.
Cryosphere
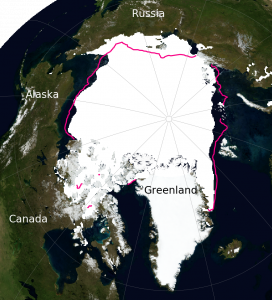
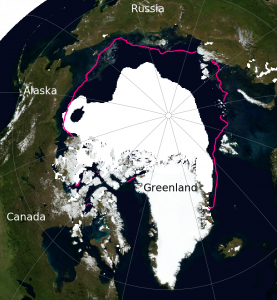
One of the most sensitive regions to climate change is the Arctic. Sea ice cover there has decreased dramatically over the past 40 years, particularly in late summer (Figure \(\PageIndex{4}\)). Arctic sea ice experiences a strong seasonal cycle. In late winter, it covers about 15.4×10⁶ km2 and decreases to about 6.4×10⁶ km2 in late summer, as depicted in Figure \(\PageIndex{5}\). Therefore, the relative changes are larger in late summer, with a reduction of about 46 % or 2.9×10⁶ km2 from 1980 to 2015. In winter, the reduction was only about 9 % or 1.5×10⁶ km2. The lost area of summer Arctic sea ice is more than 10 times the size of Oregon (255,000 km2) or four times the size of France (~650,000 km2).
 A
 B
In the Antarctic, sea ice undergoes a larger seasonal cycle, but it has changed less over the last 40 years than in the Arctic. Southern hemisphere sea ice has slightly increased by about 12 % or 0.5×10⁶ km2 in late austral summer and 2.4 % or 2.3×10⁶ km2 in austral winter. Note that year-to-year fluctuations are larger in winter than in summer and that the long-term trends in the Arctic are much larger than the short-term fluctuations. In contrast, in the Antarctic, the long-term trends are similar to the short-term fluctuations and thus less statistically significant. A trend is statistically significant if it exceeds the errors.

Globally, Earth has lost approximately 2 million square kilometers of sea ice from 1980 to 2015, representing about 10% of the total. Compare that area to that of your favorite state or country.
Mountain glaciers are also sensitive to climate change. Figure \(\PageIndex{6}\) shows an example from Muir Glacier, which has retreated dramatically since 1941. This is typical of most glaciers worldwide. In fact, only a small number of glaciers show advances, whereas the vast majority melt and retreat from the valleys into higher elevations.


The World Glacier Monitoring Service (WGMS) has compiled information on hundreds of glaciers worldwide. Figure \(\PageIndex{7}\) shows that since 1980, glaciers in all regions have been losing mass with an acceleration of loss in recent years.
Ice sheets are massive, continental-scale bodies of ice and snow that cover more than 50,000 square kilometers of land. They form over thousands of years when annual snowfall exceeds melting, causing layers of snow to compact into flowing ice. The two current ice sheets on Earth are in Greenland and Antarctica, which together hold over 99% of the planet's freshwater ice. Observations from the Gravity Recovery and Climate Experiment (GRACE) satellites, which measure Earth’s gravity field with very high precision and can detect mass changes, indicate that since 2002 the Greenland ice sheet has lost approximately 4,000 Gt of mass. The Antarctic ice sheet has lost about 2,500 Gigatons as illustrated in Fig. \(\PageIndex{8}\). The melting of the Greenland ice sheet currently contributes approximately 0.8 mm/yr to global sea-level rise. Antarctica’s contribution is 0.4 mm/yr, and mountain glaciers add about 0.6 mm/yr, for a total of 1.8 mm/yr sea level rise from melting of ice, according to IPCC 2019 reports.

Oceans
Subsurface ocean temperature measurements document warming over the last 60 years. The ocean’s heat content has increased by about 30×1022 Joules during that time, as illustrated in Fig. \(\PageIndex{9}\). Before 2005, subsurface temperature measurements were more limited in space and time because they were taken from ships by lowering CTD (conductivity, temperature, depth) instruments on a cable into the ocean. Since 2005, autonomous, free-drifting Argo floats have measured temperature, salinity, pressure, and velocity of the upper 2 km of the water column. Currently, there are approximately 4,000 floats in operation, providing substantially better spatial and temporal coverage than previous ship-based measurements.

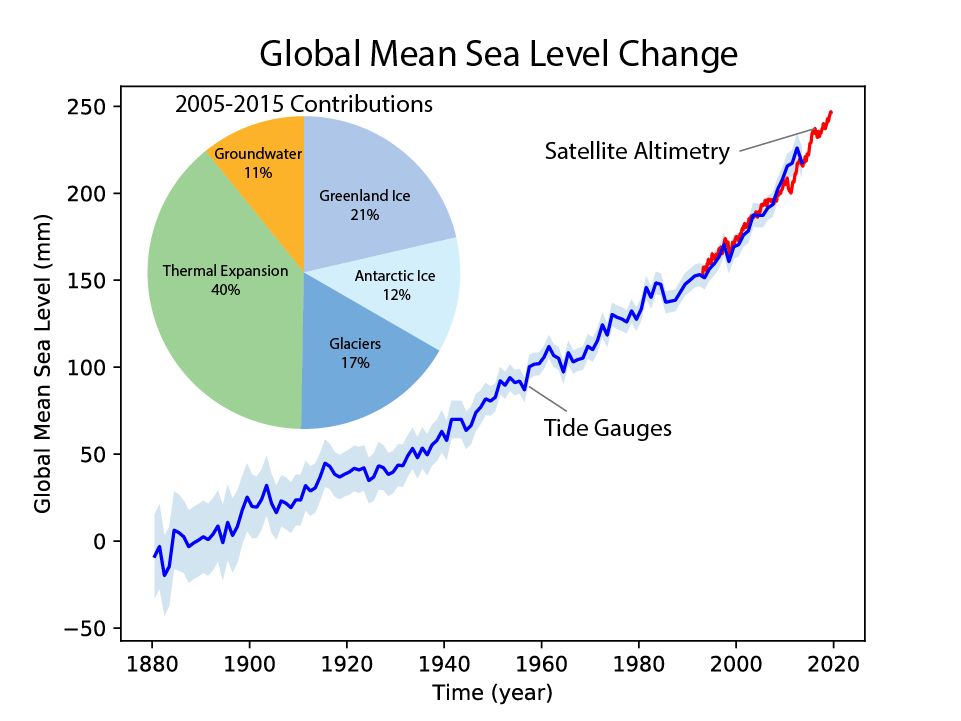
The melting of mountain glaciers and ice sheets leads to increased runoff into the ocean, which contributes to sea level rise as shown in Fig. \(\PageIndex{10}\). Sea level rise is also caused by warming sea water, which expands, and by increased runoff from groundwater pumping from aquifers. Estimates based on tide gauge records indicate that sea level has risen by approximately 20 cm from the 1870s to 2000, and by an additional 6 cm since then. The melting of mountain glaciers and ice sheets contributes approximately equally to current sea-level rise; however, if current trends continue, many mountain glaciers will likely disappear, and the large ice sheets will contribute more and more to global sea-level rise. Note that sea level rise is not spatially uniform.
Biosphere and Carbon Cycle
Plant and animal species have been observed moving poleward and upward in mountain ranges. This response is consistent with global warming and with organisms' tendency to remain within a temperature range to which they have adapted. Flowering dates of many plants have also shifted earlier in the spring, including cherry blossoms.

Carbon dioxide (CO2) has been measured in the atmosphere since 1958 at Mauna Loa Observatory in Hawaii, as illustrated in Figure \(\PageIndex{11}\). At that time, concentrations were just below 320 parts per million (ppm). Subsequently, they increased to values of just over 424 ppm today. That is a 25% increase. Overlaid on the long-term trend is a seasonal cycle. Growth of the terrestrial biosphere in the Northern Hemisphere spring leads to CO2 drawdown and the decay of organic matter, such as fallen leaves, which increases CO2 in the fall. CO2 is an important greenhouse gas, and its increase over the past decades is the leading cause of the recent global warming.