
3.3: Soil and Water Relationships
- Page ID
- 14723

Learning Objectives
- Understand the effect of texture on pore size and water holding capacity.
- Know relationships among moisture potential, movement, and availability.
- Determine soil water content by weight and volume.
- Measure saturated hydraulic conductivity and understand factors influencing rates of water movement.
- Explain the operation of moisture monitoring devices.
Recent major droughts around the U.S. demonstrate the importance of the efficient use of water. Accurately measuring the amount of water available to plants is essential in determining irrigation rates and reducing the amount of wasted water. Soil water content is typically measured in the field using soil moisture sensors, which will be discussed in more detail in the Soil Water Measurement and Movement lab. Results from any soil moisture sensor must be interpreted using a “soil water relationship”. Soil water relationships are graphs depicting a measured value versus soil water content, and can be considered a calibration specific to a particular soil. In this lab, soil water relationships will be developed for a clayey soil and a sandy soil.
Materials
- Two soils, a sandy soil and a clayey soil, both air-dried, ground, and passed through a 2 mm sieve
- Shallow trays capable of holding water to a depth of 5 cm
- Plastic cups
- A tool (such as a thumbtack) to punch holes in the bottom of the plastic cups
- Filter paper or paper towels
- Scissors
- Permanent markers and label tape
- Laboratory balances accurate to the nearest 0.01 g
- Weigh boats
- Soil scoops
- Graduated cylinders
- Oven
- Soil drying tins
Recommended Reading
- Module 5 – Plant Water Relations (Allison and Jones, 2005)
- Soil, Water, and Plant Relationships (Rogers et al., 2014)
- Available Water Capacity (USDA NRCS, 2008b)
Prelab Assignment
Using the recommended reading resources and the introduction to this lab, consider the questions listed below. These definitions/questions will provide a concise summary of the major concepts to be addressed in the lab. They are useful study notes for exams.
- Define soil water potential in your own words.
- Define and compare gravitational water, plant available water, and unavailable water. Relate each to the different pore sizes (macro-, meso-, and micro-).
- Identify the matric potential values (soil water potential) for saturation, field capacity, wilting point, air dry, and oven dry soil.
- Compare and contrast soil water content on a weight (mass) basis and a volume basis. Show how to convert between these weight and volume.
- Common units used to quantify moisture potential are cm (of water), bars, and kPa. How many cm of water in one bar? How many kPa in one bar? How many cm of water in one kPa?
Introduction
An understanding of soil-water relationships is essential to proper soil management for agronomic or other land use purposes. The soil-water-air continuum involves principles of physics, chemistry, and biology. Water, which can limit plant growth, is probably most important in evaluating land use, influencing soil characteristics for most land uses.
The retention and movement of water in soils, its uptake and translocation in plants, and its loss to the atmosphere are all energy-related phenomena. The energy relationships between free water and soil moisture are generally expressed in terms of soil-water potentials. These potentials are described in units of pressure, generally kilopascals (kPa).
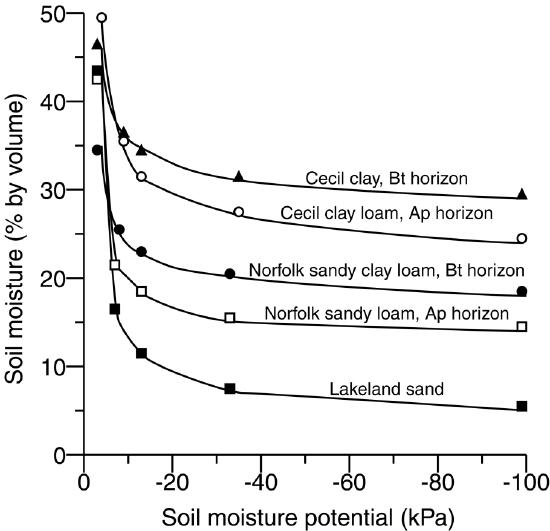
Water content and water potential are related as shown in Figure 9.1 for five soils of differing textures. In general as clay content increases, the soil water content increases for a given soil moisture potential. The reason for this is that clayey soils have a higher porosity, and can hold on to more water at a given soil water potential.
The relationship between soil moisture content and soil moisture potential is a continuum. However, to understand moisture availability to plants, we break the continuum into parts and give each part a name or classification, as shown in Figure 9.2 and explained in Table 9.1. The important points on the continuum include saturation, field capacity, wilting point, air dry, and oven dry. Therefore, for a plant, field capacity and wilting point are most important because they determine the amount of plant-available water.
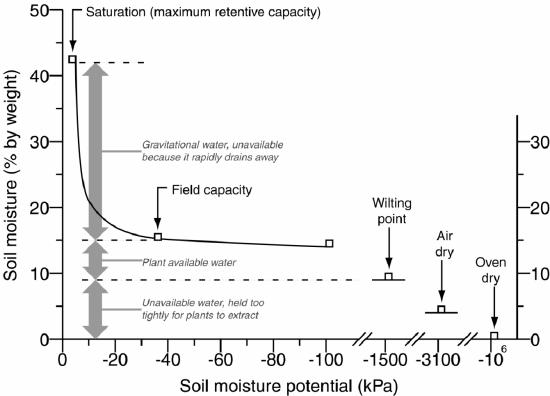
| Classes of Water | Calculation and Explanation |
|---|---|
| Gravitational water | water content at saturation – water held at field capacity |
| water that drains from macropores too rapidly for plants to use | |
| Plant available water | water held at field capacity – water held at wilting point |
| water in mesopores | |
| Unavailable water | water held at wilting point |
| mostly hygroscopic water held too tightly in micropores to be plant available |
Methods of Expressing Soil Water Content
The moisture content of a soil can be expressed using either weight or volume. Moisture content measured using weight is determined by drying a moist sample to a constant weight. The difference in weights before and after drying represents the soil water. The percentage is determined as follows:
\[\text{Percent soil water by weight}=\frac{\text{mass of water}}{\text{mass of oven dry soil}}×100\text{%}\nonumber \]
Remember to divide by the oven dry weight, not the wet weight.
This approach is called gravimetric analysis and yields the gravimetric water content.
Volumetric moisture content is determined as follows:
\[\text{Percent water by volume}=\frac{\text{volume of water}}{ \text{volume of soil}}×100\text{%}\nonumber \]
The gravimetric and volumetric water contents do not equal each other. However, we can use bulk density to convert from weight to volume and vice versa.
Recall that bulk density is:
\[\text{Bulk density}=\frac{\text{mass of oven dry soil}}{\text{volume of soil}}\nonumber \]
Also recall that the density of water is 1.0 g/cm3, i.e., a 1.0 g of water has a volume of 1.0 cm3.
Multiplying soil moisture measure by weight x bulk density yields:
\[\frac{\text{Mass of water}}{\text{Mass of oven dry soil}}\times\frac{\text{Mass of oven dry soil}}{\text{Volume of soil}}=\frac{\text{Mass of water}}{\text{Volume of soil}}= \frac{\text{Volume of water}}{\text{Volume of soil}}\nonumber \]
For example, a soil with a bulk density of 1.5 g/cm3 and a water content of 30% measured using weight will have a volumetric water content of 45% (30 x 1.5 = 45).
The volumetric water content is a useful measurement. First, it more realistically describes the moisture environment of growing plant root systems as they explore a given volume of soil. Secondly, volumetric water values can be converted to represent water content at a particular equivalent soil depth or thickness. Representing water at a specific depth changes the expression from a volume (cm3) to a linear (cm) expression of soil water:
\[\text{Depth of soil}\times\text{ water content by volume}=\text{depth of water}\nonumber \]
For example, a 25 cm layer of soil with a volumetric water content of 20% (or 0.20 when expressed as a decimal fraction) would contain 5 cm of water in the 25 cm layer of soil:
\[25\text{ cm soil}\times0.20=5\text{ cm of water}\nonumber \]
Activity 1: Moisture Content Calculations
Two days after a heavy soaking rain, a soil sample was collected. During two days between rainfall and sampling, the gravitational water drained out of the soils, so the soil moisture content was at field capacity. After 10 days of hot dry weather, plants on the soil began to wilt, and a second sample was collected. These two soil samples were weighed, oven-dried, and re-weighed. The soil had a bulk density of 1.3 g/cm3. The following data were collected:
| Sample | Moisture state | Moist weight | Oven-dry weight |
|---|---|---|---|
| 1 | Field capacity (2 days after rain) | 160 g | 128 g |
| 2 | Wilting point (10 days after rain) | 170 g | 156 g |
Calculate the following quantities. Calculations from Sample 1 data are shown as an example.
![]() What is the percent water by weight (gravimetric water content) in each sample?
What is the percent water by weight (gravimetric water content) in each sample?
\[\begin{align*} \text{Sample 1 percent water by weight} &=\dfrac{(160\text{ g}-128\text{ g})}{128\text{ g}}×100\text{%}=25\text{%} \\[4pt] \text{Sample 2 percent water by weight} &= \end{align*} \]
![]() What is the percent water by volume (volumetric water content) in each sample?
What is the percent water by volume (volumetric water content) in each sample?
\[\begin{align*} \text{Sample 1 percent water by volume} &= \frac{1.3\text{ g}}{\text{cm}^3}\times25\text{%}=33\text{%} \\[4pt] \text{Sample 2 percent water by volume} &= \end{align*}\]
![]() What percent water by weight is plant available (difference between field capacity and wilting point)?
What percent water by weight is plant available (difference between field capacity and wilting point)?
![]() How many centimeters of plant available water could be held in a 50-cm layer of this soil?
How many centimeters of plant available water could be held in a 50-cm layer of this soil?
![]() When the soil water content is at the wilting point, how deeply would a 3 cm rainfall wet this soil? (Assume no runoff.) HINT: Room for storage of water without runoff would include water volume up to field capacity. Therefore, the difference in volume between wilting point and field capacity would indicate how deeply the soil can absorb rainfall.
When the soil water content is at the wilting point, how deeply would a 3 cm rainfall wet this soil? (Assume no runoff.) HINT: Room for storage of water without runoff would include water volume up to field capacity. Therefore, the difference in volume between wilting point and field capacity would indicate how deeply the soil can absorb rainfall.
Activity 2: Measuring Soil Moisture at Saturation, Field Capacity, and Wilting Point
Steps 1-10 below were completed in a previous lab. The objective of this activity is to examine the influence of texture and density on water holding capacity and pore size distribution, the moisture status of different soil materials will be monitored through a drying cycle. Each lab group will be responsible for two soils and one treatment (AD, WP, FC, and S). Your laboratory instructor will assign the treatment. You will complete the experiment on both soils.
- Label an empty cup as follows:
- Lab Section number
- Soil Type: Sandy or Clayey
- Treatment:
- AD(air dry)
- WP(wilting point)
- FC(field capacity)
- S(saturated)
- Punch eight small holes in the bottom of the cup.
- Cut a piece of paper towel and place in the bottom of the cup to prevent soil from falling through the holes.
- Weigh the empty cup and paper towel, and record the value on the data sheet.
- Place a cup on the balance, tare out the weight of the cup, and add exactly 50g of soil. Gently tap the cup on the lab bench to settle the soil.
- We need to know the volume of soil in the cups so we can calculate bulk density. Fill another cup (without holes!) with water to the same level as the soil in the cups. Pour the water into a graduated cylinder and record the value on the data sheet (assume 1 ml = 1 cm3).
- Get the data for the other soil from the lab groups with the other soil.
- Calculate and record the bulk density.
- Carefully and slowly place the WP, FC, and S cups in the water in the dishpans to allow the soil to become saturated from the bottom to the top. Your lab instructor will remove WP cups tomorrow and allow them to dry for 6 days. The FC cups will be removed in 6 days and allowed to drain for 1 day. The S cups will remain in the water all week.
- Place the AD cup in the dishpan with no water.
![]() Now complete the exercise by weighing all cups of soil. Subtract the weight of the empty cup, and record on the instructor’s master datasheet. The instructor will provide a composite of the data on the blackboard for your section following experiment summary. A lab worksheet will be handed out in class, so you can complete calculations based on the data your lab group compiled. Complete this worksheet, and turn it in at the following lab period.
Now complete the exercise by weighing all cups of soil. Subtract the weight of the empty cup, and record on the instructor’s master datasheet. The instructor will provide a composite of the data on the blackboard for your section following experiment summary. A lab worksheet will be handed out in class, so you can complete calculations based on the data your lab group compiled. Complete this worksheet, and turn it in at the following lab period.
| Experiment Datasheet | ||||||
|---|---|---|---|---|---|---|
| Weight of empty cup + towel [g] | ____________g | |||||
| Weight of soil [g] | ____________g | |||||
| Sandy Soil | Clayey Soil | |||||
| Volume of water in cup (i.e., volume of soil) | ____________cm^3 | ____________cm^3 | ||||
| Bulk Density | ____________g/cm^3 | ____________g/cm^3 | ||||
| Sample Weight | ||||||
| Sandy Soil | Sandy Soil | Clayey Soil | Clayey Soil | |||
| Treatment | Code | Moisture class | Cup + Soil | Soil | Cup + Soil | Soil |
| Dried in oven | OD | Oven dry | ||||
| Never Wet | AD | Air dry | ||||
| Drained 6 days | WP | Wilting point | ||||
| Drained 1 day | FC | Field capacity | ||||
| Never Drained | S | Saturated |
Assignment: Lab Summary
For this lab, you will be preparing a lab summary. The assignment will be provided to you at the beginning of the lab.