
5.7.13: The 1999 Bay Area Forecast
- Page ID
- 6032

Overview
The new ideas of earthquake triggering and stress shadows from the 1906 earthquake, together with much new information about the paleoseismic history of Bay Area faults, led to the formation of a new working group of experts from government, academia, and private industry. This group considered all the major faults of the Bay Area, as well as a “floating earthquake” on a fault the group hadn’t yet identified. A summary of fault slip and paleoseismic data was published by the USGS in 1996. A new estimate was released on October 14, 1999, on the USGS web site and as a USGS Fact Sheet.
The new report raises the probability of an earthquake with a magnitude greater than M 6.7 in the Bay Area in the next thirty years to 70 percent. Subsequent reviews by the Working Group on California Earthquake Probabilities (WGCEP) have not changed the estimates significantly. Figure 7-7 shows a forecast from 2007 to 2036, and the overall probability of an earthquake of this size or larger on one of the Bay Area faults is 63%. Earthquake probability on the Rodgers Creek Fault and the northern end of the Hayward Fault was given as 31 percent; the probability is somewhat lower on the northern San Andreas Fault, the rest of the Hayward Fault, and the Calaveras Fault. A two-out-of-three chance of a large earthquake is a sobering thought for residents of the Bay Area. These numbers will change in future estimates, but probably not by much.
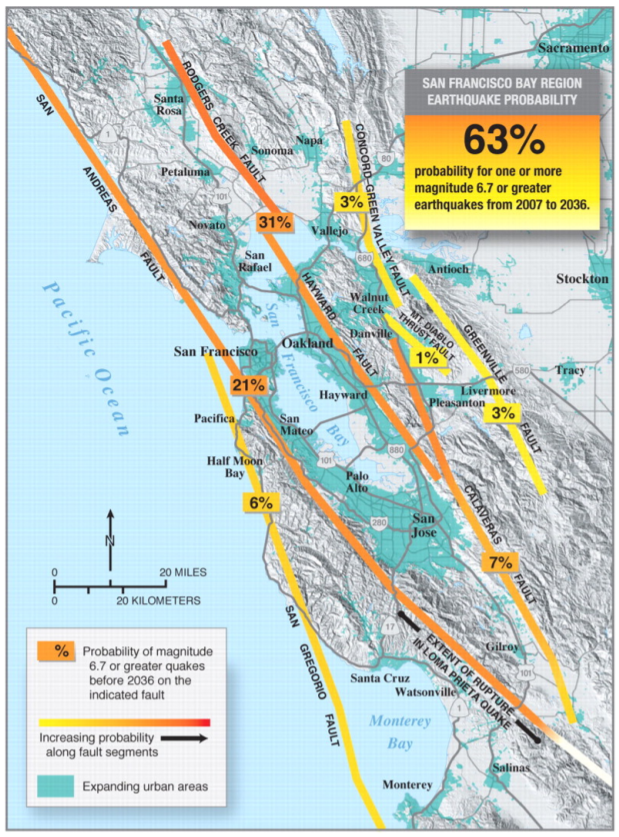
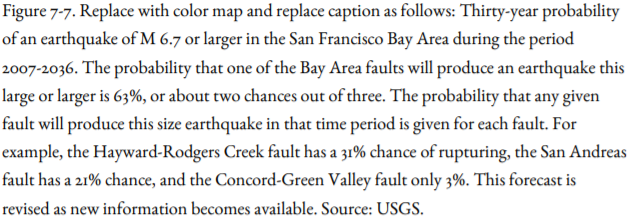
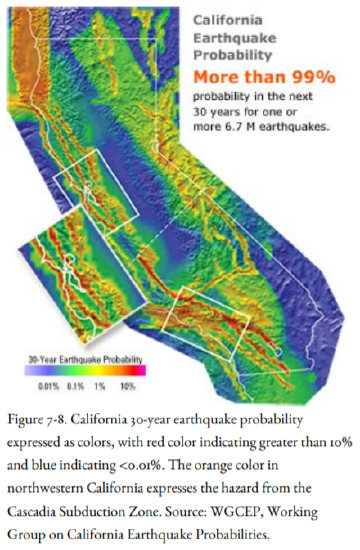
Figure 7-8 is a map showing earthquake probabilities for the entire state of California. The colors on the map are the probability for specific locations over the next thirty years, whereas Figure 7-7 is the probability for specific faults. Note the high probability of an earthquake in the California part of the Cascadia Subduction Zone. Note also that the San Andreas fault and the Hayward-Rodgers Creek fault are shown in bright red, indicating their high probability. The WGCEP estimates that there is more than 99% probability for at least one earthquake of M 6.7 or larger somewhere in California in the next thirty years!
What about the Northwest? Although we know quite a lot about the earthquake history of the Cascadia Subduction Zone, we know too little about the history of crustal faults and almost nothing about faults producing earthquakes in the Juan de Fuca Plate beneath Puget Sound and the Georgia Strait. Chris Goldfinger has estimated the 50-year probability of a Cascadia Subduction Zone earthquake based on the 10,000-year record based on turbidites. He estimates a 10-17 percent chance of an M 9 on the Washington coast and a 15-20 percent chance on the Oregon Coast during this period and a 37% chance of an earthquake of M 8-8,4 during this same period.
In the next chapters, we change our focus from the probability of earthquakes of a certain magnitude to the probability of strong shaking, which is more important in building codes and designing large structures. Here we have made some progress.