
6.1.2: Amplification of Seismic Waves by Soft Surficial Deposits
- Page ID
- 6038

Overview
It is a short stroll from Fort Mason, west of Ghirardelli Square and Fisherman’s Wharf in San Francisco, to the fashionable townhouses of the upscale Marina District, yet the intensity of ground motion of these two areas during the earthquake of October 17, 1989, was dramatically different. The Marina District experienced intensities as high as IX, higher even than at the epicenter itself, more than sixty miles away. Fort Mason and Fisherman’s Wharf experienced intensities of only VII.
On April 18, 1906, Fort Mason was under the command of Captain M. L. Walker of the U.S. Army Corps of Engineers. The great San Francisco Earthquake had shaken Captain Walker awake, but he had then gone back to bed, thinking that the earthquake was “no more than a mild shaker.” Brigadier General Frederick Funston, on Sansome Street in the maelstrom of collapsed buildings and towering fires, sent Captain Walker an urgent summons to muster his company of troops. The captain had to be roused a second time.
Why was Fort Mason spared the worst of both earthquakes? Fort Mason is built on bedrock, and the Marina District that was damaged in 1989 is built on soft sediment. The geologic foundation material made all the difference. The Marina District was built on fine sand from San Francisco Bay, “made land” that was hydraulically emplaced after the 1906 earthquake, together with rubble from buildings destroyed by that earthquake. This material was pushed together to make a building site for an international exposition in 1915 that said to the world, “San Francisco is back!” Yes, San Francisco was back, all right, but the sand and rubble contained a time bomb: the foundation was too poorly consolidated to hold up well during the next earthquake. In October 1989, the time bomb went off.
Figure 8-1 shows seismograms of an aftershock of magnitude 4.6 on October 21 recorded at Fort Mason (MAS), where the seismograph was established on bedrock, and two sites in the Marina District, one (PUC) on dune sand from an ancient beach, and the other (LMS) on the artificial fill emplaced after the 1906 earthquake. The seismic waves were much stronger at PUC and LMS than at MAS, an indication of more violent seismic shaking, leading to more damage. The waves were also of much lower frequency. Engineers call a station like MAS a rock site, and stations like PUC and LMS soil sites.
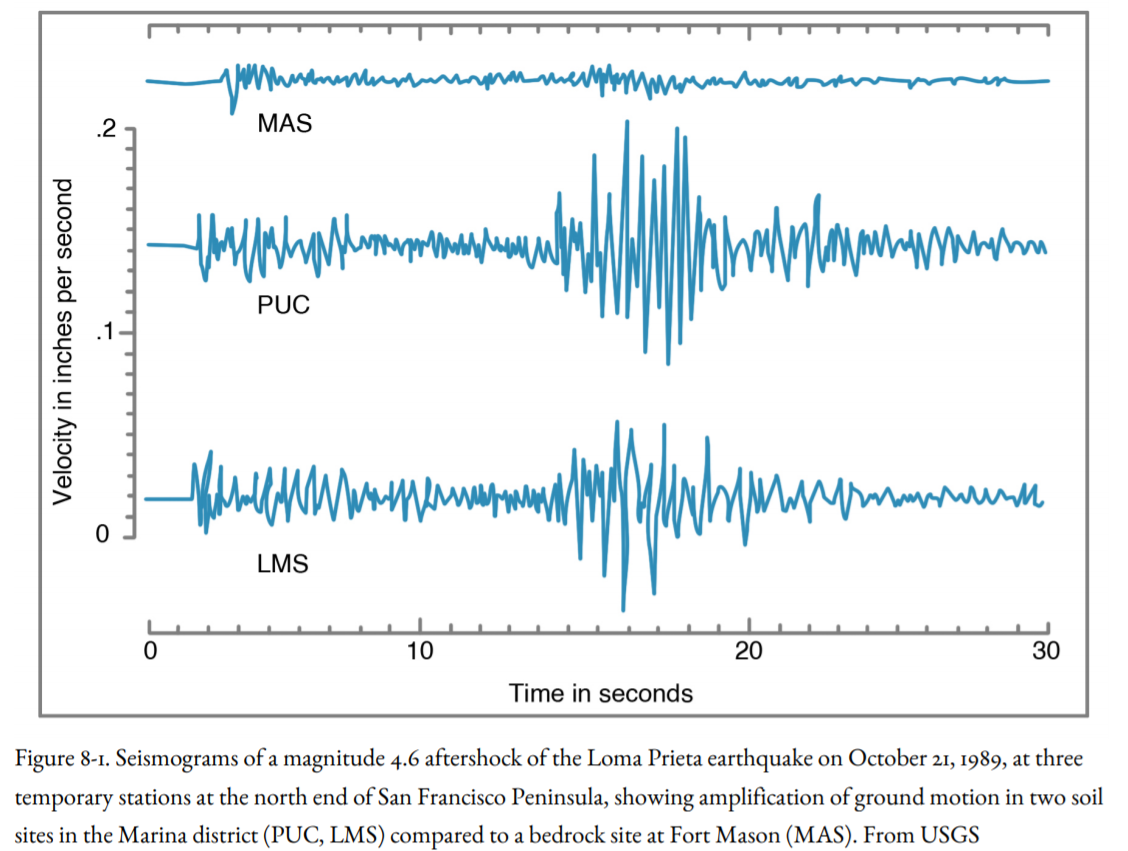
An analogy is commonly made between these two types of site and a bowl of jello on a table, an experiment that can be done at home. Stack two or three children’s blocks on top of one another on the tabletop, then stack some more blocks on top of the jello. Then jolt the table sideways. The blocks on the jello will fall over, whereas the blocks directly on the tabletop might remain standing. The shaking of the blocks on the table illustrates the effect of a seismic wave passing through bedrock. When the shaking reaches the bowl of jello, however, the waves are amplified so that the top of the jello jiggles and causes the blocks to topple. In a similar fashion, the soft foundation materials at a soil site will amplify the seismic waves, which results in much more vigorous shaking than would be expected at a rock site.
A tragic illustration of this phenomenon was provided by the magnitude 8.1 Mexico City Earthquake of 1985. Actually, the epicenter of the earthquake was in the Pacific Ocean on a subduction zone, hundreds of miles from Mexico City. It is called the Mexico City Earthquake because of the terrible losses suffered by that city. More than fifteen million people live in Mexico City, many in substandard housing, which was one reason why so many lives were lost. But more important is the geologic foundation: Mexico City is built on the former bed of Lake Texcoco. The clay, silt, and sand of this ancient lake, in part, saturated with water, greatly amplified the seismic waves traveling from the subduction zone. More than five hundred buildings fell down, and more than ten thousand people were killed. The floor of Lake Texcoco truly acted like the bowl of jello resting on the tabletop that is the Earth’s crust beneath the lake deposits.
The Mexico City Earthquake provided a lesson for the major cities of the Willamette Valley, Puget Sound, and the Fraser River delta in southwestern British Columbia. Much of the foundation of these cities is soft sediment: deltaic deposits of the Fraser and Duwamish rivers, glacial deposits in Puget Sound, and alluvial deposits of the Willamette and Columbia rivers. Even though a subduction-zone earthquake would be far away, near the coast or offshore (as it was for Mexico City), these soft sediments would be expected to amplify the seismic waves and cause more damage than if the cities were built on bedrock. Fortunately for the people of the Pacific Northwest, building standards are higher than those in Mexico City in 1985, so we would not expect as high a loss of life. In addition, geotechnical experience with many earthquakes around the world permits a forecast of the effects of near-surface geology on seismic waves from various earthquake sources. In other words, this is a problem we can do something about.
These techniques are illustrated by a study led by Ivan Wong, then of Woodward-Clyde Federal Services, in cooperation with the Oregon Department of Geology and Mineral Industries for the City of Portland. Because no two earthquake sources are alike, Wong and his colleagues programmed computer simulations based on a Cascadia Subduction Zone earthquake of Mw 8.5 and crustal earthquakes of Mw 6 and Mw 6.5. Because the surface effects are strongly influenced (attenuated) by the distance of a site from the epicenter, they used distances from the crustal source to the site of five, ten, and fifteen kilometers (1.6 kilometers = one mile).
What property of a seismic wave is best for determining the hazard to buildings? Wong’s group used peak horizontal acceleration, expressed in percentage of gravity (percent g). Acceleration is the rate of increase in the speed of an object. If you step off a cliff and fall through space, your speed will accelerate from zero at a rate of 32 feet (9.8 meters) per second every second, due to the gravitational attraction of the Earth. This is an acceleration of 1 g. When an earthquake has a vertical acceleration greater than 1 g, stones or clods of earth are thrown into the air, as first observed during a great earthquake in India in 1897. Vertical accelerations greater than 1 g were recorded during the 1971 San Fernando, California, Earthquake, with the result that a fire truck with its brakes set was tossed about the Lopez Canyon Fire Station, leaving tire marks on the garage door frame 3 feet above the floor.
Horizontal accelerations may be measured as well. A car accelerating at a rate of 1 g would travel 100 yards from a stationary position in slightly more than 4 seconds. As we will see later, horizontal accelerations are particularly critical, because many older buildings constructed without consideration of earthquakes are designed to withstand vertical loads, such as the weight of the building itself, whereas an earthquake may cause a building to shake from side to side, accelerating horizontally. A higher peak acceleration will lead to a higher earthquake intensity at a given site.
Other properties of strong ground motions that relate to damage are velocity—how fast a building shakes back and forth during an earthquake—and displacement—how far the seismic wave causes the ground to move from side to side. In general, the higher the acceleration, the higher the velocity and displacement. However, it does not follow that the higher the magnitude of the earthquake, the higher the acceleration. Some of the highest accelerations ever recorded occurred during earthquakes of magnitude less than 7. The Yountville Earthquake of September 3, 2000, in northern California, had a magnitude of only M 5.2, yet it resulted in accelerations up to 0.5 g.
Strong shaking is measured by a special type of seismograph called a strong-motion accelerometer. These instruments are necessary because an ordinary continuous-recording seismograph may go off the scale during a strong earthquake. The strong-motion instrument does not record continuously but is triggered to start recording when the first large earthquake wave arrives, and it stops recording when the waves diminish to a low level. These instruments record the acceleration in percent g; other instruments record velocity or displacement. These records are of particular use to structural engineers, who use them to determine how buildings vibrate during an earthquake. Several instruments may be placed in a single tall building, one in the basement and others on upper floors, showing a very different response to shaking of different levels of the building. It is prudent to install strong-motion accelerometers in all major structures such as dams or skyscrapers. The installation cost is very small compared to the cost of the building, and the information revealed during an earthquake is invaluable for future engineering design.
Another consideration is the period of the earthquake waves that are potentially damaging. Period is the length of time it takes one wavelength to pass a given point (Figure 3-12). We have already encountered frequency, the number of wavelengths to pass a point in a second. Frequency is equal to 1 divided by the period. As we saw in Chapter 3, earthquakes, like symphony orchestras, produce waves of short period and high frequency (piccolos and violins) and waves of long-period and low frequency (tubas and bass violins).
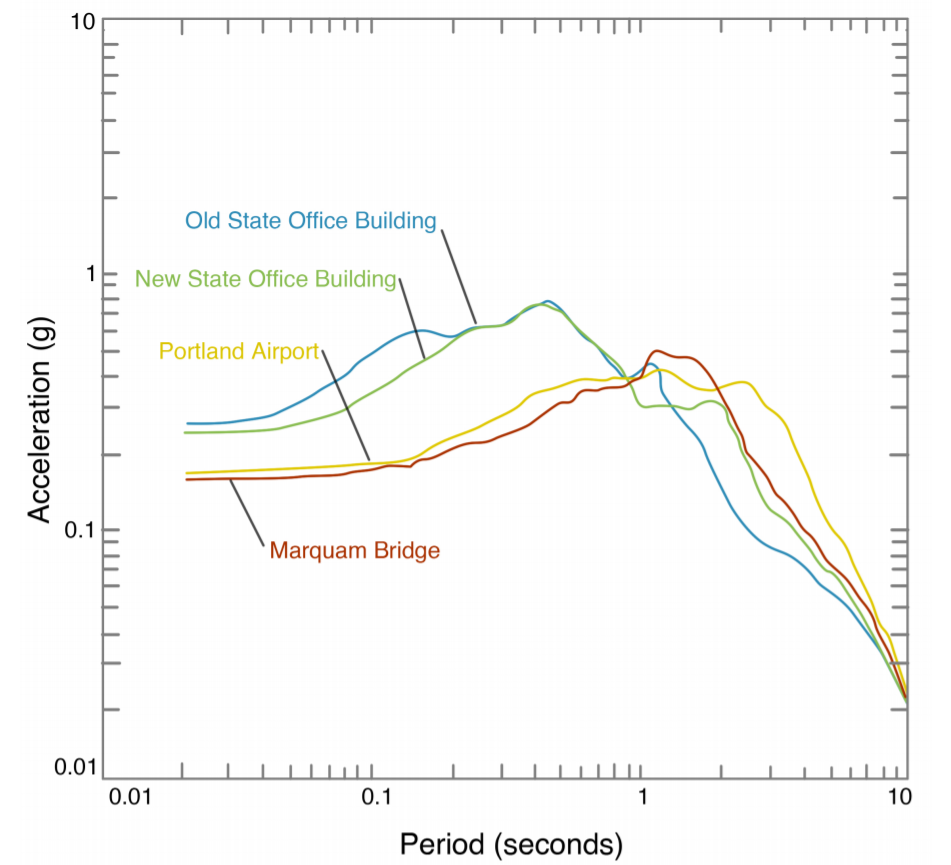
Wong and his colleagues considered the effects on four sites in Portland, Oregon, of a spectrum of waves from a high frequency with periods of 0.02 seconds to low frequency with periods of 10 seconds (Figure 8-2). The computer model of their earthquake included the slip on the assumed earthquake fault and the effect of near-surface geology. They drilled boreholes and measured the density (weight per given volume) of the various sedimentary layers they encountered as well as the speed of sound waves passing through the sediments. Soft sediment such as sand or clay is low in density, whereas bedrock such as basalt has a high density. Sound waves (and earthquake waves) pass slowly through soft sediment, and much more rapidly through bedrock.
As the seismic waves pass from bedrock to soft sediment, they slow down and increase in amplitude. The increase in amplitude causes greater acceleration of the ground at a particular site, which leads to more intense shaking. For these reasons, the thickness and density of the soft sediment layers directly beneath the surface are critical to the calculation of shaking and potential damage.
Figure 8-2 shows an example of some of their calculations, in this case for a Cascadia Subduction Zone earthquake. These are logarithmic curves; each division has a value ten times that of the previous one. The curves show that the greatest accelerations are expected for seismic waves with periods ranging from 0.4 to 2 seconds. Different sets of curves were obtained for the crustal earthquakes. There is a considerable difference in the curves among the four sites, emphasizing the importance of understanding the near-surface geology.
Another factor important in constructing these curves is the attenuation of seismic waves between the earthquake focus and the site in question. Attenuation is affected by the strength and rigidity of the crust through which the seismic wave must pass. Imagine putting your ear against the cut surface of a long log which is struck on the other end by a hammer. If the log is made of sound wood, the vibration caused by the hammer may be enough to hurt your ear. The attenuation of the wave in the log is low. However, if the log is made of rotten wood, you may hear a dull “thunk,” indicating that the attenuation is high. In the crust, high attenuation means that the strength of the earthquake wave falls off fairly rapidly with distance from the focus.
In the discussion above, we have been concerned about the effect on earthquake shaking of the geology at or near the surface of the ground. Recent research in California has shown that the path traveled by an earthquake from the source to the surface also can have a dramatic effect on shaking. Kim Olsen and Ralph Archuleta of the University of California at Santa Barbara constructed elaborate computer models of the effects of an M 7.75 earthquake on the San Andreas Fault on shaking in the Los Angeles Basin, thirty to forty miles away. The Los Angeles Basin is filled to depths of four to six miles with sedimentary rocks that have a much lower density than crustal rocks beneath the basin or in the adjacent mountain ranges. Olsen and Archuleta showed that their simulated earthquake would generate surface waves that would slow down and increase dramatically in amplitude as they entered the Los Angeles Basin. In addition, the surface waves would bounce off the base and the steep sides of the sedimentary basin, so that strong shaking would last much longer than it would at the source of the earthquake.
This effect could also be felt in sedimentary basins that are much shallower than the Los Angeles Basin. These include the Tualatin Basin in Oregon, with the cities of Beaverton, Hillsboro, and Forest Grove, the Portland-Vancouver Basin in Oregon and Washington between downtown Portland and Troutdale, and the Seattle Basin in Washington between downtown Seattle and Everett. After the Nisqually Earthquake of 2001, Derek Booth of the University of Washington surveyed sixty thousand chimneys for damage and found that chimney damage was concentrated in West Seattle, Bremerton, and other areas close to the Seattle Fault. West Seattle was also hit hard in the 1965 Seattle Earthquake. The boundary between bedrock on the south and soft sediments on the north is abrupt and steep, and Booth suggested that earthquake waves might have been focused to produce greater damage along a line parallel to the fault. The fault zone might contain highly fractured ground-up rock, giving it a lower speed for seismic waves than unfaulted rock on either side. This low-velocity zone might also focus on earthquake waves and increase the damage.
This idea was also tested in the Fraser River Delta around Vancouver, B. C., by studying several strong-motion accelerometers that were triggered by an M 5.3 earthquake at Duvall, Washington, in 1996. The shaking recorded by accelerometers in the delta was stronger than shaking on bedrock sites, as expected, but the strongest shaking was found near the edge of the basin underlying the delta, perhaps due to focusing of seismic energy.
This behavior, related to the path the earthquake wave takes from the source to the site, could be considered a large-scale example of the bowl of jello. In both cases, surface waves are amplified, but in the examples of Los Angeles, the Seattle Fault, and the Fraser River Delta, the shaking is related to the path of the earthquake wave through a thick sedimentary basin, like focusing light through a lens.
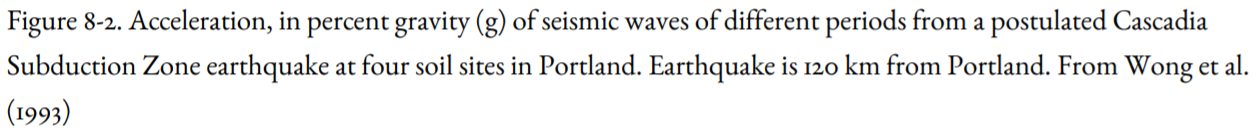
The USGS and the Geological Survey of Canada have combined all of these factors to produce maps showing peak horizontal accelerations over the next fifty years. One of these maps, revised in October 2002, is shown as Figure 8-3. The highest accelerations are forecast along the coast, closest to the subduction zone, with the highest values in northern California, which has the highest seismicity in the Northwest. However, other structures, particularly those that have ruptured historically, also affect the predicted accelerations. The 30 percent g contour curves east to include the Puget Sound region to take into account the slab earthquakes that have done so much damage there.
This map is probabilistic, but it estimates the probability of acceleration, not the magnitude because acceleration is the value that is of most importance to engineers in evaluating seismic hazard and designing building codes. For example, the Seattle-Tacoma area has a 10 percent probability that an acceleration close to 30 percent g will be exceeded in the next fifty years. This acceleration will produce intensities of VII-VIII, which did major damage in the earthquakes of 1949, 1965, and 2001. The building you are constructing is likely to have a lifetime of at least fifty years. If there is one chance out of ten that the building will be subjected to these accelerations, doesn’t it make sense to design the building accordingly?