
11.2: Saltation I
- Page ID
- 4219

Introduction
The characteristic mode of motion of sand particles in air is saltation: particles are launched from the bed, take arching trajectories of widely varying heights and lengths, and splash down onto the bed at low angles, commonly rebounding and/or putting other particles into motion. The term, introduced into geology by McGee (1908, p. 199), is derived from the Latin verb saltare, meaning to jump or leap. Movement by saltation has also been invoked for water transport of particles near the bed (see chapter 10), although the distinctiveness of saltation in water is not nearly as clear as in air.
Saltation in air became well known through the early experimental studies by Bagnold (1941), Chepil (1945), Zingg (1952), and others. In recent years there has been much attention to eolian saltation, in part because of the growing concern over desertification, and also in part because of the interest in how sediment is transported by wind on other planets—most especially, Mars. Early studies of saltation dealt in large part with the nature and dynamics of saltation trajectories. Later, especially during the late 1980s and early 1990s, emphasis tended to shift to a more unified consideration of the overall saltation system produced by a steady wind. In more recent years, this has extended to study of saltation in the unsteady winds characteristic of natural environments. Also, as computational power has grown it has become possible to develop increasingly sophisticated numerical models of saltation.
The study of saltation can be viewed as falling into several related areas:
- threshold for motion
- forces causing liftoff
- the geometry and dynamics of particle trajectories, including the distributions of jump height and jump distance
- the effects of wind velocity and of sediment size, sorting, and particle shape on mode of saltation and on saltation transport rates
- the effect of unsteadiness of the wind on saltation
- the effect of the saltation cloud on the structure of the near-surface wind
To some extent it is artificial to treat these topics separately, but nonetheless it seems helpful in developing clear understanding. Accordingly, each of these topics treated in sections below, after some comments about observing saltation.
Saltating particles are highly abrasive, because of their very large relative inertia—much greater than for water-borne particles. Both natural and artificial solid materials at heights within the saltation cloud, even hard rocks, are gradually abraded. Saltating sand also sculpts distinctive eolian landforms. Such topics are not within the scope of these notes.
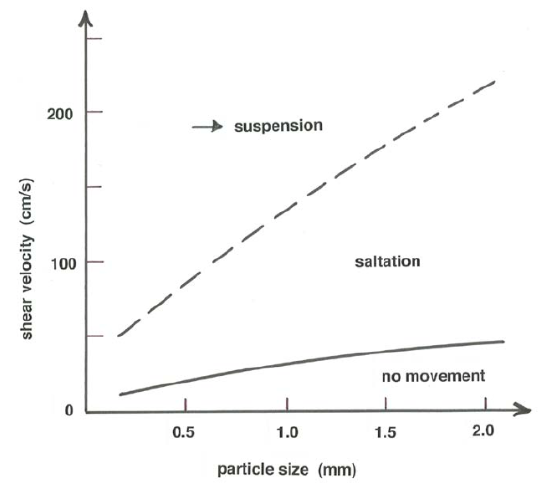
As the size of particles in saltation decreases toward the silt range, the decrease in particle mass means an increasing effect of turbulence on particle trajectories. Wind speed is important in this respect as well, inasmuch as the characteristic magnitude of velocity fluctuations from eddy to eddy increases with mean wind speed. At sufficiently fine particle sizes, and for sufficiently strong winds, the particles are carried in suspension rather than in saltation; see Figure \(\PageIndex{1}\) (in the same spirit as Figure 10.3.1 in Chapter 10), showing in cartoon form the regions of distinctive modes of eolian particle movement as a function of sediment size and wind speed. What is known about the transition from saltation to suspension is described in a later section of this chapter.
A distinction is commonly made between saltation, whereby particles take ballistic excursions well above the bed, and surface creep (also called impact creep or reptation), whereby particles are moved for short distances without losing contact with the bed surface. Particles that are too large to be moved in saltation (but not so large as to be immovable by the given wind) characteristically engage in surface creep. Particles of sizes susceptible to saltation can also move as creep, however, if a saltation impact is sufficient only to impart slight movement to a given particle on the bed surface. Even in very well sorted sediments, surface creep as well as saltation is an important mode of transport.
Observing Saltation
The very best way to appreciate saltation is to observe it for yourself. Imagine yourself out on the surface of a sand dune on a windy day. If you get your eye level down to within a few decimeters of the surface—you risk getting sand in your eyes, ears, nose, and mouth—and sight horizontally across the wind, you see a blurry layer of saltating sand, with concentration tailing off upward for as much as a meter above the surface. You are seeing the characteristic saltation cloud. Unfortunately, your eye cannot easily follow the trajectories of individual particles.
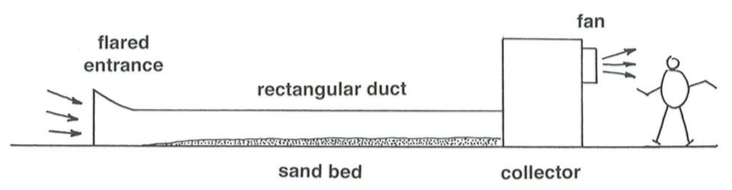
To see saltation trajectories clearly, you need to build your own wind tunnel (Figure \(\PageIndex{2}\)). That’s not a difficult matter, even if you are on a limited budget and have no more space than an ordinarily large spare room. A classic “Bagnold” wind tunnel consists of a horizontal rectangular duct, wider than high and with a flared entrance, emptying into a large box equipped with a fan mounted high in the wall opposite the downwind end of the duct. If you fabricate the roof of the duct in the form of several removable segments, it is easy to gain access to the sand bed. Because fans with continuously variable speed are not easy to obtain or arrange, it would be helpful to mount an adjustable louver just outside the fan, in order to set the wind velocity in the duct to any desired value. Lay in a planar bed of medium sand in the duct, turn on the fan, and gradually increase the wind velocity until saltation is established. The only significant difference between saltation in your wind tunnel and the saltation you observed on the sand dune is that the range of eddy sizes in the duct is much smaller, the consequence being that the wind is not nearly as gusty: the saltation is much closer to being steady (unchanging with time).
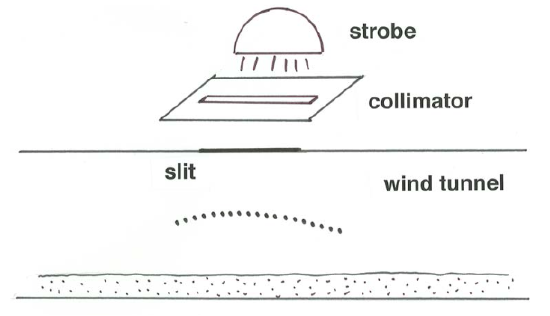
To see saltation trajectories (Figure \(\PageIndex{3}\)), cut a thin slit along the centerline of the tunnel roof, not far from the downwind end, and mount a strong light source above the slit, with a second slit between the strobe and the roof, for good collimation. With that arrangement you can illuminate a thin streamwise slice of the flow. Trajectories of saltating particles that move in this illuminated slice show up well as curving bright streaks. It would be even better to use a stroboscope as the light source. Then the trajectories show up as series of closely spaced illuminated dots. If the concentration of saltating particle is not too high, so that individual trajectories can be discriminated, then by making sufficiently careful measurements of a photographic image you could compute velocities and accelerations of individual saltating particles along their trajectories.
Saltation Trajectories
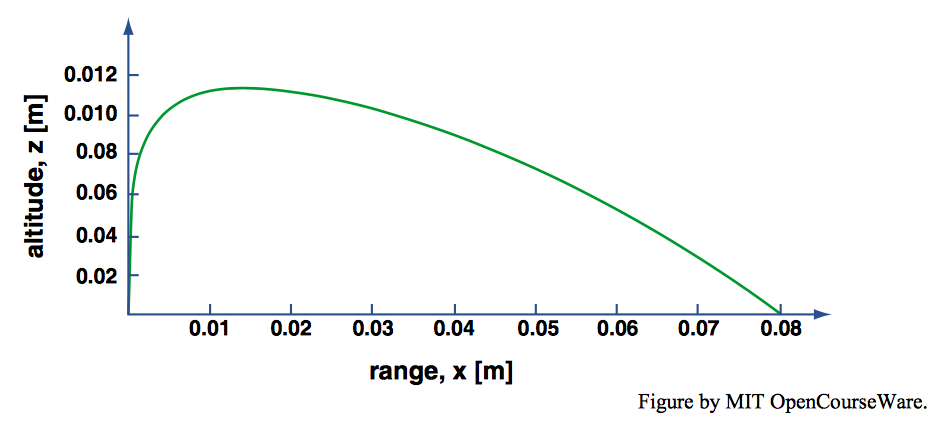
The general nature of the trajectories of saltating particles is known from early descriptions by many investigators, most notably Bagnold (1941) and Zingg (1953), but also in several later studies. Figure \(\PageIndex{4}\), from Maegley (1976), is a representation of a typical saltation trajectory from the early literature on saltation. After launch, the subsequent path of the particle is the outcome of the constant downward force of gravity (that is, the weight of the particle), on the one hand, and the fluid drag force occasioned by the motion of the particle relative to the surrounding air, which evolves as the particle traverses its path.
Although some authors have described the saltation trajectory as parabolic, what is immediately apparent about the trajectory in Figure \(\PageIndex{4}\) is that it is asymmetrical: the angle of takeoff is much larger than the angle of impact. You could make two other significant observations about saltation trajectories: they are convex upward all along their courses, from takeoff to landing; and their length, from takeoff to landing, is much greater than the maximum height they reach.
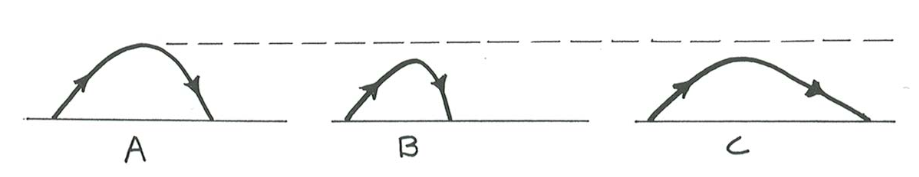
You can gain some qualitative insight into the asymmetry and upward convexity of saltation trajectories noted above by means of simple thought experiment on particle accelerations. Suppose that a particle is somehow launched into the air at some representative angle, say forty to fifty degrees, at some initial speed (Figure \(\PageIndex{5}\)). If the medium is a vacuum, you know from elementary physics that the trajectory of the particle, from takeoff to landing, would be a perfect parabola (Figure \(\PageIndex{5}\)A). If the medium is air at rest, then the height of the trajectory would be slightly smaller, because air drag adds to the downward force of gravity and makes the vertical component of deceleration during ascent smaller. Air drag also acts to decrease the horizontal component of velocity throughout the course of the trajectory, so the descent of the particle is at a steeper angle than the ascent (Figure \(\PageIndex{5}\)B).
Now suppose that the particle is launched at the same angle and initial speed into a wind stream. There are two cases to consider:
- the initial speed of the particle is less than that of the wind stream, and
- the initial speed of the particle is greater than the wind speed. (Here we assume, for simplicity, that because of the logarithmic shape of the velocity profile the particle traverses only a very thin layer of low wind velocity in the immediate proximity to the surface and thereafter finds itself, for most of its path, in a region in which the wind velocity is nearly constant with height. This does not do damage to our first-order thought experiment.)
If the initial speed of the particle is greater than the wind speed, the wind causes horizontal deceleration, just as in the case of launch into still air. Qualitatively, the shape of the trajectory is the same as in the case of launch into still air (Figure \(\PageIndex{5}\)B). If, however, the initial speed of the particle is smaller than the wind speed, the wind causes horizontal acceleration, and the steepness of the ascending part of the trajectory is smaller (Figure \(\PageIndex{5}\)C). The steepness and the shape of the descending part of the trajectory depends on the relative importance of the downward pull of gravity and the remaining horizontal acceleration, but in any case the downward path is less steep than the ascending part. What we can conclude from this simple exercise is that, by comparison of Figure \(\PageIndex{5}\)C with Figure \(\PageIndex{4}\), in typical saltation the particle is launched into the wind with a smaller horizontal component of velocity than the speed of the wind in the region well above the surface.
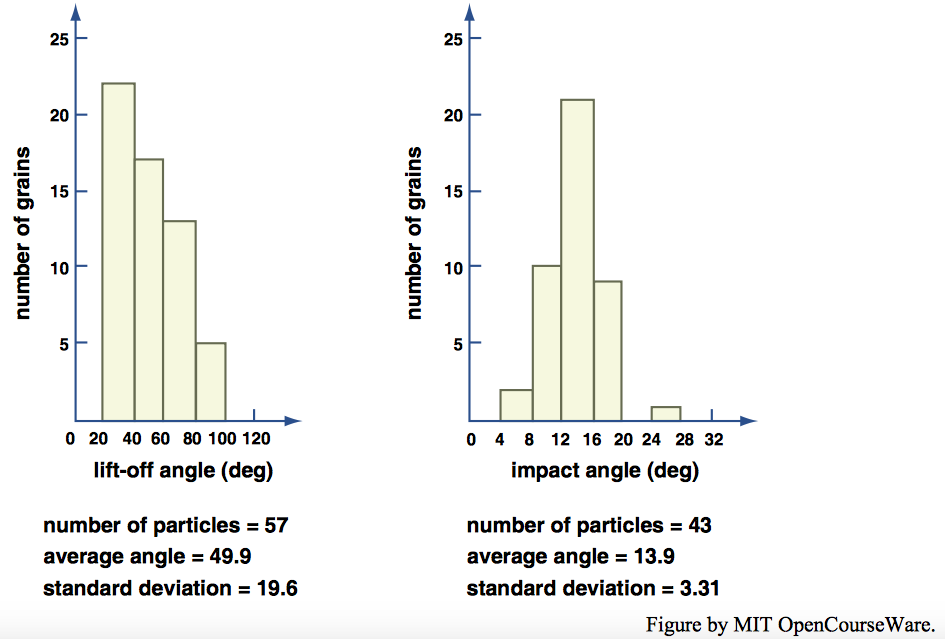
Following the early observations of saltation trajectories by Bagnold (1941) and Chepil (1945), many authors have assumed that the particles typically leave the bed at a steep, nearly vertical angle. Careful measurements of frequency distribution of takeoff angles by White and Schulz (1977), by use of the technique described above for viewing saltation trajectories in a wind tunnel, together with high-speed cinematography, showed that the average takeoff angle was \(50^{\circ}\), and less than \(10 \%\) of the particles observed had takeoff angles of more than \(80^{\circ}\) (Figure \(\PageIndex{6}\)A). A notable feature of the distribution shown in Figure \(\PageIndex{6}\)A is that the distribution is strongly skewed: the mode lies in the range \(20–40^{\circ}\), and the distribution tails off steadily toward steeper angles, but no angles less than \(20^{\circ}\) were measured. White and Schulz also found that the average angle of impact at the end of a saltation trajectory was \(14^{\circ}\) (Figure \(\PageIndex{6}\)B), and the distribution was much more nearly symmetrical.
The results obtained by White and Schulz might be questioned because they were obtained from single-size glass spheres. More recent studies have found lower launch angles. Willetts and Rice (1985), using natural sands, measured average takeoff angles of \(52–54^{\circ}\) for particles ejected from rest by impacts of already saltating particles but considerably smaller average angles of \(21–33^{\circ}\) for rebounds of already saltating particles. Nalpanis et al. (1993) measured takeoff angles of \(35–41^{\circ}\), for natural sands, and Nishimura and Hunt (2000) measured even lower takeoff angles of \(21–25^{\circ}\) for ice spheres and for spherical mustard seeds. If large and immovable particles are present on the bed surface, finer particles in saltation are observed to rebound from them upon impact at sometimes very steep angles, in some cases even with a component in the direction opposite to the wind.
Saltation Lengths
Why are the lengths of saltation trajectories so much greater than the heights? It was noted at the beginning of this chapter that the relative inertia of sand particles in air is extremely large, but nonetheless the air at all times exerts a drag force on the particles, because there is always a difference between the velocity of the particle and the velocity of the wind. Only for very fine dust particles in suspension does this velocity difference become negligible.
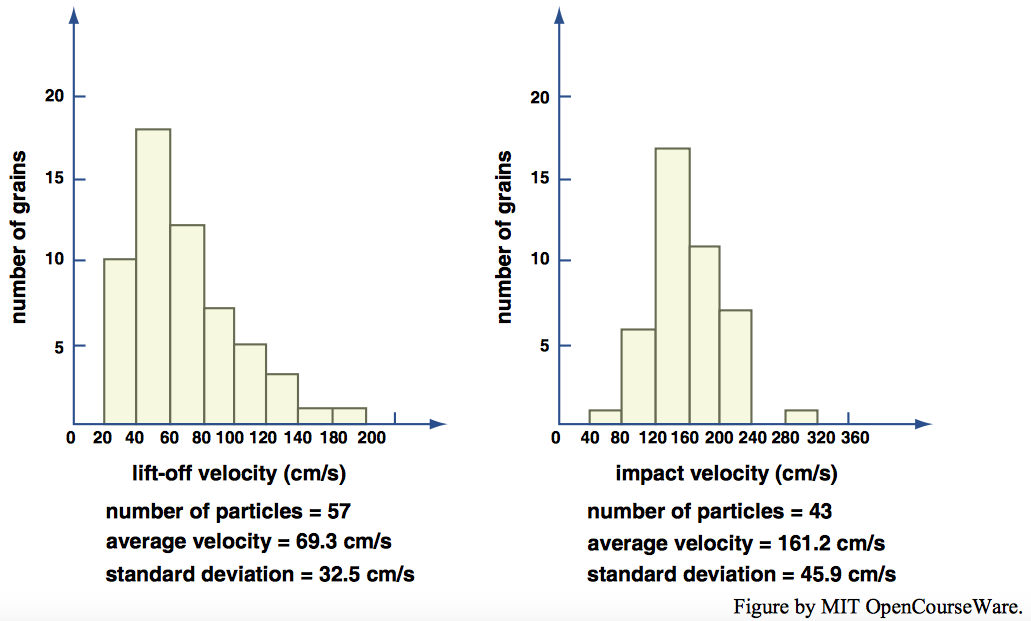
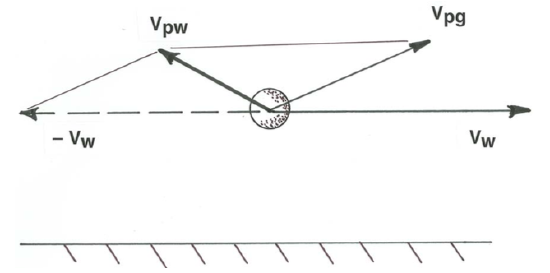
White and Schulz (1977) also measured takeoff speeds and impact speeds of saltating particles (Figure \(\PageIndex{7}\)). Takeoff speeds averaged about \(70\) \(\mathrm{cm/s}\), not much more than the friction velocity \(u_{*}\)—but keep in mind that such a value of \(u_{*}\) corresponds to wind speeds of several meters per second only some centimeters above the bed. Suppose that a sand particle is launched vertically into a wind stream at such a speed. The rising particle almost immediately encounters much higher wind speeds. At any given instant, the velocity of the particle relative to the air is the vector difference between the velocity of the particle relative to the ground and the horizontal velocity of the wind relative to the ground (Figure \(\PageIndex{8}\)). In the initial, rising part of the trajectory, this vector velocity is directed upward and upwind.
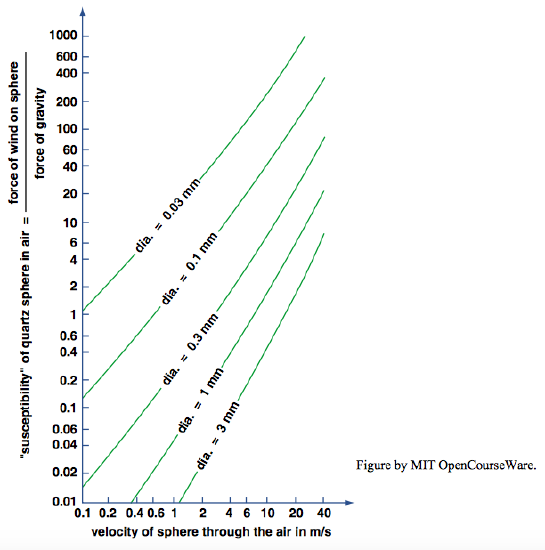
Bagnold (1941) supposed that the importance of the effect of particle speed relative to the air can be characterized by the ratio of fluid drag force to particle weight, a quantity he termed the susceptibility (although that useful term has not subsequently propagated itself through the literature on saltation). Figure \(\PageIndex{9}\), from Bagnold (1941), shows the susceptibility of several sand sizes as a function of wind speed. You can see from Figure \(\PageIndex{9}\) that for relative speeds of several meters per second the susceptibility of sizes between \(0.3\) \(\mathrm{mm}\) and \(1.0\) \(\mathrm{mm}\)—which largely span the range of sizes of saltating particle—lies between about one and ten: the air drag is greater than the particle weight, but not far greater. The implication is that the air drag does not much affect the details of the saltation trajectory but is important in determining the overall course of the trajectory. If the fluid drag were much less, the saltation length would be reduced. A further implication then seems to be that for saltation trajectories on Mars, where the density ratio \(\rho_{s}/\rho\) is even greater than on Earth, saltation height should be greater, relative to saltation length, than on Earth.
The average impact speeds of about \(160\) \(\mathrm{cm/s}\) measured by White and Schulz (Fig. \(\PageIndex{7}\)) are much less than the wind speed at heights traversed by the particles near the tops of their saltation trajectories. Given that wind speeds are greater than that down to heights of only a few centimeters, those values of impact speed tell us that the wind has not nearly “finished the job” of accelerating the particle to the prevailing wind speed before the particle descends to splash down again onto the bed.
The foregoing material is only the briefest qualitative introduction to saltation trajectories. Several authors, beginning with Bagnold, have developed methods for computing saltation trajectories; see, for example, Owen (1964) and White and Schulz (1977). As Bagnold notes, it is essentially the same problem as the practical computation of the trajectories of cannonballs and artillery shells. The basic computational problem is that neither the velocity nor the fluid drag on the particle can be assumed independently: the two evolve together.
Saltation Heights and the Magnus (Robins) Effect
It seems to be a common belief that the near-surface zone of saltation (the saltation cloud) has a well-defined upper limit. This might in part be because of the statement in Bagnold’s influential 1941 book that the saltation cloud has “a clearly marked upper surface” (p. 10). Also, Owen, in his classic 1964 paper, illustrates a series of saltation trajectories all with the same shape, height, and length (his Figure 1), which a casual reader might assume was intended to represent real saltation—but Owen in fact took care to point out that the figure was meant only to illustrate the simplifying assumptions he made in his study, and that the saltation “in reality must be endowed with a certain randomness” (Owen, 1964, p. 226).
It is clear, from later observational studies, that for a given sand and wind there is a considerable variation in the height to which saltating particles rise. This shown perhaps most clearly by results of measurements of sand transport rate as a function of height above the bed. Using beds of moderately well sorted sand, both Zingg (1953) and Williams (1964) found that the sediment transport rate, per unit width across the wind and for unit height above the bed, varied as a negative exponential function of the height above the bed. Several later studies have shown similar results. (For more on sand transport rates in saltation, see the later section.)
If you go back to what you learned in Physics I, you can easily compute the theoretical height to which a saltating particle would rise in the contrary-to-fact case of no air drag on the particle. The particle has some initial kinetic energy, \(mv^{2}/2\), where \(m\) is the mass of the particle and \(v\) is the initial speed of the particle. As the particle rises, against the pull of gravity, its kinetic energy is converted to potential energy of height, \(mgh\), where \(g\) is the acceleration due to gravity and \(h\) is height above the bed. To find the maximum height of rise, at the top of the parabolic trajectory, set the kinetic energy equal to the potential energy and solve for \(h\): \(h = v^{2}/2g\).
The value of the no-air-drag result is that it serves as a standard for comparison of actual saltation trajectories. In light of what was said in the earlier sections on saltation trajectories, we might conclude that real trajectories should always have a lesser maximum height of rise, owing to air drag. We would, however, be mistaken: experiments (e.g., by White and Schulz, 1977) slow clearly that saltation heights are even greater than the no-air-drag value (Figure \(\PageIndex{10}\)). The reason seems to lie in the spin of the saltating particles.
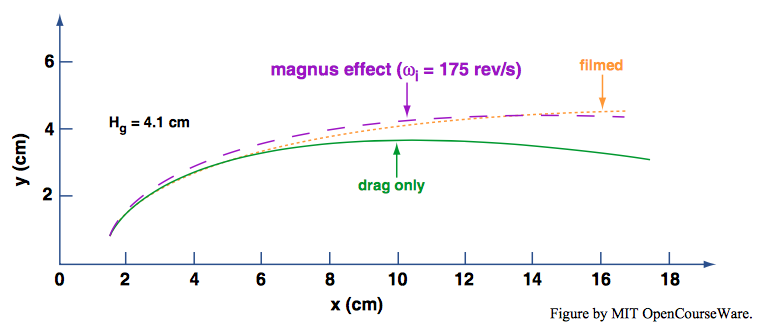
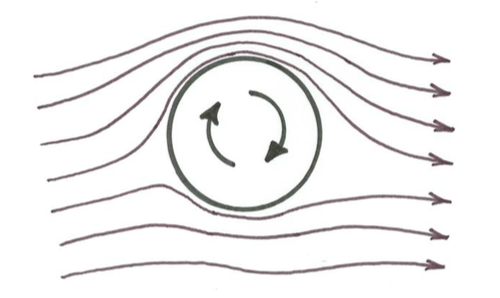
As observed early on by Chepil (1945), particles in saltation have spectacularly high spin rates of hundreds of revolutions per second. The spinning must somehow be imparted to the particles at, and/or soon after, takeoff into the wind stream. Spinning generates a lift force that acts while the particle is in flight. This effect of spinning is generally called the Magnus effect for cylinders and the Robins effect for spheres (Figure \(\PageIndex{11}\)). Rotation of the particle changes the streamlines so that they are no longer symmetrical about the particle: streamlines are closer together above the particle, implying that velocities are greater there than they are below the particle (Figure \(\PageIndex{11}\)). From the Bernoulli equation (Chapter 3) it follows that the pressure is less above the particle than below, and the particle experiences a lift force. The variation in lift coefficient with rate of spinning is known, so the lift force can be calculated. White and Schulz (1977) could account for the observed saltation trajectories only by taking this effect into account. For most observed trajectories the rate of spinning could not be observed directly, but a good fit of observed trajectories to theoretical calculations could be made by assuming a rate of spin of several hundred revolutions per second. This is known from photographic studies to be about the right value for the spin.
Threshold of Motion for Eolian Sand Transport and the Question of the Forces that Cause Saltation
Clearly, no particles at rest on a broad horizontal surface of sand are set in motion until the wind reaches a certain strength. At wind speeds below the threshold for movement, the forces on the sand particles are the same as was discussed in Chapter 9 for water flows, because the fluid dynamics of the wind very near the ground is the same for air as for water. As in water flows, the nature of the fluid forces on the bed-surface particles—pressure forces and viscous forces, which can be resolved into a drag component, parallel to the bed, and a lift component normal to the bed—are a function of the particle Reynolds number. In fact, much of what is known about lift and drag forces as a function of particle Reynolds number has been learned from experiments in wind tunnels, beginning with Einstein and El-Samni (1949) and Chepil (1958, 1961).
The difficulties in defining the onset (or even the existence) of a definite threshold flow strength as discussed in Chapter 9 for sediment under water flows exist for sediment under air flows as well, although with certain important differences. As you saw in Chapter 9, in water flows the sediment transport rate in the range of flow strengths for which the threshold might be located is wide, and the mode of movement (bed load) is the same over that range. In contrast, in air flows a different mode of sediment movement—saltation—sets in soon after movement begins, and transport rates increase far more rapidly once sediment movement begins than in water flows.
As the wind speed increases, particles are set in motion by the fluid forces. Beginning with Bagnold, this has been called the fluid threshold or the aerodynamic threshold. Soon after particle motion starts—in just a few seconds—saltation sets in, in a kind of cascade whereby the concentration of saltating particles increases rapidly to its equilibrium state. Then, if the wind speed decreases, the saltation eventually ceases. The condition of cessation of saltation is called the impact threshold. One of the first-order facts about saltation is that the fluid threshold is at a wind speed less than the fluid threshold, as first remarked by Bagnold (1941) and confirmed observationally many times since. There is thus a strong hysteresis effect in saltation.
There has been a long-standing controversy about whether bed particles hop and roll for a brief time before cascading into fully developed saltation, as first proposed by Bagnold (1941), or whether they vibrate in place, in response to the rapidly fluctuating fluid forces they feel, before finally being launched into movement above the bed surface, as reported by soil scientists studying entrainment of soil particles by the wind. The consensus seems to be that, in the case of sand particles, the sand particles undergo some brief movement as bed load for a brief time before saltation develops.
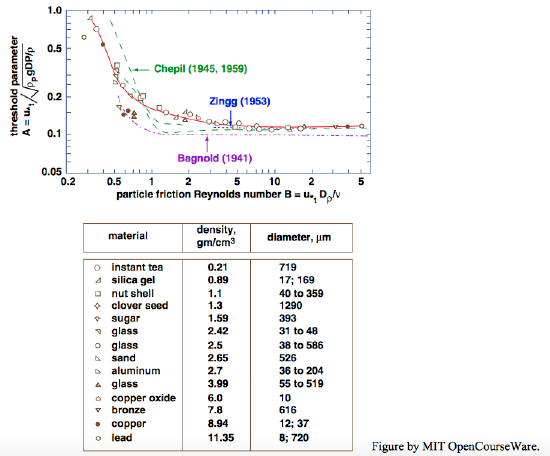
Observations of movement threshold under air flows have been made since the early days of the modern era of research on sand movement by the wind. Following on early studies by Bagnold (1941), Chepil (1945, 1959), and Zingg (1952, 1953), Iversen et al. (1976a) made extensive observations of eolian thresholds by use of sediments of varying size, density; their results (Figure \(\PageIndex{12}\)) show a nearly constant value of threshold Shields parameter for boundary Reynolds numbers down to about five, and then increasing threshold Shields parameter with further decrease in boundary Reynolds number. As mentioned in Chapter 9, the Shields parameter for threshold under air is somewhat greater than for under water, for the same values of boundary Reynolds number.
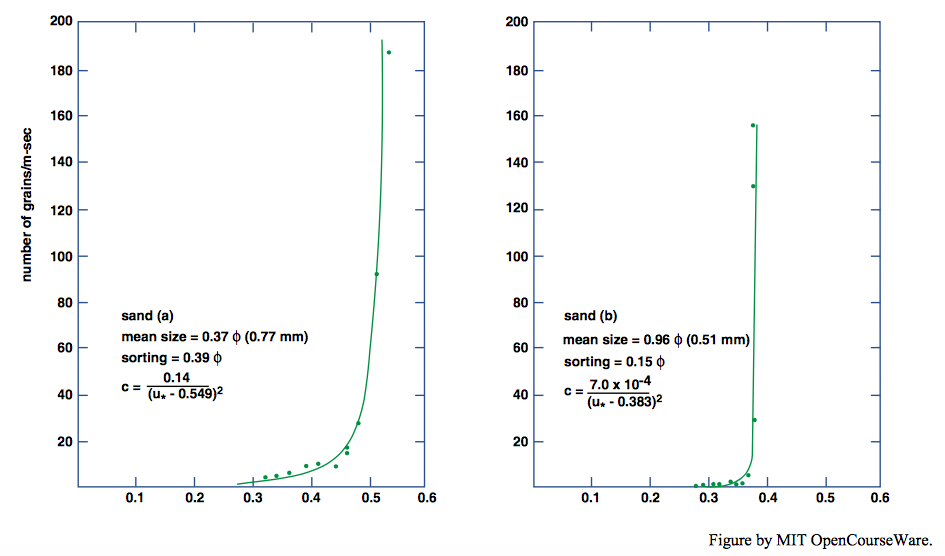
Nickling (1988) devised an experiment in which particles newly set into motion at near-threshold conditions were observed by means of a horizontal laser beam directed horizontally across the flow one millimeter above an originally intact planar sand bed. Sediments with a range of size and sorting were used. Nickling’s results showed (Figure \(\PageIndex{13}\)) that for the relatively poorly sorted sediments there is a range of flow strengths (as measured by the shear velocity) for which small number of particles are moved before flow strengths become great enough for saltation to begin, whereupon the number of particles in motion increases sharply. For the relatively well-sorted sediments, however, that range of flow strengths effectively vanishes: saltation begins immediately upon attainment of motion brought about by the fluid forces.
Most studies of threshold of eolian transport have been made in wind tunnels, in which nearly steady winds can be arranged. In the field, observations of threshold are far more difficult, in large part because winds across natural sand surface are much gustier, owing to the much larger scale of eddies in the lower atmosphere. In small wind tunnels, fluctuations in bed shear stress with time at a point are short relative to the time scales of saltation of individual particles, whereas in the field they are typically far longer. Such considerations point toward a later section of this chapter, on saltation in unsteady winds.
The forces that cause a particle to be launched into a saltation jump in the wind have been controversial. There are two candidates: aerodynamic forces of lift and drag, and impacts by other saltating particles as they splash down onto the bed. (Of course, the two could, and probably do, act in concert; the question is which is the more important.) The moderate to large takeoff angles of saltating particles do not in themselves indicate the relative importance of the two kinds of forces: it might be supposed that strong aerodynamic lift forces should be responsible for steep takeoff angles, but it is clear also that similarly steep angles can be the result of rebounds upon splashdown. The controversy dates back to the early days of the modern era of study of eolian sand movement: Chepil (1945, 1961) considered aerodynamic forces to be dominant, whereas Bagnold (1941) believed saltation impacts to be principally responsible for saltation takeoff.
It seems clear that the presence of the saltating particles extracts momentum from the wind within the saltation layer, as discussed in a later section, so the fluid shear stress on the bed must be much less than would be the case with the same sand bed and with the same overlying wind but with the bed particle immovable. Owen (1964) went so far as to hypothesize that the shear stress exerted by the wind on the sand bed is just sufficient to maintain the surface particles in a mobile state. The implication of that hypothesis is that the aerodynamic forces of lift and drag should be much less important in maintaining saltation than rebound of particles, as well as mobilization of other particles, at the point of collision.
Theoretical models of continuous saltation, beginning with Tsuchiya (1969, 1970) and Reizes (1978), demonstrate that saltation can continue once started, without the necessity of any fluid lift or drag forces acting on particles resting on the bed, but they do not lead to any predictions about particle trajectories that can distinguish this hypothesis conclusively from the fluid-force hypothesis.