
13.11: Examples of Satellite Evaluations of Ocean Productivity
- Page ID
- 10360

Examples of Satellite Evaluations of Ocean Productivity
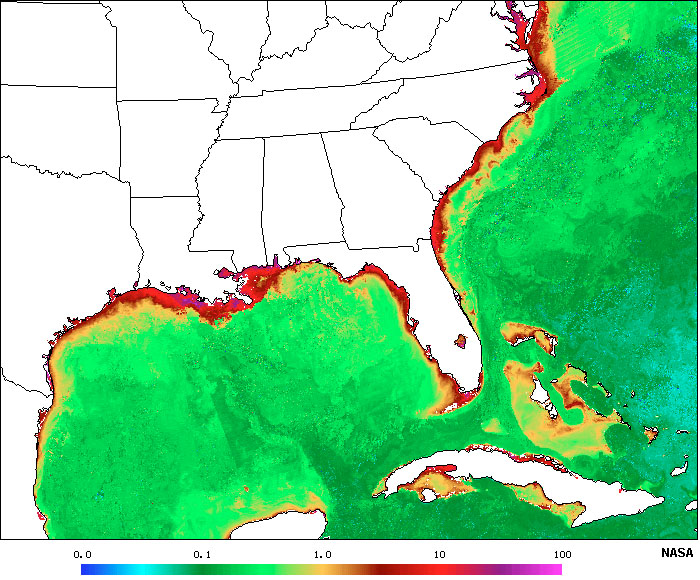
Figure 13.25 is a satellite composite image showing the Gulf of Mexico and East Coast of the United States. Warm water at the surface creates a strong thermocline preventing nutrient upwelling in the open ocean. However, nutrients from rivers and stream are abundant along coastal waters, allowing phytoplankton to proliferate.
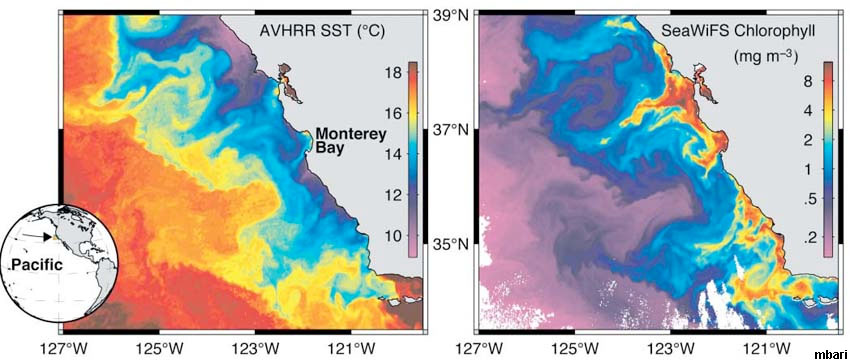
Figure 13.26 compares sea-surface temperatures to chlorophyll productivity, revealing regions of upwelling along coastal California.
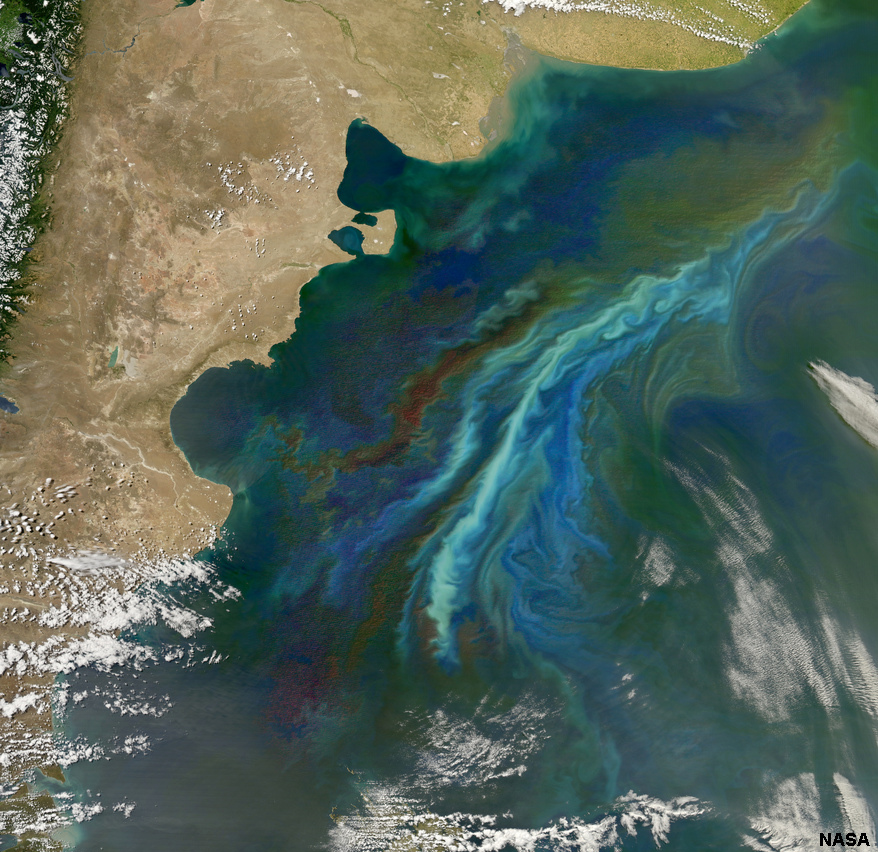
Figure 13.27 shows an image generated from data captured by NASA’s Aqua satellite used a Moderate Resolution Imaging Spectroradiometer (MODIS). It shows a massive phytoplankton bloom off of the Atlantic coast of Patagonia (Argentina). Seven different spectral bands (visible light and infrared) were used to accent the differences in the plankton communities in the ocean (this is a false-color composite image).
These green and blue shades indicate phytoplankton blooms developed on the continental shelf off of Patagonia. This is where warmer, saltier coastal waters and currents from the subtropics meet the colder, fresher waters flowing up from the south. Where these currents collide turbulent eddies form, allowing nutrients to well up from the deep ocean. In addition, the nearby Rio de la Plata supplies nitrogen and iron-laden sediment into the sea just north of the area shown in the image.
 |
 |
 |
| Figure 13.25.Productivity along the East Coast. | Figure 13.26. Productivity along coastal California | Figure 13.27. Phytoplankton blooms off of Patagonia (Argentina). |