
10.12: Surfer's Guide to Wave Forecasting for San Diego County
- Page ID
- 10316

Surfer's Guide to Wave Forecasting for San Diego County
San Diego County Swell Window
• The compass bearing window that we can receive swell from is between 180° and 340° (Figure 10.27). Waves are weak on the “edges” of this window. The best part of our window is really between 200° and 300° degrees because the waves simply have to bend too much to be received on our coastline if they are outside of that range.
• North San Diego County is better for S + SW Swells
• South San Diego County is better for N + NW Swells
• Everyone loves a West Swell!
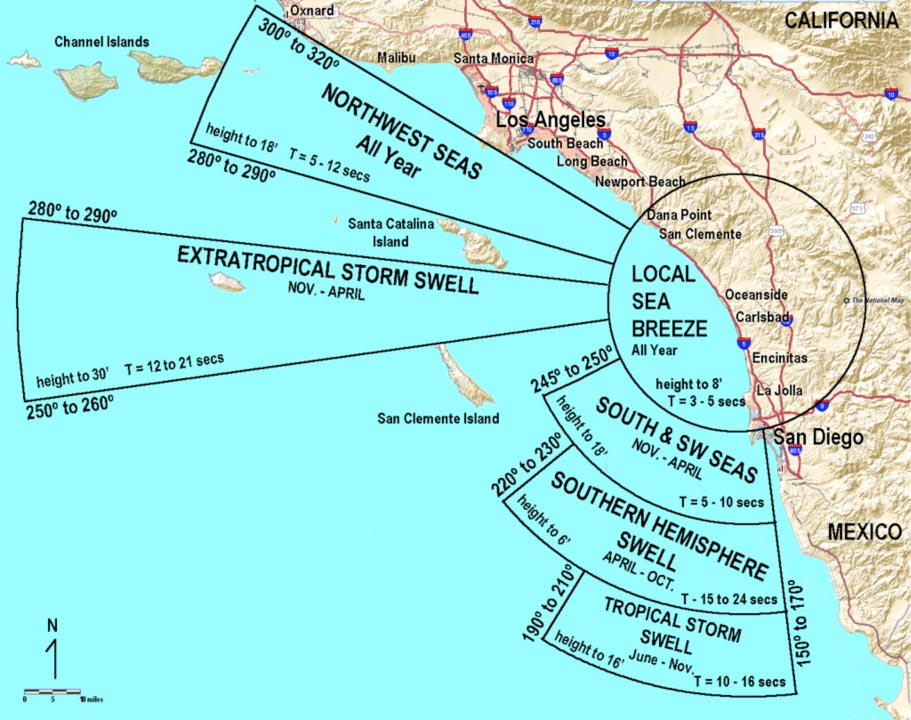
Figure 10.27. The swell window for San Diego County is roughly between 180° and 340° (with North being 360°).
Getting Swell Information Data Real-Time
Casual surfers in San Diego County can get forecasts of waves from a number of surfing and weather websites. However,
professional surfers (and swell wave forecasters for navigation and other purposes) use real-time buoy information available from the National Data Buoy Center (NOAA) network to evaluate swell period and height in different parts of the Pacific Ocean basin and around the world. Data from this system is incorporated into many government weather and commercial shipping navigation websites and several surfing organization websites.
For example: check this maximum wave energy animation: http://www.surf-forecast.com/
Surfers check at distant buoy locations to look for increases in wave period, but not so much in wave height. (Why?)
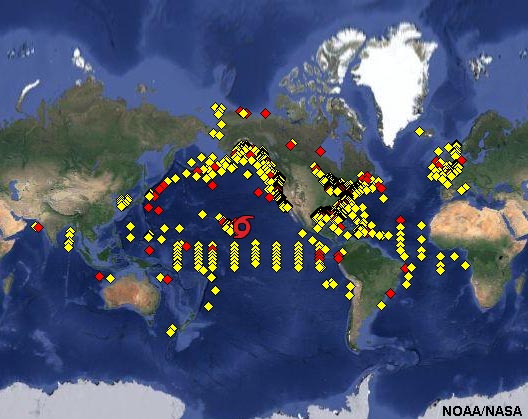
Figure 10.28. Location of buoys associated with the National Data Buoy Center (NOAA)
Summer Swells Affecting San Diego County
• Swell generated between Antarctica and New Zealand dominates the world oceans much of the year because it is a region with large storms (largest on Earth), and there is constant wind (infinite duration) and unhindered passage over open waters (infinite fetch)(Figure 10.29).
• In the northern Pacific Ocean, storm track is always west to east.
• Initial angle is 210 degrees (west-southwest), then moves towards 180 degrees (south) and out of our swell window.
• The largest summer surf is in northern San Diego County comes from the south.
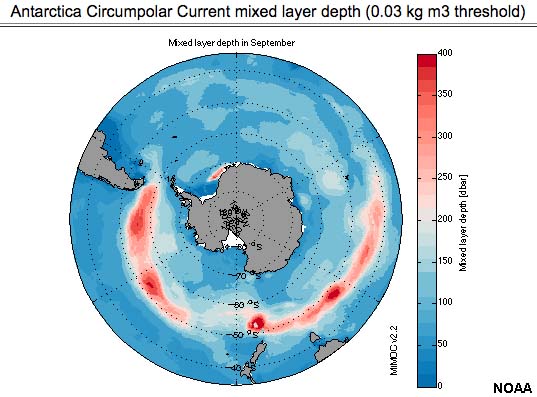
Figure 10.29. The Antarctic Circumpolar wind belt is the source of most swells. Why?
Winter Swells Affecting San Diego County
• Winter swells are largest swells on average in San Diego County
• San Diego's winter swell is mostly generated in the Gulf of Alaska, most begin off of the Kuril Islands
• Storm track is generally from west to east
• Early season swell is usually more northerly (N or NNW direction or about 320 to 340 degrees).
• Later season storms drop farther south and give us a more westerly swell direction from about 280 to 300 degrees. We also get more rain from these storms.
• Partial swell blockage occurs in the Southern California Bight from wave shadows created from the Channel Islands.
• During the winter the largest surf is in southern San Diego County and northern Baja. We also can get colder water and upwelling conditions.
Locally Generated Swell In San Diego Region
We have a number of locally generated swells that come from smaller storms in the Pacific Northwest.
• These storms produce surf that has a shorter period (between 6 and 10 seconds) because the storms are not very large.
• The swell angle is very steep from the north-northwest around 320 to 340 degrees.
• We often get upwelling associated with these storms as well.
Hurricane Swell In San Diego Region
During the late summer and early fall we can get swell from hurricanes that form off of the coast of mainland Mexico.
• The wave periods generated from these storms is usually between 10 and 14 seconds.
• The key identifying waves from these storms is the angle. The swell angle begins from the S or SSE between 160 and 180 degrees. The angle increases with time as the storm moves up the coast and either onshore or out to sea towards Hawaii.
![]()
Figure 10.30. A southwest swell coming in at Beacons Beach, Encinitas, San Diego County, California.