
9.15: Sea Level Changes Caused By Glaciation Cycles
- Page ID
- 10294

The most recent ice age is called the Wisconsin Stage or Wisconsin Glaciation—it began about 85,000 years ago and ended about 11,000 years ago. The peak of the last ice age, about 26,500 years ago when massive continental ice sheets, ice caps, and alpine glaciers cover much of northern Europe and North America, more extensive glaciers in Antarctica (Figure 9.32). This displaced nearly 10 million cubic miles of ocean water onto the land to be stored as ice. At the peak of the last ice age, glaciers covered about one-third of the land surface. Modern Greenland and Antarctica ice sheet were more extensive than they are today. With water trapped as ice on land, sea level fell around the world by as much as 400 feet below current sea level, exposing all the regions that are now submerged on continental shelves. The location of shelf breaks around the world shows that sea level where coastlines existed at the peak of the last ice age. Research shows that onset of deglaciation began about 20,000 years ago in the Northern Hemisphere with a massive rise in sea level starting starting about 14-15,000 years ago with deglaciation of the West Antarctic Ice Sheet.
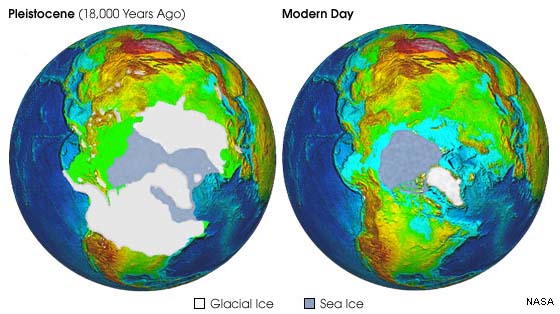
Figure 9.32. Extent of glaciers and sea ice during the peak of the last ice age and today in the Northern Hemisphere.
According to a USGS source, the glaciers currently store about 69% of the world's freshwater (preserved as ice). If all land ice melted the seas would rise about 70 meters (about 230 feet). During the last warm period (an interglacial stade) about 125,000 years ago, sea level rose about 18 feet higher than the current level. About three million years ago, before the major continental glaciation cycle began, sea level was as much as about 165 feet higher than today.
Glacial Cycles Interpreted From Ice Cores and Ocean Sediments
Drilling programs have collected ice cores from the Antarctic and Greenland ice sheets, and many more cores have been collected from marine sediments from around the world. Using geochemical methods and isotopic dating techniques the history of the chemistry of the oceans and atmosphere, and sea level changes through time are well documented (Figure 9.33). For instance, ice has tiny bubbles trapped in them that preserve the chemistry of the air and ice at the time it formed. Sea sediments are loaded with many organic and inorganic materials that can be studied and dated. Shell material of foraminifera contain stable isotopes of carbon and other elements that match the chemistry of seawater at the time that they lived. When glaciers form, the water that forms as ice in polar regions is enriched in light isotopes of oxygen and carbon (light isotopes evaporate from seawater faster than heavy isotopes). As a result, sea water at the peak of glaciation cycles are enriched in the heavy isotopes of carbon and oxygen. The ratios of these isotopes are preserved in microfossil shell material. As a result, scientists have been able to clearly reconstruct a "sea level curve" compared with atmospheric greenhouse gases.
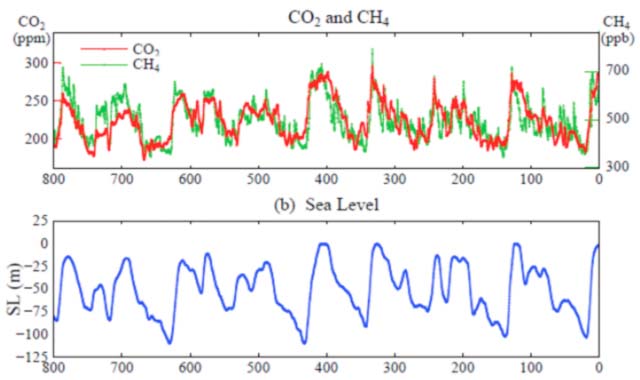
Figure 9.33. Comparison of concentrations of greenhouse gases with the sea level curve for the last 600,000 years.