
7.1: Introduction
- Page ID
- 16204

In this chapter we consider the hydrodynamic, sediment transport and morphodynamic processes in the cross-shore direction that determine the coastal profile shape. In the first instance, we will discard any structural losses both due to longer term cross- shore effects like sea-level rise, shoreface feeding and aeolian losses (discussed later in this chapter) and due to longshore sediment transport gradients (discussed in Ch. 8) that lead to structural changes in the mean shoreline position.
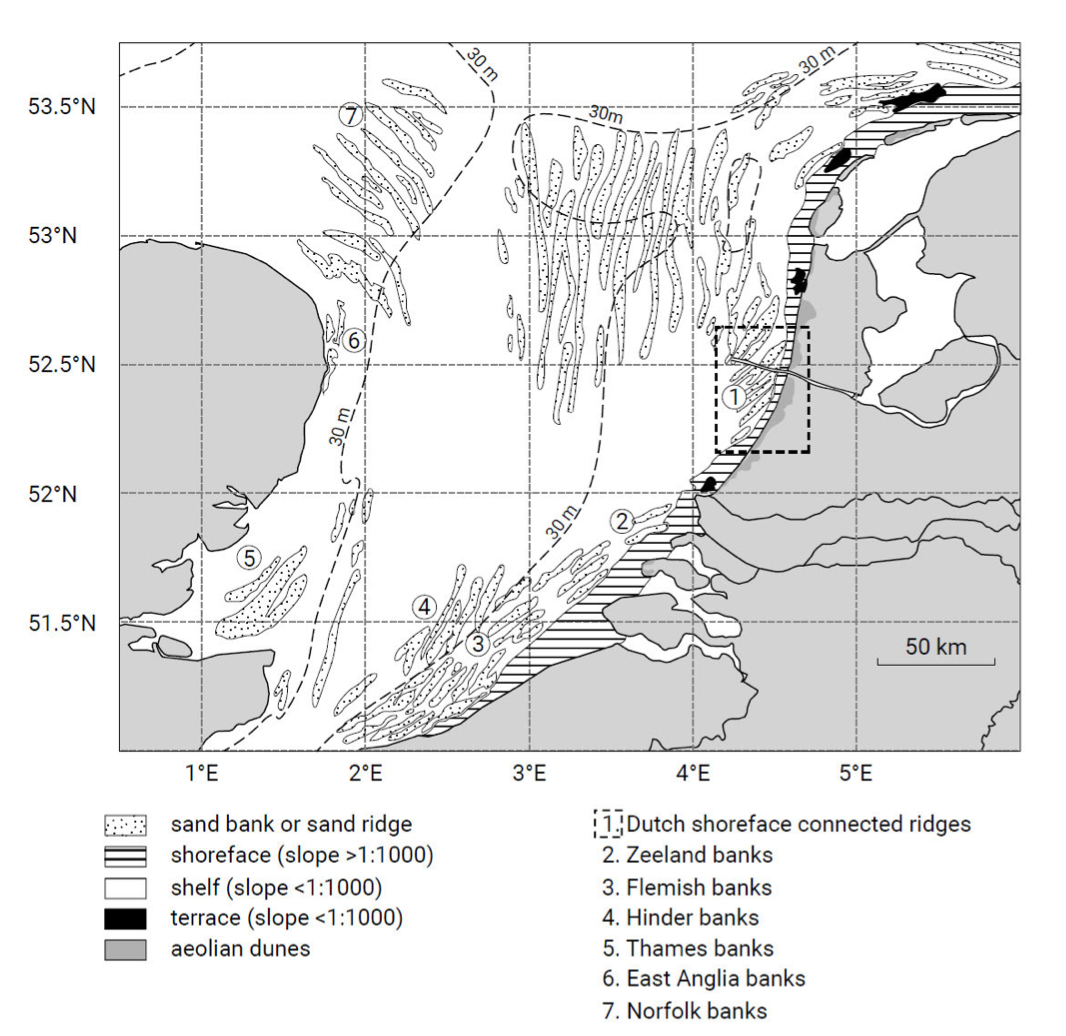
Figure 7.1: The shoreface (horizontal lines) and the shelf (white) in the southern part of the North Sea with linear sand banks or ridges on the shelf and along the central Dutch coast or Holland coast connected to the shoreface (dashed box) (adapted from Van de Meene & Van Rijn, 2000). In front of the Southwest Delta and Wadden coasts, the bed slope flattens from ~1 : 100 to ~ 1 : 1000 at water depths of about 20 m, whereas in front of the Holland coast the transition occurs at a water depth of about 16 m (see also Intermezzo 7.1).
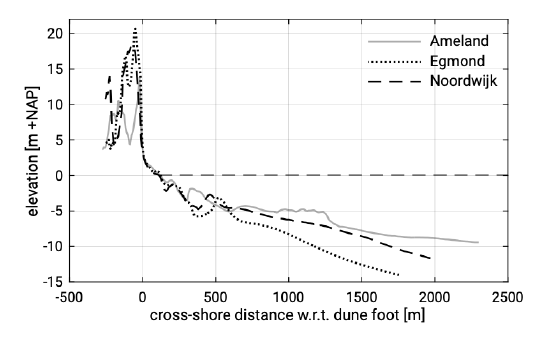
Figure 7.2: Three instantaneous cross-shore profiles along the Netherlands coast at the three locations as indicated in the map of Fig. 7.3. The cross-shore distance is relative to the dune foot, here defined as MSL +3 m. Note the flat coastal profile of Ameland as compared to the steeper central Holland coast (i.e. Egmond). (Data from JARKUS, n.d.)
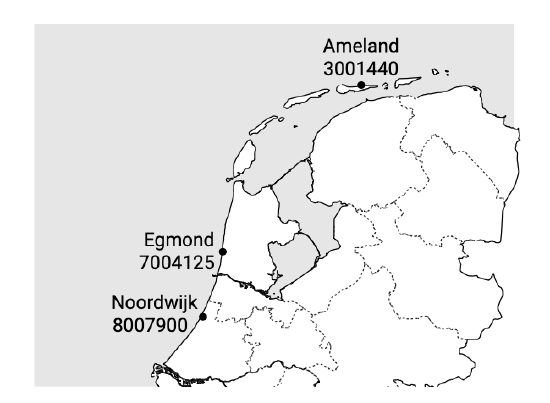
Figure 7.3: The location of the three instantaneous cross-shore profiles along the Netherlands as shown in Fig. 7.2. The JARKUS transect numbers refer to the kustvak number (first digit), and the last digits refer to the alongshore distance w.r.t. a reference transect which differs for each kustvak. For example, the transect near Egmond is in kustvak 7, 41.25 km south of Den Helder (which is the first transect in kustvak 7).
Let us first define what the coastal profile is. On a long timescale, say decades to millennia, the coastal profile or shoreface extends from the shelf to the sub-aerial (‘under the air’, i.e. exposed to the air) beach and dune system (see Figs. 7.1 and 7.2). In this zone we observe generally parallel or nearly parallel depth contours, while the profile slopes are generally steeper than 1 in 1000. We conjecture that this depth-contour configuration is mainly caused by cross-shore processes and that these processes are dominated by wave action. On the shelf (see Fig. 7.1) we may observe three-dimensional morphologies (sand banks, sand ridges and shoreface-connected sand ridges) that are commonly a result of tidal action and generally have only secondary impacts on the coastal profile. Shelf slopes are generally smaller than 1 in 1000.
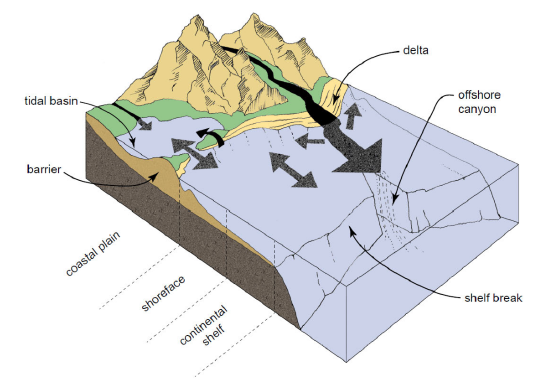
The response of the coastal profile to wave action is extremely depth-dependent, i.e. the shallower the depth, the faster the response. We therefore introduce a global zoning, viz. the lower shoreface, the upper shoreface (Fig. 1.14) and the backshore (the coastal plain in Figs. 1.15 and 7.4). As stated above, at this moment we ignore longer term cross-shore and alongshore effects and concentrate on shorter term cross-shore effects and we assume that the backshore is simply a dune or cliff (as in Fig. 7.2), high enough to prevent overwash and without alongshore gradients. In this particular case the lower shoreface (large depths) responds slowly to wave action, while the upper shoreface and the dune or cliff backshore (shallow depths) respond fast.
We define the upper shoreface to consist of the surf zone, the beach and the first dune row or cliff face. This zone responds nearly instantaneously to wave action, which we may notice on the shoreline if disturbed by human interference, such as a sand castle. Also in the surf zone we observe that surf zone bars – if present – respond on the timescale of events, i.e. storm events may move the surf zone bars offshore, while more moderate wave action may move them onshore (Sect. 7.5). Under more extreme conditions, when the water level rises due to a storm surge, the upper beach or even the dune or cliff face will respond. The upper beach may develop a scarp (a nearly vertical slope along the beach as a result of erosion) under moderate surge, while the dune or cliff face under a high surge level reaching the dune or cliff face may undergo surge erosion. We will treat these extreme events at a later stage.
On longer timescales, say many decades to millennia, the whole shoreface profile is morphodynamically active (cf. Stive and De Vriend (1995)). However, on shorter times-cales, say hours to a few decades (engineering scales), the lower shoreface shows negligible activity compared to the upper shoreface. In the field of coastal engineering it is therefore often assumed that the morphologically active zone extends from the first dune or cliff face to just a little offshore the surf zone at the upper part of the lower shoreface at a depth (relative to MSL) of about twice the wave height extreme which is exceeded for example twelve hours per year1. A second coastal engineering assumption is that – although the active zone may display profile variability in response to instantaneous, episodic or seasonal forcing – the active profile shape remains at a dynamic equilibrium when averaged over time (say years to decades) and alongshore space (say 100 m to 1000 m). Unless alongshore sediment transport gradients exist, it is a third common coastal engineering assumption that the amount of sediment in the active zone remains unchanged which implies that there is no structural loss. The above three assumptions form the basis for the modelling of year to decade averaged shoreline changes treated in Ch. 8.
However, there exist a number of arguments to also pay attention to the morphodynamic behaviour of the upper shoreface on timescales shorter than a year. Amongst these arguments is the necessity to give insight into the profile and plan form variation of the upper shoreface for infrastructure design and beach use purposes.
With the above in mind, we will therefore treat the following topics. In Sect. 7.2 we discuss the concept of a dynamic equilibrium shoreface profile, which ignores profile and plan form dynamics on scales shorter than years. This concept is instrumental in the modelling of year to decades averaged shoreline changes and in the design of upper shoreface nourishments. Subsequently, in Sect. 7.3, we treat the dynamic variations of the upper shoreface profile and plan form on timescales shorter than a year, including surge-induced dune erosion. This gives us insight into the upper shoreface profile variations on shorter timescales, which is relevant for the safety of nearshore infrastructure and for recreational beach use. Section 7.4 then considers structural changes to the position of the upper shoreface profile on longer – say decades to millennia – timescales when the assumption that the amount of sediment in the active zone remains unchanged is violated. Finally, in Sect. 7.5 we discuss cross-shore sediment transport processes that are relevant for both the dynamic equilibrium profile and the inter-annual variations therein.
The shoreface is the active zone between the shore and the continental shelf. The upper shoreface is the zone with regular and dominant wave action, whereas on the lower shoreface wave action only occurs during larger storm events. The Dutch upper shoreface is the beach and surf zone with breaking waves and breaker bars between the waterline and approximately the NAP −8 m depth contour with mean bed slopes varying between 1:50 to 1:200. The Dutch lower shoreface is the zone between approximately the NAP −8 m and NAP −20 m depth contours with typical bed slopes between 1:200 and 1:1000, and where sand ridges may be present. Offshore the shoreface merges with the continental shelf where the slope is generally less than 1:1000; tidal sand waves and sand banks may be present here.
1. Hallermeier’s annual closure depth (see Sect. 7.2.3) corresponds to the surf zone width for extreme conditions exceeded twelve hours per year. Hence, since \(h_b = H_b/\gamma\), the depth of closure is more than twice the wave height extreme.