
11.2: A Simplified Description of the Global Circulation
- Page ID
- 9597

This section summarizes “what” happens. The subsequent sections explain “why” and “how”.
Consider a hypothetical rotating planet with no contrast between continents and oceans. The climatological average (average over 30 years; see the Climate chapter) winds in such a simplified planet would have characteristics as sketched in Figs. 11.3. Actual winds on any day could differ from this climatological average due to transient weather systems that perturb the average flow. Also, monthly-average conditions tend to shift toward the summer hemisphere (e.g., the circulation bands shift northward during April through September).
11.2.1. Near the Surface
Near-surface average winds are sketched in Fig. 11.3a. At low latitudes are broad bands of persistent easterly winds (U ≈ –7 m s–1) called trade winds, named because the easterlies allowed sailing ships to conduct transoceanic trade in the old days.
These trade winds also blow toward the equator from both hemispheres, and the equatorial belt of convergence is called the intertropical convergence zone (ITCZ). On average, the air at the ITCZ is hot and humid, with low pressure, strong upward air motion, heavy convective (thunderstorm) precipitation, and light to calm winds except in thunderstorms. This equatorial trough (low-pressure belt) was called the doldrums by sailors whose sailing ships were becalmed there for many days.
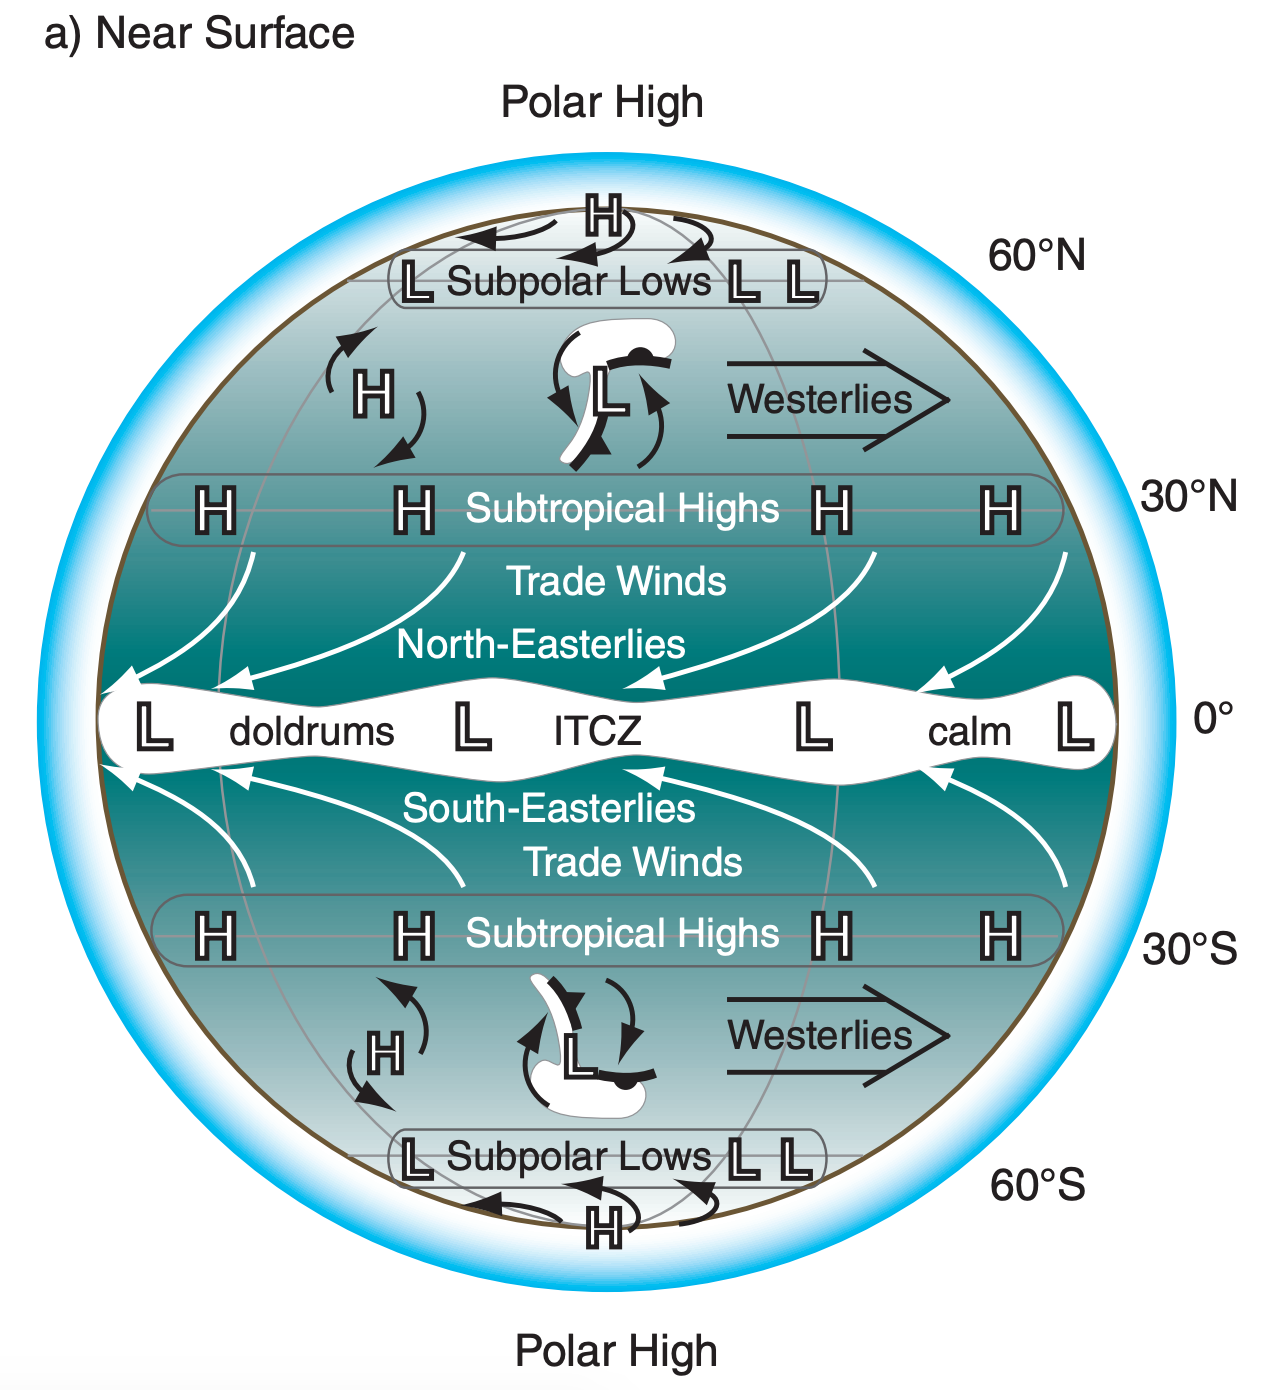
At 30° latitude are belts of high surface pressure called subtropical highs (Fig. 11.3a). In these belts are hot, dry, cloud-free air descending from higher in the troposphere. Surface winds in these belts are also calm on average. In the old days, becalmed sailing ships would often run short of drinking water, causing horses on board to die and be thrown overboard. Hence, sailors called these miserable places the horse latitudes. On land, many of the world’s deserts are near these latitudes.
In mid-latitudes are transient centers of low pressure (mid-latitude cyclones, L) and high pressure (anticyclones, H). Winds around lows converge (come together) and circulate cyclonically — counterclockwise in the N. Hemisphere, and clockwise in the S. Hemisphere. Winds around highs diverge (spread out) and rotate anticyclonically — clockwise in the N. Hemisphere, and counterclockwise in the S. Hemisphere. The cyclones are regions of bad weather (clouds, rain, high humidity, strong winds) and fronts. The anticyclones are regions of good weather (clear skies or fair-weather clouds, no precipitation, dry air, and light winds).
The high- and low-pressure centers move on average from west to east, driven by large-scale winds from the west. Although these westerlies dominate the general circulation at mid-latitudes, the surface winds are quite variable in time and space due to the sum of the westerlies plus the transient circulations around the highs and lows.
Near 60° latitude are belts of low surface pressure called subpolar lows. Along these belts are light to calm winds, upward air motion, clouds, cool temperatures, and precipitation (as snow in winter).
Near each pole is a climatological region of high pressure called a polar high. In these regions are often clear skies, cold dry descending air, light winds, and little snowfall. Between each polar high (at 90°) and the subpolar low (at 60°) is a belt of weak easterly winds, called the polar easterlies.
11.2.2. Upper-troposphere
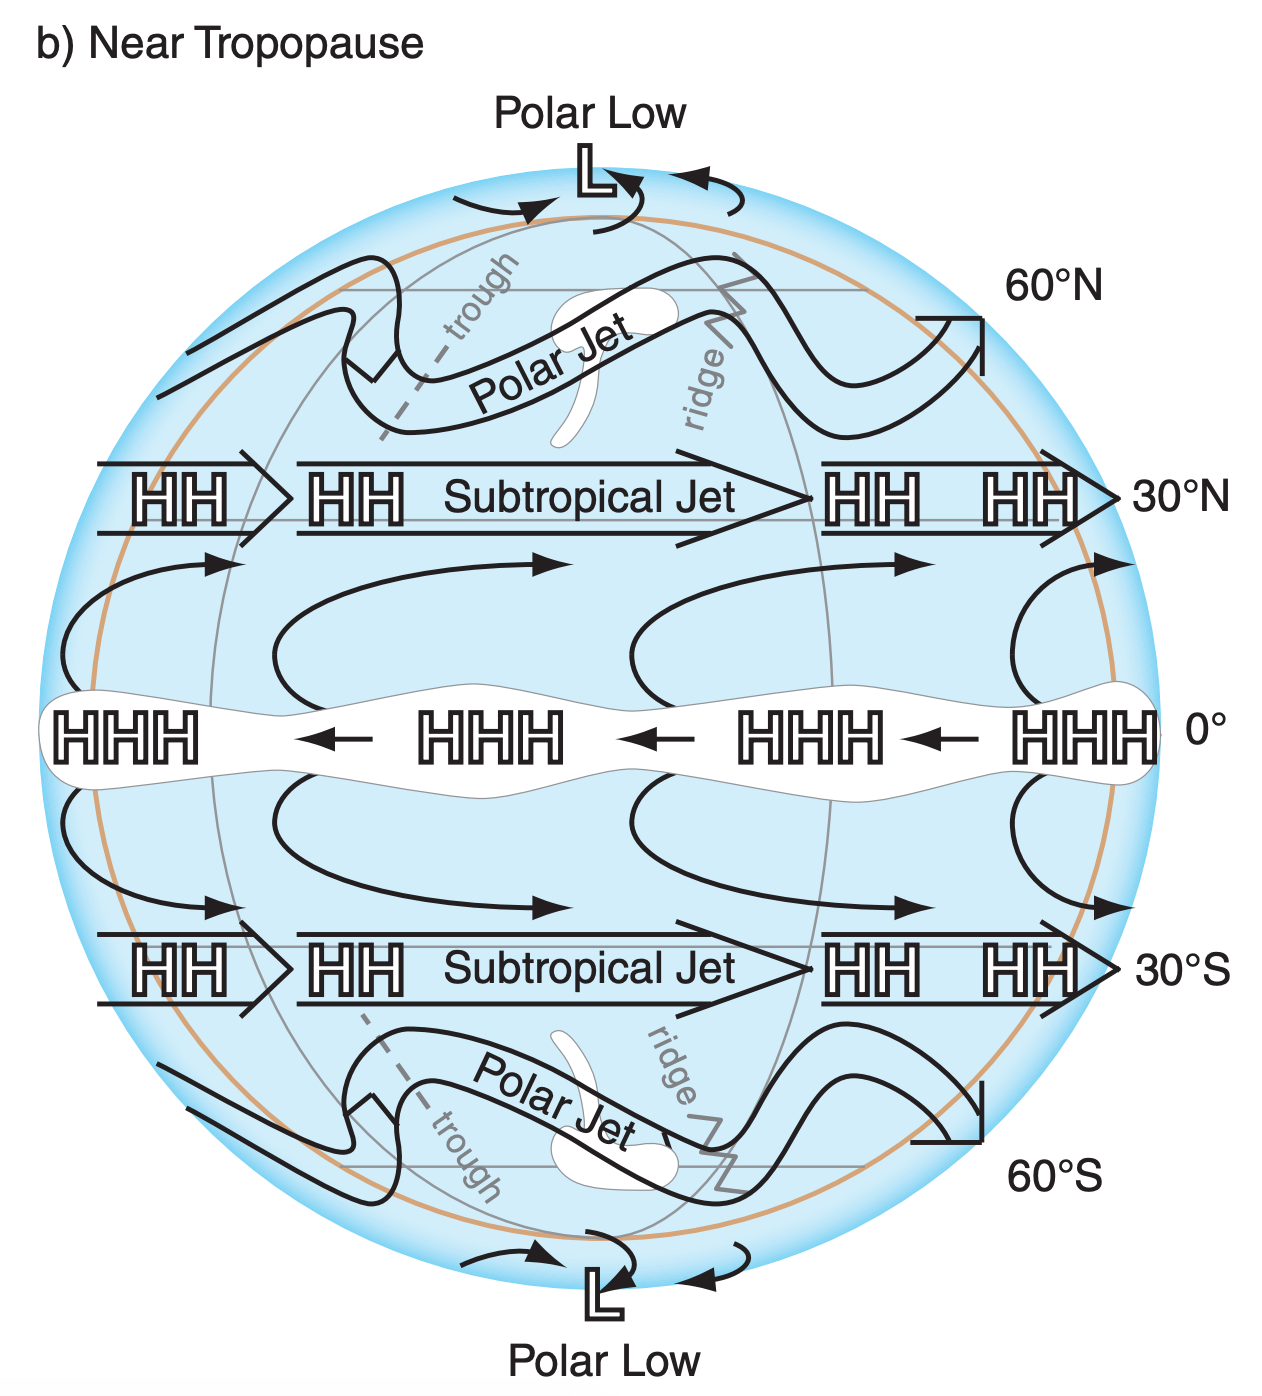
The stratosphere is strongly statically stable, and acts like a lid to the troposphere. Thus, vertical circulations associated with our weather are mostly trapped within the troposphere. These vertical circulations couple the average near-surface winds with the average upper-tropospheric (near the tropopause) winds described here (Fig. 11.3b).
In the tropics is a belt of very strong equatorial high pressure along the tops of the ITCZ thunderstorms. Air in this belt blows from the east, due to easterly inertia from the trade winds being carried upward in the thunderstorm convection. Diverging from this belt are winds that blow toward the north in the N. Hemisphere, and toward the south in the S. Hemisphere. As these winds move away from the equator, they turn to have an increasingly westerly component as they approach 30° latitude.
Near 30° latitude in each hemisphere is a persistent belt of strong westerly winds at the tropopause called the subtropical jet. This jet meanders north and south a bit. Pressure here is very high, but not as high as over the equator.
In mid-latitudes at the tropopause is another belt of strong westerly winds called the polar jet. The centerline of the polar jet meanders north and south, resulting in a wave-like shape called a Rossby wave (or planetary wave), as sketched in Fig. 11.1c. The equatorward portions of the wave are known as low-pressure troughs, and poleward portions are known as high-pressure ridges. These ridges and troughs are very transient, and generally shift from west to east relative to the ground.
Near 60° at the tropopause is a belt of low to medium pressure. At each pole is a low-pressure center near the tropopause, with winds at high latitudes generally blowing from the west causing a cyclonic circulation around the polar low. Thus, contrary to near-surface conditions, the near-tropopause average winds blow from the west at all latitudes (except near the equator).
11.2.3. Vertical Circulations
Vertical circulations of warm rising air in the tropics and descending air in the subtropics are called Hadley cells or Hadley circulations (Fig. 11.4). At the bottom of the Hadley cell are the trade winds. At the top, near the tropopause, are divergent winds. The updraft portion of the Hadley circulation often contains thunderstorms and heavy precipitation at the ITCZ. This vigorous convection in the troposphere causes a high tropopause (15 - 18 km altitude) and a belt of heavy rain in the tropics.
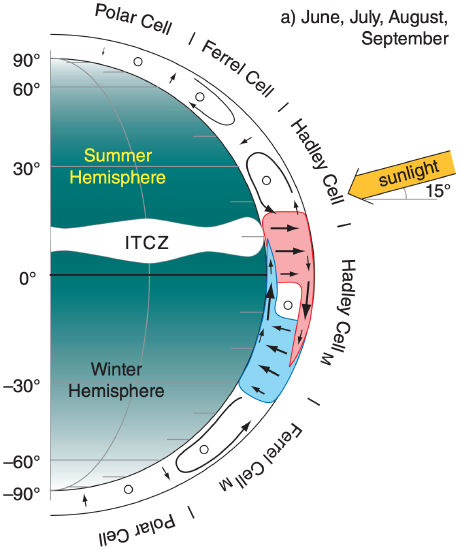
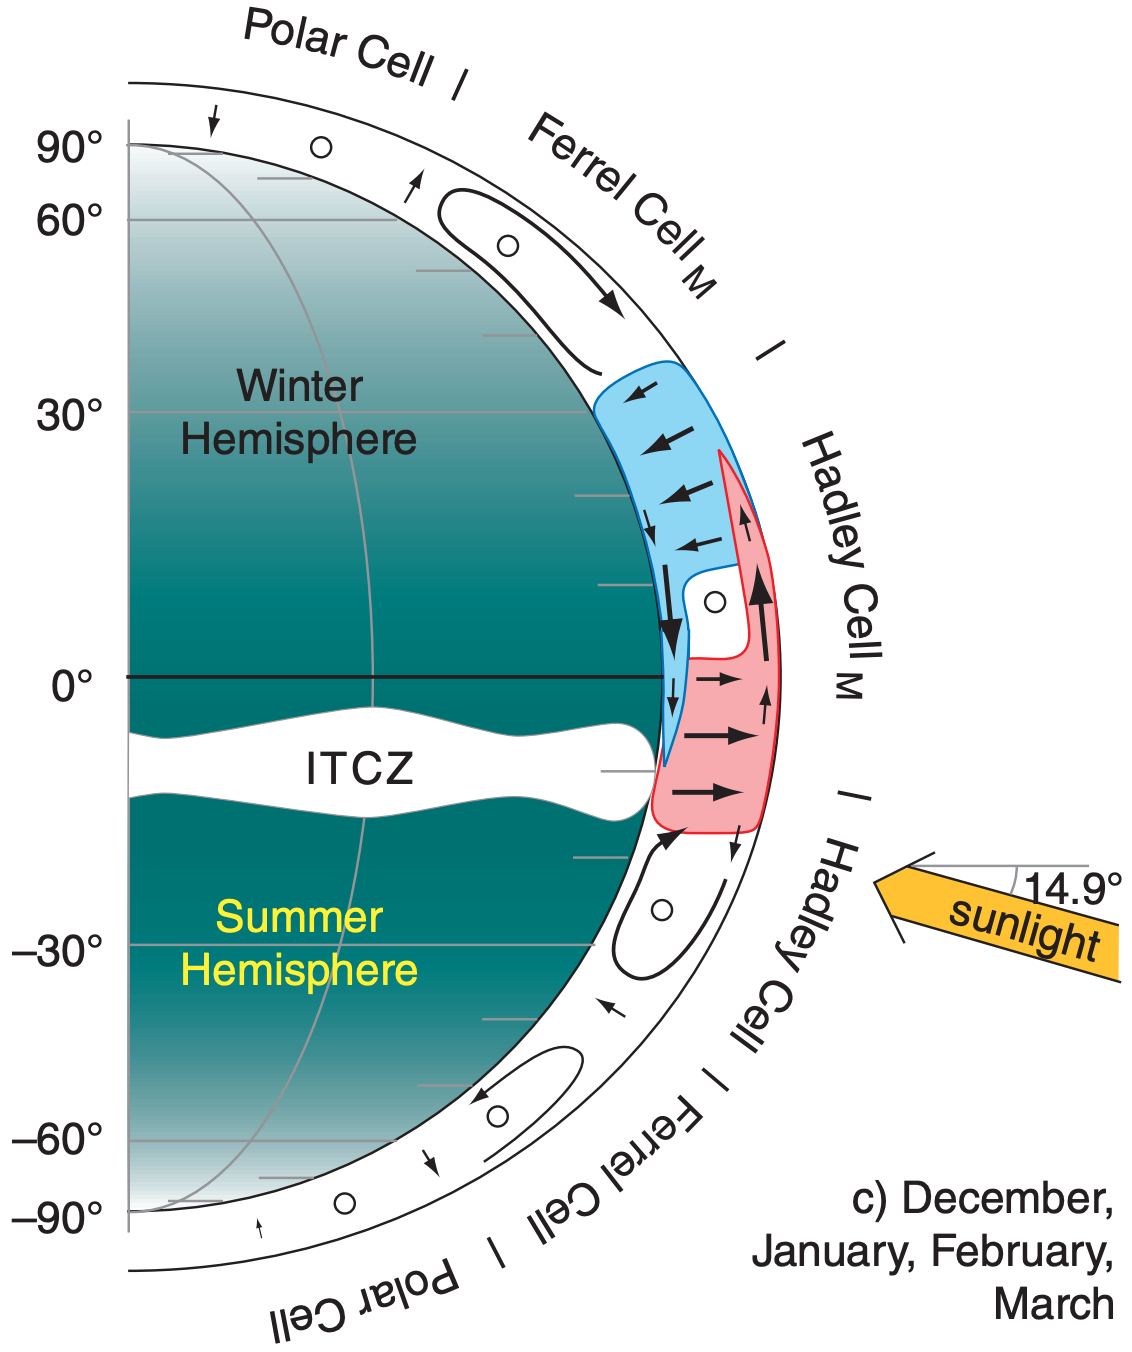
The summer- and winter-hemisphere Hadley cells are strongly asymmetric (Fig. 11.4). The major Hadley circulation (denoted with subscript “M”) crosses the equator, with rising air in the summer hemisphere and descending air in the winter hemisphere. The updraft is often between 0° and 15° latitudes in the summer hemisphere, and has average core vertical velocities of 6 mm s–1. The broader downdraft is often found between 10° and 30° latitudes in the winter hemisphere, with average velocity of about –4 mm s–1 in downdraft centers. Connecting the up- and downdrafts are meridional wind components of 3 m s–1 at the cell top & bottom.
The major Hadley cell changes direction and shifts position between summer and winter. During June-July-August-September, the average solar declination angle is 15°N, and the updraft is in the Northern Hemisphere (Fig. 11.4a). Out of these four months, the most well-defined circulation occurs in August and September. At this time, the ITCZ is centered at about 9°N, but varies with longitude.
During December-January-February-March, the average solar declination angle is 14.9°S, and the major updraft is in the Southern Hemisphere (Fig. 11.4c). Out of these four months, the strongest circulation is during February and March, and the ITCZ is centered at roughly 6°S, but varies with longitude. The major Hadley cell transports significant heat away from the tropics, and also from the summer to the winter hemisphere.
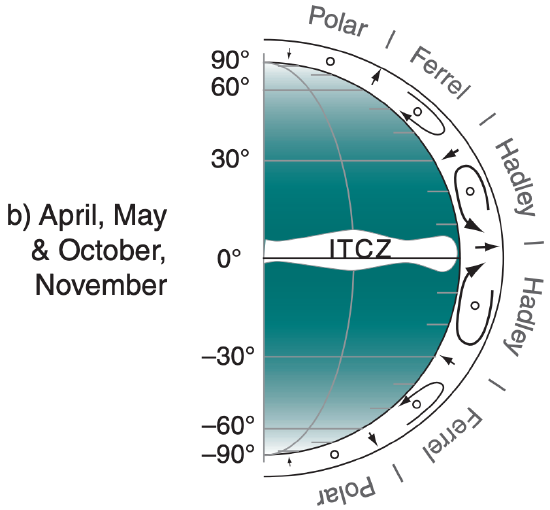
During the transition months (April-May and October-November) between summer and winter, the Hadley circulation has nearly symmetric Hadley cells in both hemispheres (Fig. 11.4b). During this transition, the intensities of the Hadley circulations are weak.
When averaged over the whole year, the strong but reversing major Hadley circulation partially cancels itself, resulting in an annual average circulation that is somewhat weak and looks like Fig. 11.4b. This weak annual average is deceiving, and does not reflect the true movement of heat, moisture, and momentum by the winds. Hence, climate experts prefer to look at months JJA and DJF separately to give seasonal averages.
In the winter hemisphere, one or more jet streams circle the earth at mid-latitudes while meandering north and south as Rossby waves (Fig. 11.1c). When averaged around latitude bands, the net effect is a weak vertical circulation called a Ferrel cell. At high latitudes is a modest polar cell.
In the summer hemisphere, all the circulations are weaker. There are minor Hadley and Ferrel cells (Fig. 11.4). Summer-hemisphere circulations are weaker because the temperature contrast between the tropics and poles are weaker.
11.2.4. Monsoonal Circulations
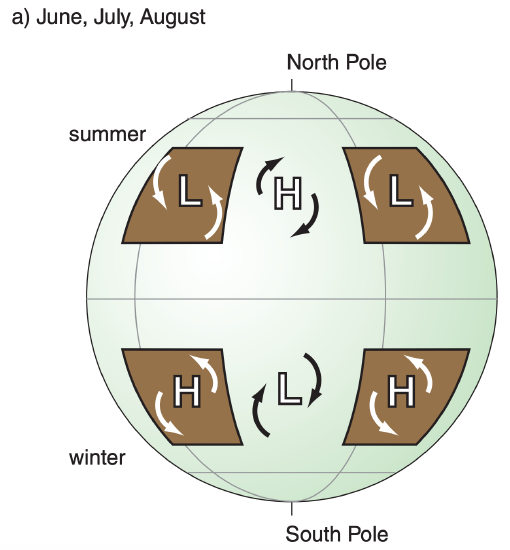
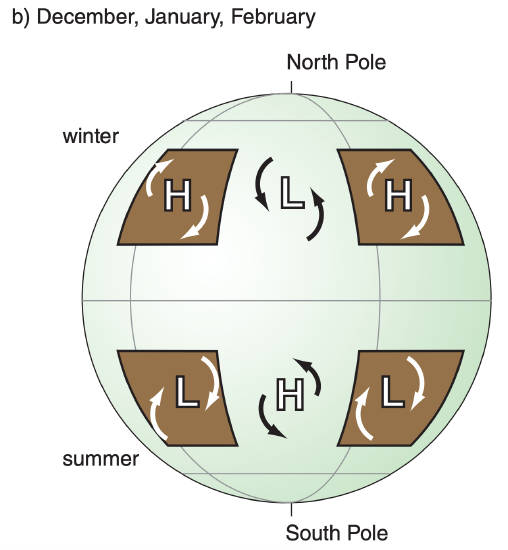
Monsoon circulations are continental-scale circulations driven by continent-ocean temperature contrasts, as sketched in Figs. 11.5. In summer, high-pressure centers (anticyclones) are over the relatively warm oceans, and low-pressure centers (cyclones) are over the hotter continents. In winter, low-pressure centers are over the cool oceans, and high-pressure centers are over the colder continents.
These monsoon circulations represent average conditions over a season. The actual weather on any given day can be variable, and can deviate from these seasonal averages.
Our Earth has a complex arrangement of continents and oceans. As a result, seasonally-varying monsoonal circulations are superimposed on the seasonally-varying planetary-scale circulation to yield a complex and varying global-circulation pattern.
At this point, you have a descriptive understanding of the global circulation. But what drives it?