13.9: Homework Exercises
- Page ID
- 10228

13.9.1. Broaden Knowledge & Comprehension
For all the exercises in this section, collect information from the internet. Don’t forget to cite the web site URLs that you use.
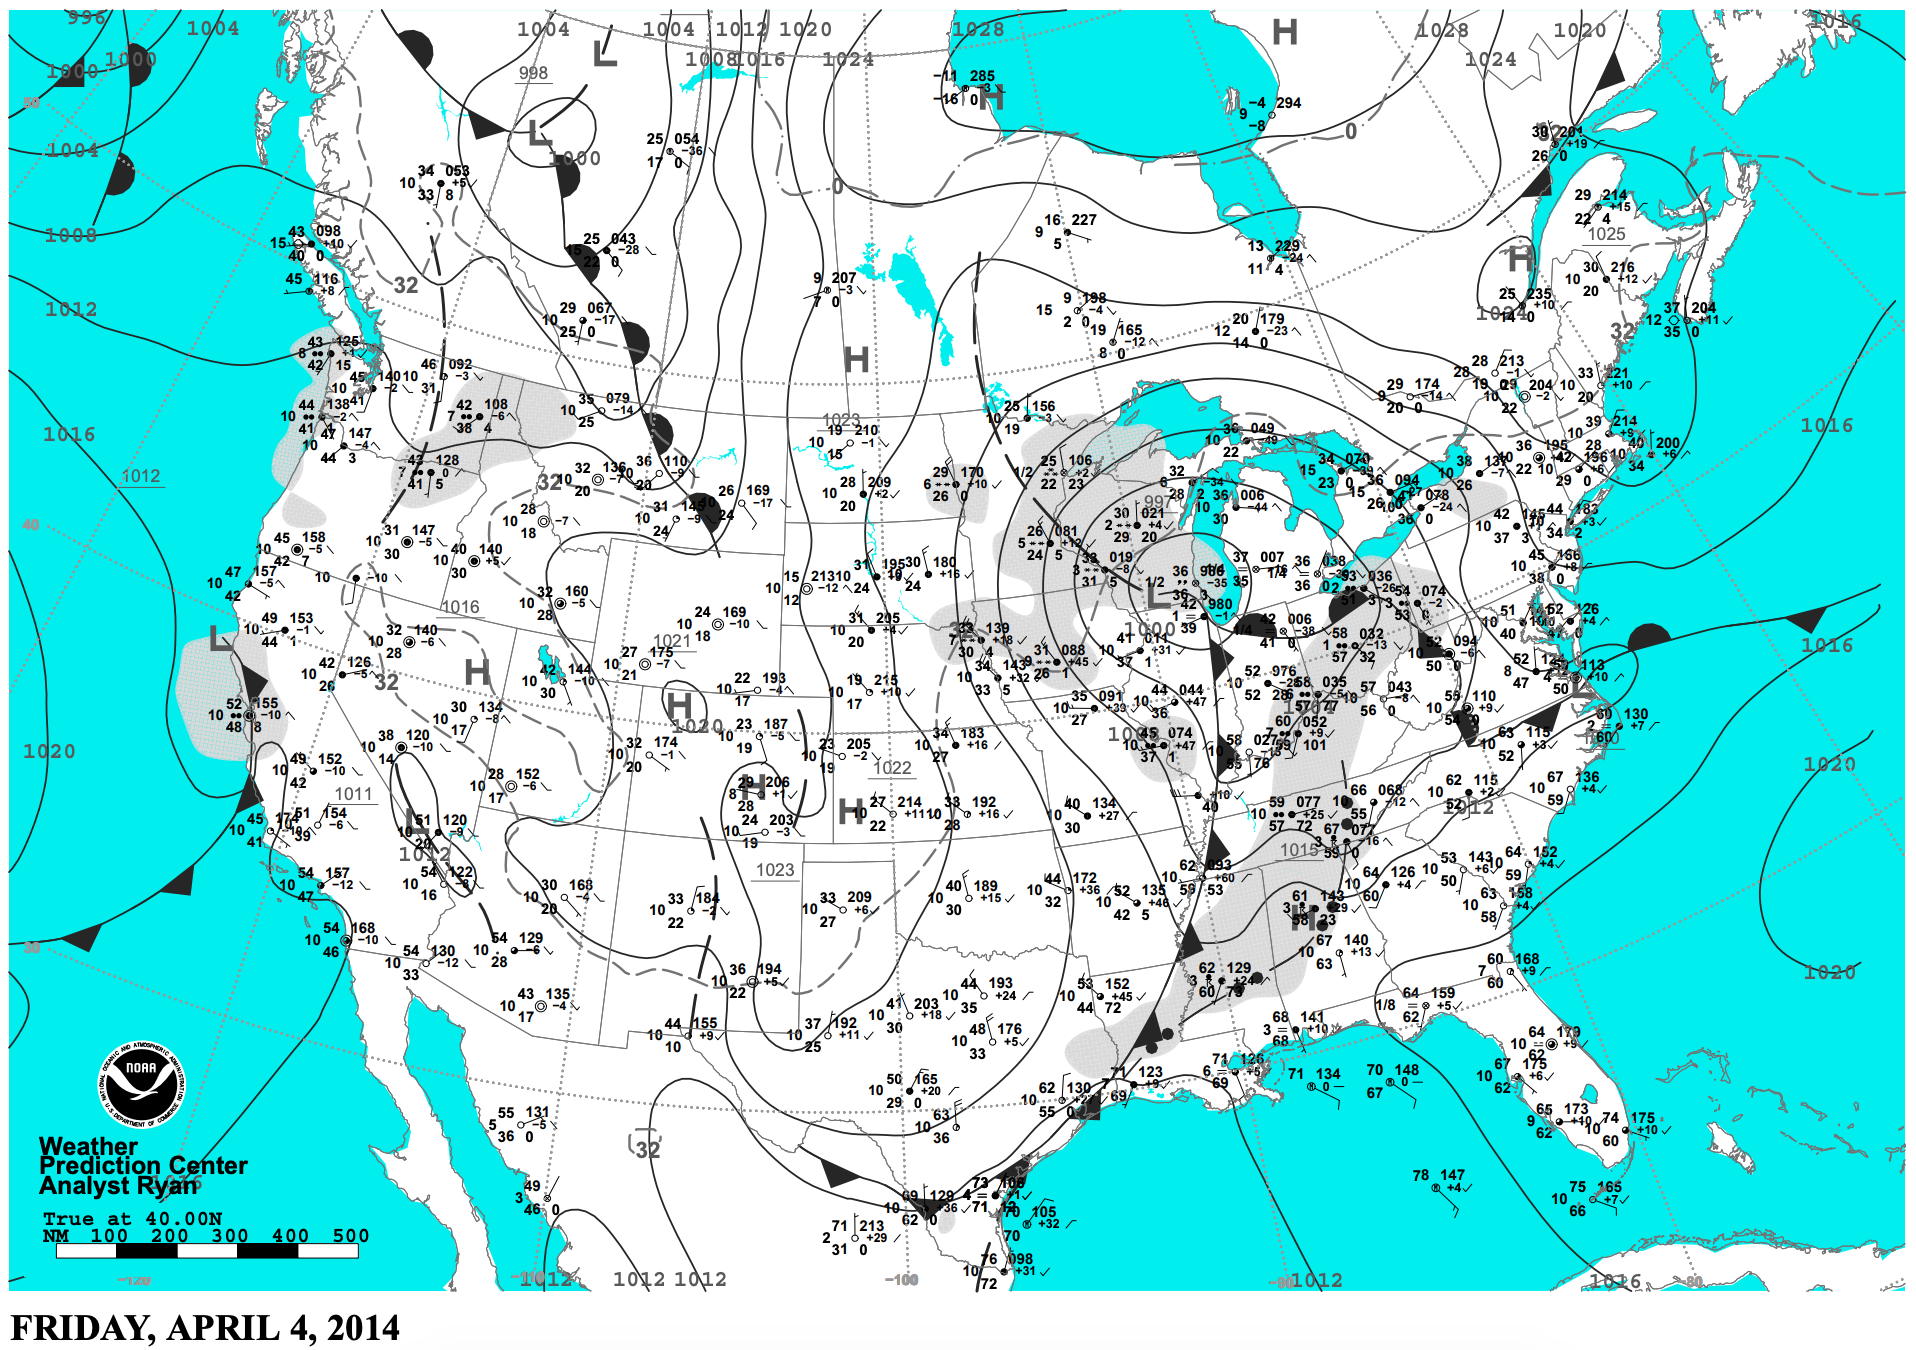
B1. Collect weather maps for a new case-study cyclone assigned by your instructor. Use these maps to explain the processes involved in the evolution of this cyclone.
B2. What are some web sites that provide data on damage, deaths, and travel disruptions due to storms?
B3. Same as exercise B1, but use the maps to create a sketch of the 3-D nature of the storm, and how the storm dynamics affect its evolution.
B4. Find weather maps of common cyclogenesis locations and storm tracks.
B5. Get weather maps that display how a cyclone is affected as it moves over large mountain ranges, such as the North American Coast Range, Rocky Mountains, Cascade Mountains, or other significant range in the world (as assigned by your instructor).
B6. Draw on a map the path of a cyclone center, and encircle regions on that map experiencing bad weather (heavy rains, blizzards, windstorms, etc.).
B7. Get maps showing cyclone bombs, and discuss their life cycle.
B8. Get upper-air weather maps (such as at 30 or 20 kPa) showing wind isotachs or geopotential height contours. Use these maps to identify Rossby wave lengths and amplitudes.
B9. Using the maps from exercise B8, measure the radius-of-curvature of troughs, and combine with wind-speed information to calculate vorticity.
B10. Get geopotential height and temperature maps for the 70 or 85 kPa isobaric surfaces. Use the method of crossing isopleths to identify which point on the map has the largest temperature advection.
B11. Get geopotential height and vorticity maps on the 50 kPa isobaric surface. Identify points on the map that have the largest positive vorticity advection and largest negative vorticity advection. Identify a location that supports cyclogenesis.
B12. Get upper-air maps of vorticity on the 70 kPa isobaric surface, and a map of 100 to 50 kPa thickness. For a location near a cyclone, estimate the thermal wind. Next, identify a point on the map having largest advection of vorticity by that thermal wind. Recall that ascent and cyclogenesis is supported at those max advection locations, as described by the omega equation.
B13. Get an upper-air map that shows contours of the height or pressure of a surface of constant potential temperature (i.e., an isentropic surface). Depending on the potential temperature you pick, indicate which part of the isentropic surface might be in the stratosphere (if any). Given typical wind directions (from other maps or information), indicate if the air is like ascending or descending along the isentropic surface.
B14. Get a map of isotachs for the 20 or 30 kPa isobaric surface. Label the quadrants of relative to the jet-streak axis. Suggest locations where cyclogenesis is favored. At one of those regions, calculate vertical velocity in the mid-troposphere that would be caused by divergence in the jet-streak winds.
B15. Get a map of geopotential height on an isobaric surface of 20 or 30 kPa. Comment on how the packing of heights changes as the jet stream flows in troughs and ridges.
B16. Capture a radar reflectivity image (perhaps a composite from many radars) that show the distribution of dBZ around an extratropical cyclone. Comment on the amount of sea-level pressure tendency due to latent-heating in different parts of the cyclone.
B17. The case-study in this textbook showed weather maps of typical variables and fields often employed by meteorologists. Get and comment on the value of weather maps of other types of fields or variables, as you can acquire from national weather services or weather research centers.
B18. Find a web site that produces maps of Q-vectors or Q-vector divergence. Print this map and a normal surface weather map with fronts, and discuss how you would anticipate the cyclone to evolve based on a Q-vector analysis.
13.9.2. Apply
A1. For latitude 50°N, find the approximate wavelength (km) of upper-atmosphere (Rossby) waves triggered by mountains, given an average wind speed (m s–1) of:
| a. 20 | b. 25 | c. 30 | d. 35 | e. 40 | f. 45 | g. 50 |
| h. 55 | i. 60 | j. 65 | k. 70 | l. 75 | m. 80 | n. 85 |
A2. Find the rate of increase of the β parameter (i.e., the rate of change of Coriolis parameter with distance north) in units of m–1s–1 at the following latitude (°N):
| a. 40 | b. 45 | c. 50 | d. 55 | e. 60 | f. 65 | g. 70 |
| h. 80 | i. 35 | j. 30 | k. 25 | l. 20 | m. 15 | n. 10 |
A3. Given a tropospheric depth of 12 km at latitude 45°N, what is the meridional (north-south) amplitude (km) of upper-atmosphere (Rossby) waves triggered by mountains, given an average mountainrange height (km) of:
| a. 0.4 | b. 0.6 | c. 0.8 | d. 1.0 | e. 1.2 | f. 1.4 | g. 1.6 |
| h. 1.8 | i. 2.0 | j. 2.2 | k. 2.4 | l. 2.6 | m. 2.8 | n. 3.0 |
A4. How good is the approximation of eq. (13.4) to eq. (13.3) at the following latitude (°N)?
| a. 40 | b. 45 | c. 50 | d. 55 | e. 60 | f. 65 | g. 70 |
| h. 80 | i. 35 | j. 30 | k. 25 | l. 20 | m. 15 | n. 10 |
A5. For a troposphere of depth 12 km at latitude 43°N, find the potential vorticity in units of m–1s–1, given the following:
| [wind speed (m s–1) | radius of curvature (km)] |
| a. 50 | 500 |
| b. 50 | 1000 |
| c. 50 | 1500 |
| d. 50 | 2000 |
| e. 50 | –500 |
| f. 50 | – 1000 |
| g. 50 | –1500 |
| h. 50 | -2000 |
| i. 75 | 500 |
| j. 75 | 1000 |
| k. 75 | 1500 |
| l. 75 | 2000 |
| m. 75 | –1000 |
| n. 75 | – 2000 |
A6. For air at 55°N with initially no curvature, find the potential vorticity in units of m–1s–1 for a troposphere of depth (km):
| a. 7.0 | b. 7.5 | c. 8.0 | d. 8.5 | e. 9.0 | f. 9.5 | g. 10.0 |
| h. 10.5 | i. 11 | j. 11.5 | k. 12 | l. 12.5 | m. 13 | n. 13.5 |
A7. When air at latitude 60°N flows over a mountain range of height 2 km within a troposphere of depth 12 km, find the radius of curvature (km) at location “C” in Fig. 13.20 given an average wind speed (m s–1) of:
| a. 20 | b. 25 | c. 30 | d. 35 | e. 40 | f. 45 | g. 50 |
| h. 55 | i. 60 | j. 65 | k. 70 | l. 75 | m. 80 | n. 85 |
A8. Regarding equatorward propagation of cyclones on the eastern slope of mountains, if a cyclone of radius 1000 km and potential vorticity of 3x10⁻⁸ m–1s–1 is over a slope as given below (∆z/∆x), find the change in relative vorticity (s–1) between the north and south sides of the cyclone.
| a. 1/500 | b. 1/750 | c. 1/1000 | d. 1/1250 |
| e. 1/1500 | f. 1/1750 | g. 1/2000 | h. 1/2250 |
| i. 1/2500 | j. 1/2750 | k. 1/3000 | l. 1/3250 |
A9. Recall from the Atmospheric Forces and Winds chapter that incompressible mass continuity implies that ∆W/∆z = –D, where D is horizontal divergence. Find the Coriolis contribution to the stretching term (s–2) in the relative-vorticity tendency equation, given the average 85 kPa divergence in Fig. 13.26 for the following USA state:
| a. AZ | b. WI | c. KS | d. KY | e. VA | f. CO | g. KA |
| h. AB | i. MD | j. ID | k. central TX | l. NY | m. IN |
A10. Find the spin-up rate (s–2) of quasi-geostrophic vorticity, assuming that the following is the only non-zero characteristic:
a. Geostrophic wind of 30 m s–1 from north within region where geostrophic vorticity increases toward the north by 6x10⁻⁵ s–1 over 500 km distance.
b. Geostrophic wind of 50 m s–1 from west within region where geostrophic vorticity increases toward the east by 8x10⁻⁵ s–1 over 1000 km distance.
c. A location at 40°N with geostrophic wind from the north of 25 m s–1.
d. A location at 50°N with geostrophic wind from the south of 45 m s–1.
e. A location at 35°N with vertical velocity increasing 0.5 m s–1 with each 1 km increase in height.
f. A location at 55°N with vertical velocity decreasing 0.2 m s–1 with each 2 km increase in height.
A11. Find the value of geostrophic vorticity (s–1), given the following changes of (Ug, Vg) in m s–1 with 500 km distance toward the (north, east):
| a. (0, 5) | b. (0, 10) | c. (0, –8) | d. (0, –20) |
| e. (7, 0) | f. (15, 0) | g. (–12, 0) | h. (-25, 0) |
| i. (5, 10) | j. (20, 10) | k. (–10, 15) | l. (–15, –12) |
A12. Find the value of geostrophic vorticity (s–1), given a geostrophic wind speed of 35 m s–1 with the following radius of curvature (km). Assume the air rotates similar to a solid-body.
| a. 450 | b. –580 | c. 690 | d. –750 | e. 825 | f. –988 | g. 1300 |
| h. –1400 | i. 2430 | j. –2643 | k. 2810 | l. –2900 | m. 3014 | n. –3333 |
A13. What is the value of omega (Pa s–1) following a vertically-moving air parcel, if during 1 minute its pressure change (kPa) is:
| a. –2 | b. –4 | c. –6 | d. –8 | e. –10 | f. –12 | g. –14 |
| h. –16 | i. –18 | j. –20 | k. 0.00005 | l. 0.0004 | m. 0.003 | n. 0.02 |
A14. At an altitude where the ambient pressure is 85 kPa, convert the following vertical velocities (m s–1) into omega (Pa s–1):
| a. 2 | b. 5 | c. 10 | d. 20 | e. 30 | f. 40 | g. 50 |
| h. –0.2 | i. –0.5 | j. –1.0 | k. –3 | l. –5 | m. – 0.03 |
A15. Using Fig. 13.15, find the most extreme value horizontal divergence (10–5 s–1) at 20 kPa over the following USA state:
| a. MI | b. WI | c. IL | d. IN | e. TN | f. GA |
| g. MS | h. AB | i. KY | j. PA | k. NY | l. SC |
A16. Find the vertical velocity (m s–1) at altitude 9 km in an 11 km thick troposphere, if the divergence (10–5 s–1) given below occurs within a 2 km thick layer within the top of the troposphere.
| a. 0.2 | b. 1 | c. 1.5 | d. 2 | e. 3 | f. 4 | g. 5 |
| h. 6 | i. –0.3 | j.–0.7 | k. –1.8 | l. –2.2 | m. –3.5 | n. –5 |
A17. Jet-stream inflow is 30 m s–1 in a 4 km thick layer near the top of the troposphere. Jet-stream outflow (m s–1) given below occurs 800 km downwind within the same layer. Find the vertical velocity (m s–1) at the bottom of that layer
| a. 35 | b. 40 | c. 45 | d. 50 | e. 55 | f. 60 | g. 65 |
| h. 70 | i. 30 | j. 25 | k. 20 | l. 15 | m. 10 | n. 5 |
A18. Find the diagonal distance (km) from trough to crest in a jet stream for a wave of 750 km amplitude with wavelength (km) of:
| a. 1000 | b. 1300 | c. 1600 | d. 2000 | e. 2200 | f. 2500 | g. 2700 |
| h. 3000 | i. 3100 | j. 3300 | k. 3800 | l. 4100 | m. 4200 | n. 4500 |
A19. Given the data from the previous exercise, find the radius (km) of curvature near the crests of a sinusoidal wave in the jet stream.
A20. Find the gradient-wind speed difference (m s–1) between the jet-stream speed moving through the anticyclonic crest of a Rossby wave in the N. Hemisphere and the jet-stream speed moving through the trough. Use data from the previous 2 exercises, and assume a geostrophic wind speed of 75 m s–1 for a wave centered on latitude 40°N.
A21. Given the data from the previous 3 exercises. Assuming that the gradient-wind speed difference calculated in the previous exercise is valid over a layer between altitudes 8 km and 12 km, where the tropopause is at 12 km, find the vertical velocity (m s–1) at 8 km altitude
A22. Suppose that a west wind enters a region at the first speed (m s–1) given below, and leaves 500 km downwind at the second speed (m s–1). Find the north-south component of ageostrophic wind (m s–1) in this region. Location is 55°N.
| a. (40, 50) | b. (30, 60) | c. (80, 40) | d. (70, 50) |
| e. (40, 80) | f. (60, 30) | g. (50, 40) | h. (70, 30) |
| i. (30, 80) | j. (40, 70) | k. (30, 70) | l. (60, 20) |
A23. Use the ageostrophic right-hand rule to find the ageostrophic wind direction for the data of the previous problem.
A24. Using the data from A22, find the updraft speed (m s–1) into a 4 km thick layer at the top of the troposphere, assuming the half-width of the jet streak is 200 km.
A25. Suppose that the thickness of the 100 - 50 kPa layer is 5.5 km and the Coriolis parameter is 10–4 s–1. A 20 m s–1 thermal wind from the west blows across a domain of x dimension given below in km. Across that domain in the x-direction is a decrease of cyclonic relative vorticity of 3x10⁻⁴ s–1. What is the value of mid-tropospheric ascent velocity (m s–1), based on the omega equation?
| a. 200 | b. 300 | c. 400 | d. 500 | e. 600 | f. 700 | g. 800 |
| h. 900 | i. 1000 | j. 1100 | k. 1200 | l. 1300 | m. 1400 | n. 1400 |
A26. On the 70 kPa isobaric surface, ∆Ug/∆x = (4 m s–1)/(500 km) and ∆T/∆x = ___°C/(500 km), where the temperature change is given below. All other gradients are zero. Find the Q-vector components Qx, Qy, and the magnitude and direction of Q.
| a. 1 | b. 1.5 | c. 2 | d. 2.5 | e. 3 | f. 3.5 | g. 4 |
| h. 4.5 | i. 5 | j. 5.5 | k. 6 | l. 6.5 | m. 7 | n. 7.5 |
A27. Find Q-vector magnitude on the 85 kPa isobaric surface if the magnitude of the horizontal temperature gradient is 5°C/200 km, and the magnitude of the geostrophic-wind difference-vector component (m s–1) along an isotherm is __ /200 km, where __ is:
| a. 1 | b. 1.5 | c. 2 | d. 2.5 | e. 3 | f. 3.5 | g. 4 |
| h. 4.5 | i. 5 | j. 5.5 | k. 6 | l. 6.5 | m. 7 | n. 7.5 |
A28. Find the mass of air over 1 m2 of the Earth’s surface if the surface pressure (kPa) is:
| a. 103 | b. 102 | c. 101 | d. 99 | e. 98 | f. 97 | g. 96 |
| h. 95 | i. 93 | j. 90 | k. 85 | l. 80 | m. 75 | n. 708 |
A29. Assume the Earth’s surface is at sea level. Find the vertical velocity (m s–1) at height 3 km above ground if the change of surface pressure (kPa) during 1 hour is:
| a. –0.5 | b. –0.4 | c. –0.3 | d. –0.2 | e. –0.1 | f. 0.1 | |
| g. 0.2 | h. 0.4 | i. 0.6 | j. 0.8 | k. 1.0 | l. 1.2 | m. 1.4 |
A30. Given the rainfall (mm) accumulated over a day. If the condensation that caused this precipitation occurred within a cloud layer of thickness 6 km, then find the virtual-temperature warming rate (°C day–1) of that layer due to latent heat release.
| a. 1 | b. 50 | c. 2 | d. 45 | e. 4 | f. 40 | g. 5 |
| h. 35 | i. 7 | j. 30 | k. 10 | l. 25 | m. 15 | n. 20 |
A31. For the data in the previous exercise, find the rate of decrease of surface pressure (kPa) per hour, assuming an average air temperature of 5°C.
13.9.3. Evaluate & Analyze
E1. Compare the similarities and differences between cyclone structure in the Northern and Southern Hemisphere?
E2. In the Cyclogenesis & Cyclolysis section is a list of conditions that favor rapid cyclogenesis. For any 3 of those bullets, explain why they are valid based on the dynamical processes that were described in the last half of the chapter.
E3. For a cyclone bomb, are the winds associated with that cyclone in geostrophic equilibrium? Hints: consider the rate of air-parcel acceleration, based on Newton’s 2nd Law. Namely, can winds accelerate fast enough to keep up with the rapidly increasing pressure gradient?
E4. Make a photocopy of Fig. 13.3. For each one of the figure panels on this copy, infer the centerline position of the jet stream and draw it on those diagrams.
E5. Create a 6-panel figure similar to Fig. 13.3, but for cyclone evolution in the Southern Hemisphere.
E6. Justify the comment that cyclone evolution obeys Le Chatelier’s Principle.
E7. Refer back to the figure in the General Circulation chapter that sketches the position of mountain ranges in the world. Use that information to hypothesize favored locations for lee cyclogenesis in the world, and test your hypothesis against the data in Fig. 13.5.
E8. Why are there no extratropical cyclone tracks from east to west in Fig. 13.5?
E9. Contrast the climatology of cyclone formation and tracks in the Northern vs. Southern Hemisphere (using the info in Fig. 13.5), and explain why there is a difference in behaviors based on the dynamical principles in the last half of the chapter.
E10. Justify why the tank illustration in Fig. 13.6 is a good analogy to atmospheric flow between cyclones and anticyclones.
E11. Fig. 13.7 shows the axis of low pressure tilting westward with increasing height. Explain why this tilt is expected. (Hints: On which side of the cyclone do you expect the warm air and the cold air? The hypsometric equation in Chapter 1 tells us how fast pressure decreases with height in air of different temperatures.)
E12. Redraw Fig. 13.7 a & b for the Southern Hemisphere, by extending your knowledge of how cyclones work in the Northern Hemisphere.
E13. Regarding stacking and tilting of low pressure with altitude, make a photocopy of Fig. 13.3, and on this copy for Figs. b and e draw the likely position of the trough axis near the top of the troposphere. Justify your hypothesis.
E14. Fig. 13.8 shows a warm-air conveyor bring air from the tropics. Assuming this air has high humidity, explain how this conveyor helps to strengthen the cyclone. Using dynamical principles from the last half of the chapter to support your explanation.
E15. Fig. 13.10a has coarse temporal resolution when it shows the evolution of the case-study cyclone. Based on your knowledge of cyclone evolution, draw two weather maps similar to Fig. 13.10a, but for 12 UTC 3 Apr 2014 and 00 UTC 4 Apr 2014.
E16. Speculate on why the hail reports in Fig. 13.9 are mostly in different regions than the wind-damage reports.
E17. From the set of case-study maps in Figs. 13.9 through 13.19, if you had to pick 3 maps to give you the best 5-D mental picture of the cyclones, which 3 would you pick? Justify your answer.
E18. Of the following isosurfaces (height, pressure, thickness, and potential temperature), which one seems the most peculiar (unusual, illogical) to you?
What questions would you want to ask to help you learn more about that one isosurface?
E19. Starting with a photocopy of the 4 height charts in the left column of Figs. 13.13, use a different color pen/pencil for each isobaric surface, and trace all the height contours onto the same chart. Analyze the tilt with height of the axis of low pressure, and explain why such tilt does or does not agree with the state of cyclone evolution at that time.
E20. Compare and contrast the 85 kPa temperature map of Fig. 13.14 with the thickness map of Fig. 13.16 for the case-study storm. Why or why not would you expect them to be similar?
E21. Compare the wind vectors of Fig. 13.13 with the heights in Fig. 13.13. Use your understanding of wind dynamics to explain the relationship between the two maps.
E22. In the vertical cross section of Fig. 13.19a, why are the isentropes packed more closely together in the stratosphere than in the troposphere? Also, why is the tropopause higher on the right side of that figure? [Hints: Consider the standard atmosphere temperature profile from Chapter 1. Consider the General Circulation chapter.]
E23. Describe the relationship between the surface values of isentropes in Fig. 13.19a and the temperature values along cross-section A - A’ in Fig. 13.14 (bottom left).
E24. In Fig. 13.20, how would lee cyclogenesis be affected if the tropopause perfectly following the terrain elevation? Explain.
E25. In Fig. 13.20, speculate on why the particular set of Rossby waves discussed in that section are known as “stationary” waves.
E26. Can “stationary” Rossby waves such as in Fig. 13.20 occur near the equator? If so, what are their characteristics?
E27. Given zonal flow of the whole troposphere (12 km depth) hitting a semi-infinite plateau at 32°N latitude. Use math to explain the flow behavior over the plateau, assuming a 2 km plateau height above sea level. Assume the tropopause height doesn’t change. Would the triggering of cyclones, and the wavelength of planetary waves be different? Why? Can you relate your answer to weather over the Tibetan Plateau?
E28. Considering the terrain height changes, would anticyclones be triggered upwind of mountain ranges, analogous to lee-side cyclogenesis? Justify your answer, and discuss how you can confirm if this happens in the real atmosphere.
E29. Suppose that all of North America is nearly at sea level, except for a 2 km deep valley that is 500 km wide, running north-south across the center of North America (assume the valley is not filled with water). Explain what Rossby waves would be triggered, and the associated weather downwind.
E30. Summer tropopause height is higher, and jetstream winds are slower, than in winter. Explain the seasonal differences you would expect in terrain-triggered Rossby waves, if any.
E31. If extratropical cyclones tend to propagate equatorward on the lee side of mountain ranges, is there any geographic feature that would cause these storms to propagate poleward? Justify.
E32. Fig. 13.22 highlights 3 important attributes of cyclones that are discussed in greater detail in the last half of the chapter. Speculate on why we study these attributes separately, even though the caption to that figure discusses how all 3 attributes are related.
E33. For cyclogenesis we focused on three attributes: vertical velocity, vorticity, and pressure-tendency at sea level. What attributes would you want to focus on to anticipate cyclolysis? Explain.
E34. Three vorticity tilting terms are given in eq. (13.9), but just the first tilting term was illustrated in Fig. 13.23d. Draw figures for the other two terms.
E35. Except for the last term in the full vorticity tendency equation, all the other terms can evaluate to be positive or negative (i.e., gain or loss of relative vorticity). What is it about the mathematics of the turbulent drag term in that equation that always make it a loss of relative vorticity?
E36. Based on what you learned from Fig. 13.24, what tips would you teach to others to help them easily find regions of PVA and NVA.
E37. Make a diagram that shows vertical advection of vorticity, similar to the drawing in Fig. 13.23a.
E38. If drag were the only non-zero term on the right side of eq. (13.9), then how would vorticity change with time if initially the flow had some amount of positive vorticity?
E39. Devise a tilting term for vertical vorticity that is tilted into horizontal vorticity.
E40. For what situations might the quasi-geostrophic approximation be useful, and for what situations would it be inappropriate?
E41. The quasi-geostrophic vorticity equation includes a term related to vorticity advection by the geostrophic wind. The omega equation has a term related to vorticity advection by the thermal wind. Contrast these terms, and how they provide information about cyclogenesis.
E42. Employ Figs. 13.9 - 13.19 to estimate as many vorticity-tendency terms as reasonably possible for that case study event, on the 50 kPa isobaric surface at the location of the “X”.
E43. Create a “toy model” similar to Fig. 13.27, but focus on the vorticity effects east of the ridge axis. Use this to help explain anticyclogenesis.
E44. If nothing else changes except latitude, explain the relationship between Rossby-wave radius-ofcurvature and latitude.
E45. Why does jet-stream curvature contribute to surface cyclogenesis east of the jet trough axis rather than west of the trough axis?
E46. In the Forces and Winds chapter you saw that the horizontal pressure gradient and wind speeds are weak. Does this physical constraint influence the possible strength of the jet-stream curvature effect for cyclogenesis?
E47. At the “X” in Fig. 13.30, use the information plotted on that map to estimate how the jet-stream curvature and jet-streak processes influence changes to sea-level pressure and ascent speed in the middle of the troposphere.
E48. Make a photo copy of Fig. 13.18. Using the jetstream curvature and jet-streak information that you can estimate from the height contours, draw on your copy the locations in the Northern Hemisphere where cyclogenesis is favored.
E49. For the jet-streak illustration of Fig. 13.32b, explain why two of the quadrants have weaker convergence or divergence than the other two quadrants.
E50. Consider a steady, straight jet stream from west to east. Instead of a jet streak of higher wind speed embedded in the jet stream, suppose the jet streak has lower wind speed embedded in the jet stream. For the right and left entrance and exit regions to this “slow” jet streak, describe which ones would support cyclogenesis at the surface.
E51. Does the “Ageostrophic right-hand rule” work in the Southern Hemisphere too? Justify your answer based on dynamical principles.
E52. Eq. (13.25) was for a west wind, and eq. (13.26) was for a south wind. What method would you use to estimate ageostrophic wind if the wind was from the southwest?
E53. Fig. 13.34 suggests low-altitude convergence of air toward cyclones (lows), rising motion, and highaltitude divergence. Is this sketch supported by the case-study data from Figs. 13.15, 13.25, and 13.26?
E54. The green arrows showing near-surface winds are plotted in Fig. 13.34 as a component of the secondary circulation. What drives these near-surface winds? (Hint: Recall that winds are driven by forces, according to Newton.)
E55. a. Use Figs. 12.12 from the Fronts & Airmasses chapter to find the location where horizontal temperature advection is greatest near a warm front. b. Similar questions but using Fig. 12.11 for cold fronts. Hint: Use the technique shown in the INFO box for max advection in Chapter 13.
E56. Discuss how Fig. 13.37 relates to the omega equation, and how the figure and equation can be used to locate regions that favor cyclogenesis.
E57. Create a new form for the omega equation, based on:
a. the change of geostrophic wind with height;
b. the temperature change in the horizontal. Hint: The horizontal-temperature gradient is related to the geostrophic-wind vertical gradient by the thermal-wind relationship.
E58. What steps and assumptions must you make to change eq. (13.28 into eq. (13.29)?
E59. Would the omega equation give any vertical motion for a situation having zero temperature gradient in the horizontal (i.e., zero baroclinicity)? Why?
E60. What role does inertia play in the “geostrophic paradox”?
E61. Suppose that the 85 kPa geostrophic wind vectors are parallel to the height contours in Fig. 13.13 for the case-study storm. Use that information along with the 85 kPa isotherms in Fig. 13.14 to estimate the direction of the Q-vectors at the center of the following USA state:
| a. IL | b. IA | c. MO | d. KS | e. AR |
E62. Use the Q-vector approach to forecast where cyclogenesis might occur in the Pacific Northwest USA (in the upper left quadrant of Figs. 13.40 and 13.41).
E63. In Fig. 13.43 we showed have the vertical speeds of the “leaf” in the air column could be a surrogate for changes in mass and surface pressure. Discuss the pros and cons of that approach.
E64. If rainfall rate (RR) affects surface pressure, and weather-radar echo intensity (dBZ) can be used to estimate rainfall rate, then devise an equation for surface-pressure change as a function of dBZ.
E65. Considering surface-pressure tendency, what cyclogenesis information can be gained from Doppler velocities measured by weather radar? State the limitations of such an approach.
E66. Are there situations for which cyclolysis (quantified by sea-level pressure tendency) might be caused by latent heating. Justify your arguments.
E67. In Fig. 13.47, describe the dynamics that makes the time of maximum convergence in the boundary layer occur after the time of maximum divergence in the jet stream, during cyclone evolution.
E68. Suppose that the temperature wave in Fig. 13.49 was a quarter of a wavelength east of the height wave. Would the flow differ from that sketched in Fig. 13.50? Speculate on how likely it is that the temperature wave is shifted this way.
E69. Do you think that anticyclones could self develop? Explain what processes could make this happen.
E70. Explain why the Q-vector analysis of Fig. 13.51 indicates the propagation of cyclones is toward the east. Also explain why this relates to self-propagation rather than relating to cyclogenesis driven by the jet-stream flow.
E71. Use Fig. 13.52 to explain why fronts are associated with cyclones and not anticyclones. The same figure can be used to explain why airmasses are associated with anticyclones. Discuss.
E72. If global baroclinicity is absent (e.g., no airtemperature gradient between the equator and the poles), could there be cyclogenesis? Why?
E73. Explain how the up- and down-couplet of air motion in Fig. 13.53c (as diagnosed using Q-vectors), works in a way to strengthen and propagate the cold front.
E74. Use a Q-vector analysis to speculate on the dynamics needed to cause warm fronts to strengthen and propagate.
E75. Synthesize a coherent description of the dynamics of the case-study cyclone, based on information from the weather maps that help you estimate ascent, spin-up, and sea-level pressure tendency.
E76. Compare and contrast the Pacific cyclones of Fig. 13.54 with the case-study cyclone of Figs. 13.13 - 13.15.
13.9.4. Synthesize
S1. Consider Fig. 13.6. What if frictional drag is zero at the bottom of the atmosphere (in the boundary layer). Describe differences in the resulting climate and weather.
S2. What if the case-study cyclone of Figs. 13.9 - 13.19 occurred in February rather than April, what broad aspects of the storm data would change, if at all?
S3. What if there were no mountain ranges oriented south-north in North America. Describe differences in the resulting climate and weather.
S4. What if all south-north mountain ranges disappeared in North America, and were replaced by one west-east mountain range. Describe differences in the resulting climate and weather.
S5. Suppose western North America was cold, and eastern North America was warm. Describe the orientation of baroclinicity, the jet stream, and differences in resulting climate and weather relative to our actual climate and weather.
S6. Describe changes to Rossby waves and cyclogenesis for an Earth that rotates twice as fast as the real Earth.
S7. How would you numerically solve (iterate) the quasi-geostrophic omega and vorticity equations to step forward in time to forecast those variables.
Next, describe how you could use those forecasts to estimate the corresponding temperature and wind. Finally, describe the pros and cons of using these quasi-geostrophic equations instead of using the forecast equations for momentum, heat, water, continuity, and the ideal gas law (as is done in modern numerical weather prediction).
S8. Accelerations and direction changes of the jet stream create regions of horizontal convergence and divergence that support cyclogenesis and anticyclogenesis. What if this happened on a planet where the tropospheric and stratospheric static stability were nearly the same. Describe the resulting differences of climate and weather on that planet compared to Earth.
S9. Describe changes in climate and weather that might be expected of stratospheric static stability extended all the way to the Earth’s surface.
S10. Describe possible changes to climate and weather if there were no mid-latitude cyclones.
S11. Suppose the sun turned off, but radioactive decay of minerals in the solid earth caused sufficient heat to keep the Earth-system temperature the same as now. Describe resulting changes to the jet stream, Rossby waves, and weather.
S12. Re-read this chapter and extract all the forecasting tips to create your own concise synoptic-weather forecast guide.