
9.1.4: Natural Abundances of Elements
- Page ID
- 18485

Oxygen, silicon, aluminum, iron, calcium, sodium, potassium, magnesium, and titanium make up 99% of Earth’s crust. We saw a histogram of this distribution in Figure 2.2 (Chapter 2). It is no wonder, then, that humans have developed ways to use these elements in industry, agriculture, and manufacturing. Less abundant elements have also become important to modern society. These include metals, radioactive elements such as uranium or thorium, and fertilizer components including, most importantly, nitrogen and phosphorous. As shown in the table below, some important elements make up very small percentages of Earth’s crust; nevertheless, natural processes concentrate them in particular minerals and in particular places.
| Natural Abundance, Economical Ore Grade, and Concentration Factors for Some Metals | |||
| ore resource | metal concentration in average crustal rock | minimum ore grade for profitable extraction | economical concentration factor |
| aluminum | 8.2 wt% | 30 wt% | 4 |
| iron | 5.6 wt% | 20 wt% | 4 |
| sodium | 2.4 wt% | 40 wt% | 17 |
| manganese | 0.09 wt% | 35 wt% | 370 |
| chromium | 0.01 wt% | 30 wt% | 2,940 |
| nickel | 0.008 wt% | 0.5 wt% | 60 |
| zinc | 0.007 wt% | 4.0 wt% | 570 |
| lead | 0.001 wt% | 4.0 wt% | 2,900 |
| copper | 0.006 wt% | 0.5 wt% | 80 |
| tin | 0.0002 wt% | 0.5 wt% | 2,500 |
The economical concentration factor listed in the table above is the ratio of typical minimum economical ore concentration to average crustal concentration. For example, the average crustal abundance of chromium is about 0.01 wt %. Chromium ore can sometimes be profitable if it contains 30 wt % chromium. The necessary concentration factor is therefore nearly 3,000 – chromium must be concentrated at least 3,000 times to create profitable ore. The table compares economical concentration factors for a dozen different metals. They are ordered from those most abundant (top) to those that are rare (bottom). Concentration factors range from 4 for aluminum and iron, to nearly 3,000 for tin, chromium and lead.
Elements that occur in high abundance do not need a high concentration factor to make mining economical. In contrast, less common chromium, lead, tin, and zinc require great concentrations to be profitably mined (see the table above). We mine relatively common elements, such as iron and aluminum, in many places worldwide; we mine rarer elements, including tin, chromium, or lead, in far fewer places.
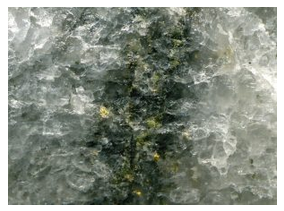
Although the table does not include prices, there is a correlation between the economical ore grades and the price of a given resource. Gold, for example, is much more expensive than the metals listed, although the demand for gold is less than for the others. This price difference exists because the natural processes that concentrate most commonly used metals are much more common than the processes that concentrate gold, so there are fewer high-quality gold deposits than there are other kinds of deposits. Many gold mines can remain profitable even if the ore contains less than 0.1 ounces of gold in a ton of rock. Figure 9.16 shows an example of gold ore from Greenland. The gold flakes are small – the entire photo is less than 2 cm across.
The market for metals can be extremely volatile. Geopolitics, wars, economic sanctions, and other things may cause major market disruptions. But, trends in technology may, over the long run, be even more significant. For example, beginning about 5 years ago, many predicted that the demand for electric vehicles (EV) was going to skyrocket. A growing EV industry means that demand for lithium-ion batteries will increase. So, in 2016, the average market price for lithium began rising and doubled in two years.
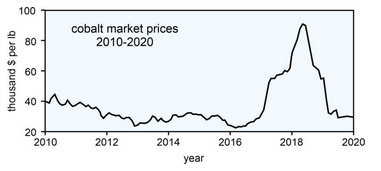
But, lithium-ion batteries also include other key metals besides lithium, for example cobalt. Between 2016 and 2018, cobalt prices increased from just over
95,000 per tonne (Figure 9.17). But, since spring of 2018, prices have collapsed as cobalt lost 75% of it value. Why did this happen? Several things are undoubtably important. Perhaps most significant is that the projected increase in EV sales and demand for lithium-ion batteries did not occur as rapidly as predicted. Additionally, when things looked good, the world’s major cobalt mines, most of which are in the Democratic Republic of the Congo, greatly increased production. At the same time, smaller independent operators started new mines.
So now we have a market surfeit of cobalt, and prices are about the lowest they have been in a decade. Still, market prognosticators say that with the inevitable increase in demand for EVs, and for rechargeable batteries in general, prices for cobalt, nickel and graphite, and other key components of lithium-iron batteries can be expected to increase soon.