
2.5.1: How to Normalize a Mineral Analysis
- Page ID
- 18299

We normally report mineral analyses in values of oxide weight %, but mineral formulas are written in terms of numbers of atoms. Normalization is the process of converting an analysis into a formula. Normalization is a tedious but straightforward arithmetical operation when done by hand. Fortunately there are Excel spreadsheets and programs to do it for you.
The table below gives the chemical analysis of a feldspar from Grorud, Norway. Column A lists the oxides and column B gives the results of the analysis. Columns C, D, E, and F give chemical data for the oxides.
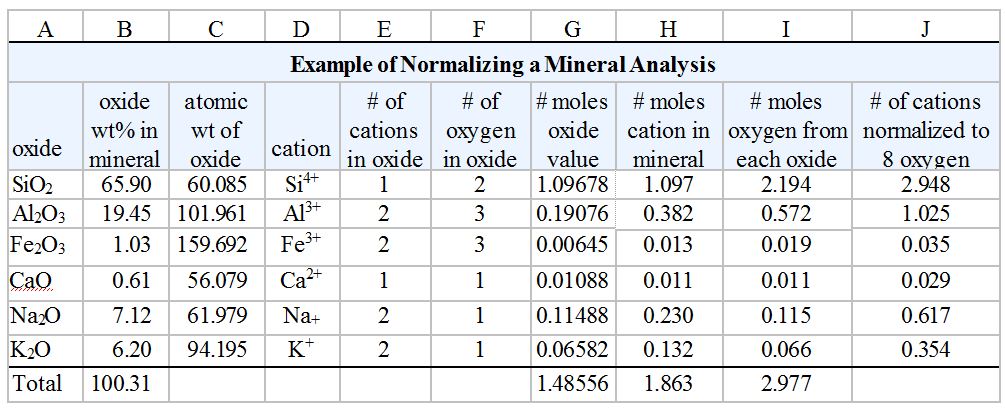
The Grorud feldspar contains 65.90 wt % SiO2, 19.45 wt % Al2O3, 1.03 wt % Fe2O3, 0.61 wt % CaO, 7.12 wt % Na2O, and 6.20 wt % K2O. To convert from % grams of oxides to moles of oxides, we divide the oxide weight % values (column B) by oxide atomic weight (column C); column G shows the results. The values in column G are relative values only; they total to 1.486, which has no scientific meaning.
To calculate relative numbers of cations, we multiply the values in column G (moles of oxides) by the number of cations in each oxide (column E). To calculate moles of oxygen, we multiply the values in column G by the number of O in each oxide (column F). Columns H and I give the results of these calculations.
Using the numbers in column H and the oxygen total of 2.977, we could write the formula of the feldspar as Ca0.011Na0.230K0.132Fe0.013Al0.382Si1.097O2.977, but normal feldspar analyses are written with 8 atoms of oxygen. So, in the last column (J) we have multiplied all the atom numbers in columns H and I by a constant factor so that the number of atoms of oxygen is exactly 8. The values in column J give us the normalized formula for the feldspar (Ca0.029Na0.617K0.354)(Fe0.035Al1.025Si2.948)O8. The parentheses remind us which elements substitute for each other.
As pointed out earlier in this chapter, most feldspars are primarily solutions of three end members: anorthite (CaAl2Si2O8), albite (NaAlSi3O8) , and orthoclase (KAlSi3O8). So, ideal feldspar formulas have stoichiometry described by (Ca,Na,K)(Al,Si)4O8; the Grorud feldspar comes very close to this. Any discrepancy is due to analytical imprecision.
If we ignore the small amount of Fe that is present, the Grurud feldspar composition can be described as:
XAn = 0.029 CaAl2Si2O8 (= 2.9% anorthite)
XAb = 0.617 NaAlSi3O8 (= 61.7% albite)
XOr = 0.354 KAlSi3O8 (= 35.4% orthoclase)
The numbers 0.029, 0.617, and 0.354 are called mole fractions; they are equivalent to percent divided by 100.
Above we plotted olivine compositions on a line – on a binary diagram. Lines work for depicting solid solutions with two end members but not for solutions, like feldspars, that have three. We use triangular (ternary) diagrams for that purpose. And, for solutions with more than three end members, we are out of luck because we cannot easily draft diagrams in more than two dimensions.
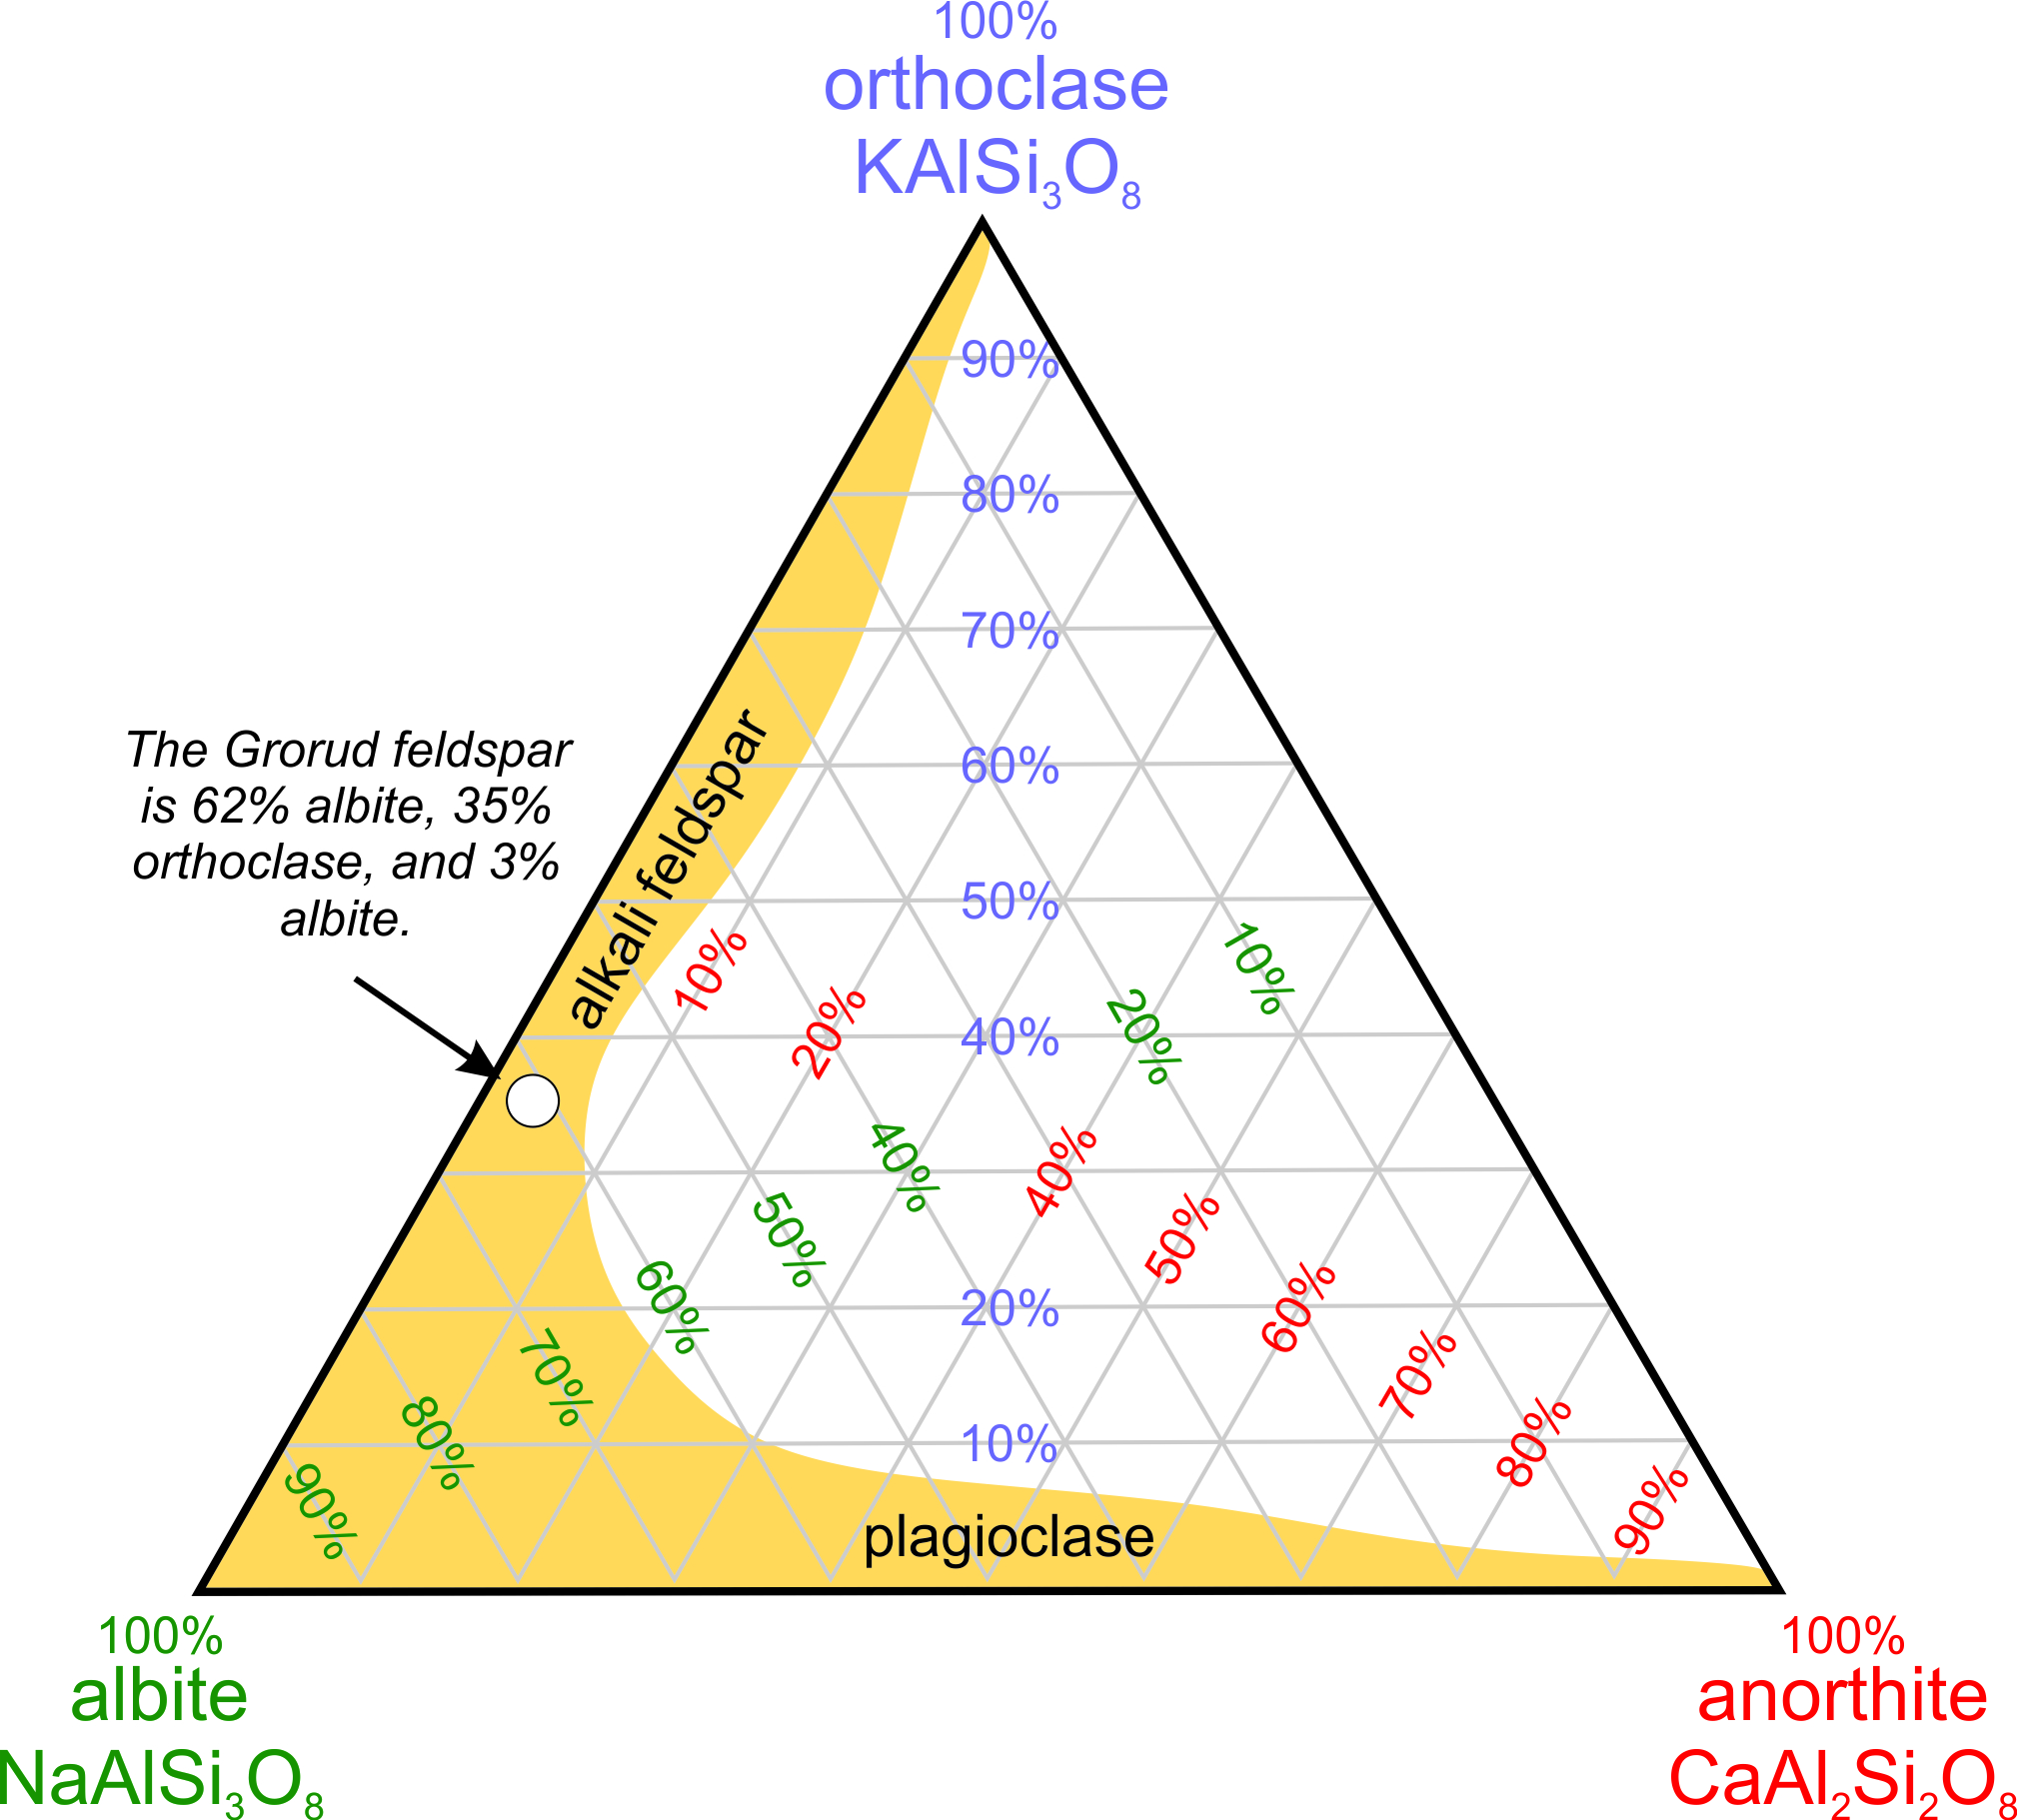
2.22 Ternary feldspar diagram
The diagram seen in Figure 2.22 is a ternary feldspar diagram with end members anorthite, albite, and orthoclase at the corners. The red numbers label lines of constant anorthite content, the purple numbers label lines of constant orthoclase content, and the green numbers label lines of constant albite content. Thus, any feldspar made of combinations of albite, anorthite, and orthoclase can be plotted on diagrams like this.
The yellow region shows a range of compositions that includes most common feldspars. Except in very high temperature igneous rocks, feldspars are either alkali feldspars (solutions dominated by orthoclase and albite) or plagioclase (solutions dominated by albite and anorthite). Solutions between anorthite and orthoclase do not exist in nature. The white dot shows where the composition of the Grorud feldspar plots; it is an alkali feldspar that is 62% albite.