
20.1: Front Matter
- Page ID
- 14873

What Is the Climate System?
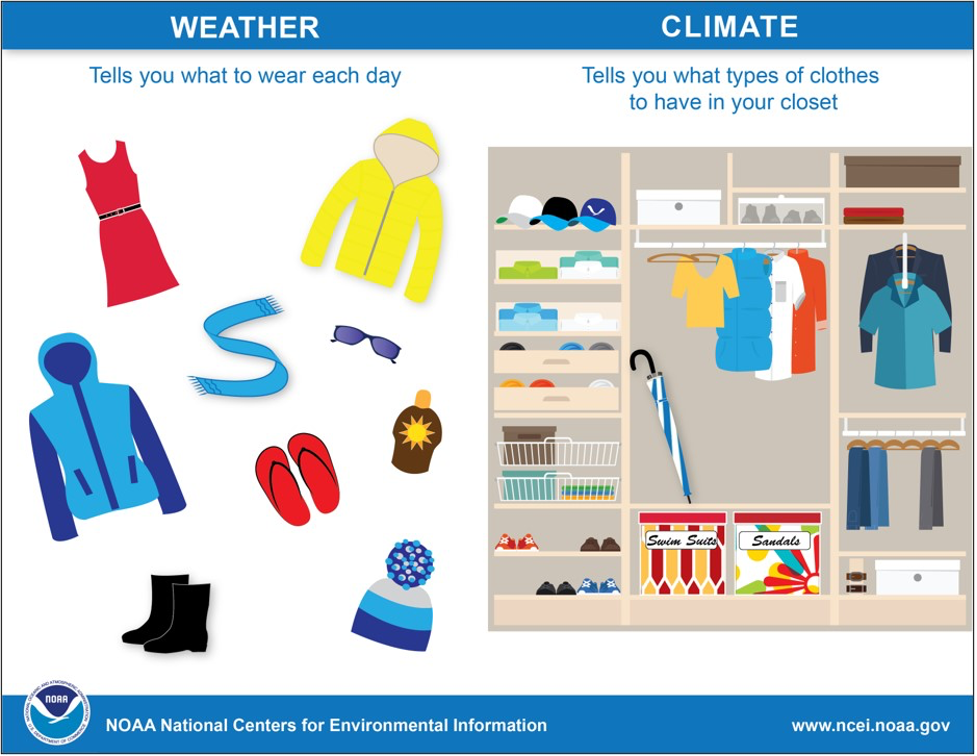
Recall that climate is the long-term weather pattern across a region. It is important to emphasize the “long-term” portion of the definition to establish that climate is different from weather (Figure 20.1). Weather is the local and short-term patterns in temperature, humidity, precipitation, atmospheric pressure, wind, and other meteorological variables. Weather fluctuates throughout the day, week, month, and year such that it is difficult to see trends beyond the random noise in the system. If you examine weather over the long-term, we can begin to see patterns across time and geography that help to better understand and identify the factors that influence the climate system.
The climate system is the interconnected network of variables that influence the earth’s climate, which includes components from the five Earth spheres (geosphere, atmosphere, hydrosphere, cryosphere, biosphere, including humans), and the exosphere (beyond our planet). It is important to distinguish humans from other life for several reasons, primarily because many of our activities are unique amongst life (including industrialization) and it clarifies our role in climate change. The science responsible for examining past, current, and future climate is incredibly complex and interdisciplinary. The history of climate is recorded within rocks, sediments, fossils ,and ice, and climate can be altered by geologic events and influenced by our use of geological resources such as fossil fuels. Climate science is essential to understanding the dynamics and implications of future climate change, as well as attempting to combat or mitigate the potential effects.
The science behind climate change is robust and well-studied; there is consensus within the scientific community regarding the impact of humans on climate. The data demonstrate that humans are warming the climate at a rate faster than Earth has experienced in the last 55 million years. Unfortunately, within the broader population there are still many who deny the impact of humans on climate. This is likely related to factors beyond science, including economics, politics, the portrayal of science by the media, and the public’s overall scientific literacy. Here in California, regardless of your location, you have likely already experienced the effects of a changing climate. During the last decade, we have seen much of the state plagued by severe droughts and an increased number and intensity of wildfires, coastal communities are combating rising sea-level, and the snowpack of the Sierra Nevadas have become significantly reduced, affecting the water supply for 23,000,000 Californians.
A person who studies climate or climate science is typically referred to as a climatologist or climate scientist. However, there are many categories of climate scientists, many of which study climate through the different Earth spheres. For example, glaciologists, sedimentologists, oceanographers, and even paleontologists can be climate scientists. Each branch uniquely investigates Earth’s climate through time by studying ice cores, marine sediment cores, or rocks and fossils. Like many other geoscientists, working with other disciplines is common, with a heavy influence from both math and technology. Many are employed by universities where they teach and/or do research, and state and federal agencies, including geological surveys, like the California Geological Survey or United State Geological Survey (USGS). Additional career pathways include environmental policy and legislation and consulting, or science communication via the private sector or state and federal agencies. Many of these career options require a college degree and postgraduate work. If you are interested in climate science talk to your geology instructor for advice. We recommend completing as many math and science courses as possible. Also, visit National Parks, CA State Parks, museums, gem & mineral shows, or join a local rock and mineral club. Typically, natural history museums will have wonderful displays of rocks, including those from your local region. Here in California, there are a number of large collections, including the San Diego Natural History Museum, Natural History Museum of Los Angeles County, Santa Barbara Museum of Natural History, and Kimball Natural History Museum. Many colleges and universities also have their own collections/museums.
Many people are often overwhelmed with the impacts of climate change and ask “but what can I do?” Change can begin in your own communities: use the EPAs carbon footprint calculator and see what you can start doing differently today. Support public officials who stand with science and are willing to adapt and formulate plans of action by voting. Begin a Climate Change club at your college and engage with the community and local organizations who advocate for environmental justice. For more ways to reduce your impact on the environment, read this article from the Earth Institute at Columbia University.
How Is Heat Transferred within the Climate System?
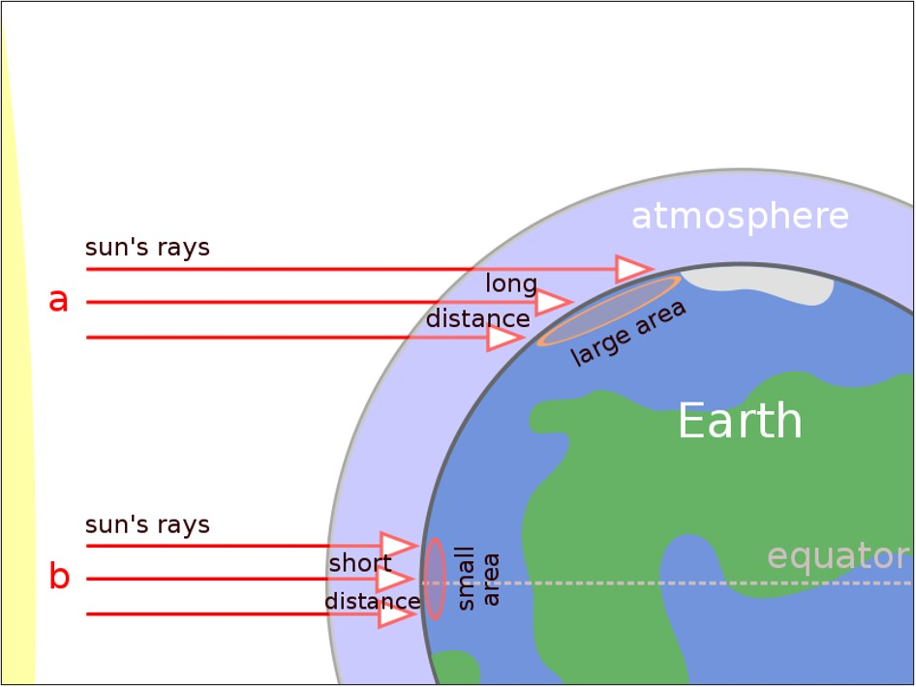
The heat that feeds the climate system comes from two primary sources. The first source is internal to earth, the heat radiating from the Earth itself. This heat is primarily from the decay of radioactive material and residual heat from the formation of earth. This heat is not distributed equally, with more heat escaping in areas where the crust is thinner, such as divergent boundaries. The second, and more significant source, is the heat Earth receives from solar radiation. Again, this heat is not distributed equally across the earth’s surface. The amount of energy received is related to the angle at which the sun’s rays hit the surface. Overall, these angle differences create the large climate differences across Earth. For example, at the equator solar radiation is received perpendicular to the surface which causes more heat to be absorbed per square foot. Conversely, at the poles, solar radiation is received parallel or at an oblique angle, which results in less heat absorption; therefore, the tropics are much warmer than the poles. (Figure 20.2).
The Albedo Effect
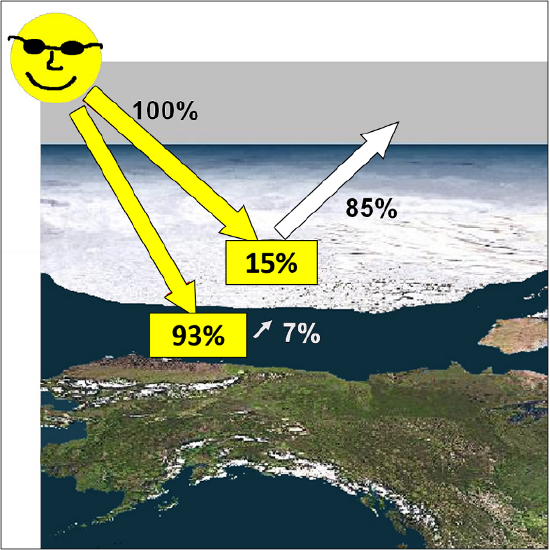
While the angle and amount of incoming solar radiation (insolation) is the most important determinant of Earth’s climate, the material on the Earth’s surface is also important, as not all materials will react the same to solar radiation. For example, darker colored materials, like the ocean, absorb and reradiate heat, most of which is retained at the surface of the planet. You are likely familiar with this if you have ever walked barefoot on dark concrete or asphalt in the summer. Lighter colored materials, like ice and snow, reflect solar radiation off the Earth’s surface. This is the reason many skiers and glacial scientists use eye protection to avoid snow blindness.
The proportion of solar radiation that is reflected off the Earth’s surface is called albedo, which varies depending on the type of ground cover (Figure 20.3). Earth’s albedo is higher when it is covered with large expanses of glacial ice and therefore both the amount of sunlight absorbed and the temperature are lower. The distribution of water, ice, snow, vegetation, and other materials on the Earth’s surface control the Earth’s albedo and can change over time.
The Exosphere and Climate Change
Many factors external to Earth influence the climate system. These include the amount of radiation produced from the sun as it varies over time, the overall shape of our orbit around the sun varies over time, and the angle at which solar radiation hits the planets’ surface. Over a century ago, Serbian scientist Milutin Milankovitch hypothesized the long-term, collective effects of changes in Earth’s position relative to the Sun were a strong driver of Earth’s long-term climate and responsible for triggering the beginning and end of glacial periods (Ice Ages). Milankovitch determined that over time, Earth’s placement in space affects the amount of radiation received from the sun. Collectively, his ideas are known as the Milankovitch Cycles and include the following patterns of motion.
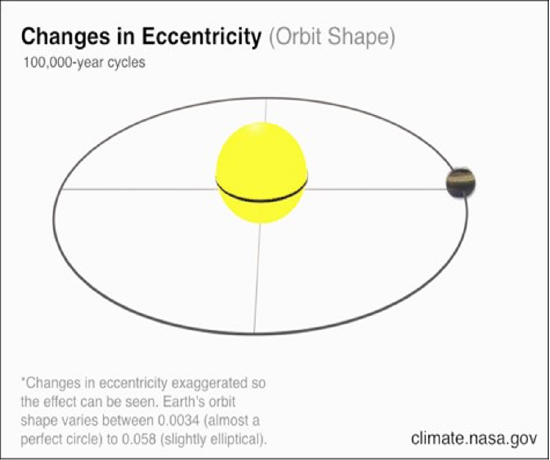
Eccentricity, the overall shape of Earth’s orbit around the Sun, alternates between more circular and more elliptical in a cycle that spans about 100,000 years, in part due to the gravitational influence of the gas giants, Jupiter and Saturn. Currently, Earth’s eccentricity is near its least elliptic (i.e. most circular) and is very slowly decreasing (Figure 20.4). For GIFS visit this NASA page.
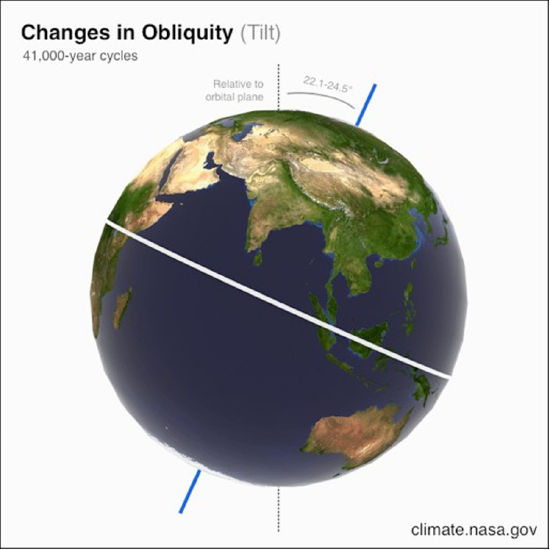
Obliquity is the angle of Earth’s axis of rotation relative to its ecliptic plane around the Sun. Obliquity is the reason Earth has seasons and is a very strong control on Earth’s climate and glacial periods. Typically, Earth’s obliquity varies between 22.1 and 24.5 degrees in a cycle that spans about 41,000 years, with minimum tilt favoring glaciation and maximum tilt promoting interglacial periods. Earth’s axis is currently tilted 23.4 degrees and is very slowly decreasing towards minimum tilt (Figure 20.5). For GIFS visit this NASA page.
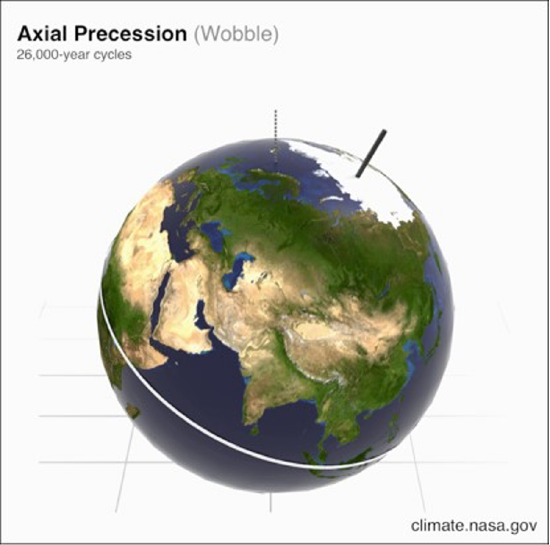
Precession is the slight wobble of Earth as it rotates on its axis. This wobble is due to tidal forces caused by the gravitational influences of the Sun and Moon. The direction of wobble is determined relative to the fixed positions of stars; Earth is currently fixed to Polaris in the northern hemisphere but may wobble toward other North Stars, including Thuban and Kochab. The cycle of axial precession spans about 25,000 years (Figure 20.6). For GIFS visit this NASA page.
When the cycles occur together at the same interval, they can influence Earth’s climate, and with other factors in place may encourage a glacial period or glaciation to occur.
The Atmosphere and Climate Change
Once heat radiates off Earth’s surface it travels into the atmosphere. Certain gases in Earth’s atmosphere, called greenhouse gases, allow sunlight to pass but absorb terrestrial energy and radiate it in all directions, including back to the surface of the Earth (Figure 20.7).
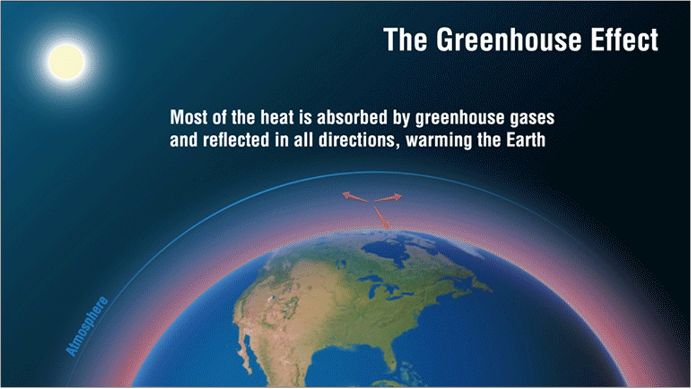
These gases, such as water vapor, carbon dioxide, ozone, and methane, represent a tiny but important fraction of atmospheric material. Different greenhouse gases vary in how effectively they absorb and reradiate energy and in their relative proportions in the atmosphere; a higher concentration of potent greenhouse gases can retain more thermal energy within the atmosphere while the rest of the reflected and radiated energy escapes from the atmosphere and dissipates into space. The proportion of greenhouse gases in the atmosphere has changed dramatically through geologic time as a result of numerous factors influencing the atmospheric system, including the rate of plate motion, amount of volcanism, photosynthesis, weathering of rocks, burning of fossil fuels, and more.
Another major component of our atmosphere are aerosols (sea spray, dust, ash, etc.). Aerosols originate from surficial processes, like the expulsion of ash or sulfur dioxide from volcanoes and the burning of fossil fuels, that can alter climate by reflecting incoming solar radiation before it reaches the Earth’s surface.
The Oceans and Climate Change
The oceans influence the weather on local to global scales, while changes in climate can fundamentally alter many properties of the oceans. Heat is transported across the Earth’s surface through wind currents, storms, and ocean currents (Figure 20.8). Large circular ocean currents, called gyres, appear to have a significant impact on the geographic distribution of heat on Earth and large-scale climate change in Earth’s history. These currents are particularly effective in melting polar ice as they melt the sea ice from below.
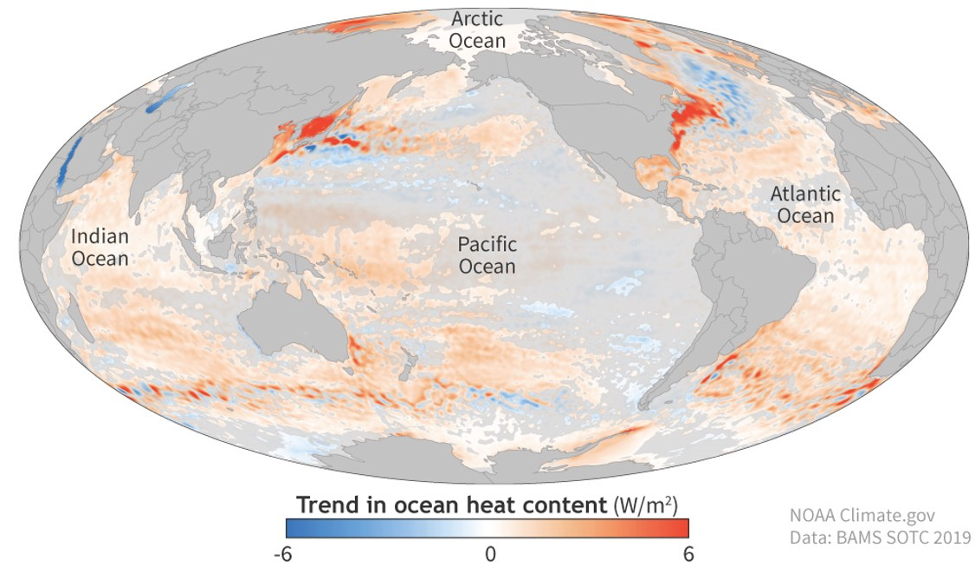
More than 90% of the warming that has happened on Earth over the past 50 years has occurred in the ocean. Ocean heat content not only determines sea surface temperature, but also affects sea level and currents. Scientists have determined that global sea level has been steadily rising since 1900 at a rate of at least 0.04 to 0.1 inches per year. Sea level can rise by two different mechanisms with respect to climate change: 1) as the oceans warm due to an increasing global temperature, seawater expands, taking up more space in the ocean basin and causing a rise in water level, and 2) as ice melts on land and drains to the ocean, increased volume of water in the ocean basin causes a rise in sea level. Rising sea-level has major implications for our coastal states and communities, including flooding and the way we manage our coastal resources.
Lastly, the oceans absorb 30% of atmospheric carbon dioxide. As these carbon dioxide levels rise and more is absorbed by the oceans, the average pH of the ocean changes, a process called ocean acidification. The higher acidity affects the balance of minerals, like calcite and aragonite, in the water, which can make it more difficult for certain marine animals to build their skeletons or shells.
The Cryosphere and Climate Change
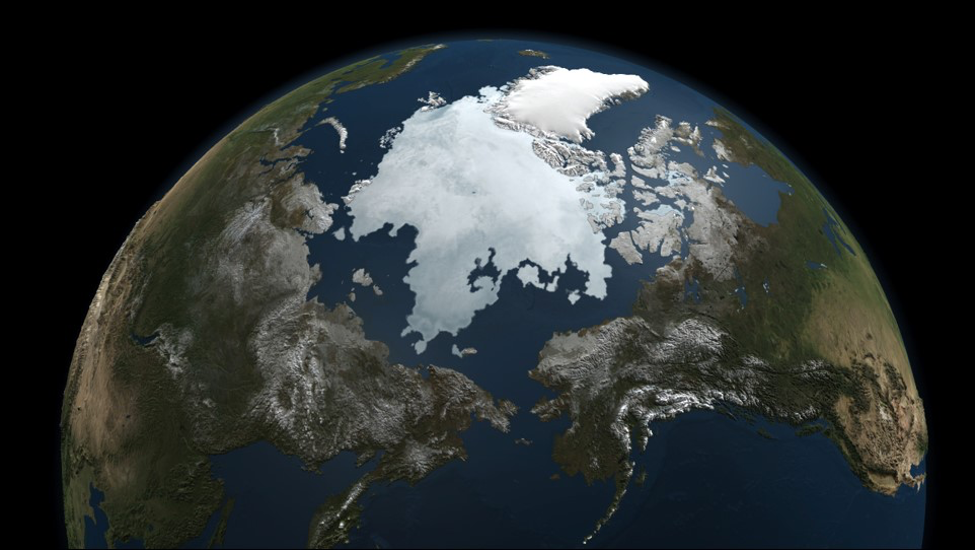
The extent of sea ice coverage on the North and South Polar ice sheets is easy to assess from satellite images and is measured as the size of the ice sheet in million square kilometers (Figure 20.9). Sea ice extent is not a perfect indicator of global climate change, but it is easy to understand that a warming of the Earth is likely to cause a decrease in the amount of ice at the poles and thus a decrease in the sea ice extent, while a cooling event will cause an increase in ice production.
Climate Feedback Loops
Based on the number of variables and how they change over time, it is readily apparent how complex and interconnected the climate system is. For instance, when a volcano erupts, it 1) adds some thermal energy to the climate system, 2) produces aerosols that block solar radiation from hitting the Earth’s surface, and 3) produces greenhouse gases that retain heat. Notice that these factors do not influence climate in a consistent way. The change of one variable as the result of another is called feedback, which can be positive (reinforcing) or negative (discouraging). For climate, a feedback that increases an initial warming is called a positive feedback whereas a feedback that reduces an initial warming is a negative feedback.
Positive feedback loops enhance or amplify changes, moving the system away from equilibrium. For instance, if Earth warms, ice melts and reduces albedo, which results in additional warming. This can also occur in the opposite direction: if Earth cools, ice forms and increases albedo, which results in additional cooling.
Negative feedback loops dampen or buffer changes, holding a system to some equilibrium state and making it more stable. For instance, if the Earth warms, more surface area becomes arid, resulting in an increase in the amount of dust in the atmosphere, which reflects solar radiation, causing cooling. Again, the opposite works: if the Earth cools, less surface area is arid, resulting in a decrease in the amount of dust in the atmosphere, which causes warming.
Understanding the climate system requires identifying all significant climate variables, how they are related to each other, the speed at which they can change, and the magnitude and direction of change for each feedback loop. The best way to gain a better understanding of the climate system is to study it through geologic history.
Climate Proxies and the Climate Record
For many of us, the most obvious method to study climate would be to record it directly. For example, we could use a thermometer to directly measure air temperature; however, thermometers only provide a localized measurement, and more importantly, they are a relatively recent invention. How do we measure the temperature of the Cretaceous, Permian or Devonian atmospheres or oceans? Direct observations do not give us the long-term trends we need to establish climate change patterns; instead, we must look at a natural recorder of climate called a climate proxy. As climate changes, it affects the deposition of sedimentary rock, rock chemistry, and fossil organism, all of which can be studied by geoscientists to reconstruct ancient climate patterns in a field called paleoclimatology.
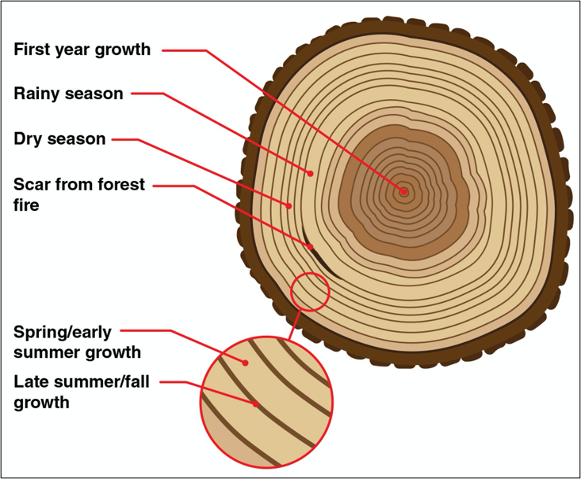
An individual climate proxy may not provide a clear signal of global climate for a couple of reasons: 1) proxies show a history of the area in which they were formed, not of an entire region, 2) an individual proxy, which may have a long or a short record, can record the short-term variability of weather events, and 3) most climate proxies are influenced by multiple factors. For instance, the thickness of tree rings, dendrochronology, is a wonderful proxy for temperature. Trees grow more in warmer years, producing thicker rings, and less in colder years, producing thinner rings; however, a tree could also grow slowly because of a drought or because of an infestation of pests even if it was a warm year (Figure 20.10).
If all individual proxies show local patterns, with some degree of weather-related noise, and possibly influenced by other factors, how can we reconstruct long-term global temperature records? The answer lies in increasing the size of the dataset. If temperature is the most important variable influencing the proxies, and we combine hundreds to thousands of individual proxy records, an overarching pattern emerges. Again, an individual proxy record may be contrary to the overall trend, but that is to be expected since a local region can have a cold winter during an overall hot year for the planet. To illustrate this, consider the following: say we want to reconstruct overall economic patterns over the past few hundred years in the United States of America. We could examine lots of proxies for economic growth, like employment, the stock market, individual wealth, or rates of home ownership. If we only looked at one of these proxies, we likely would not get a clear picture of change. Also, if we only looked at Los Angeles, California, for example, we would be unlikely to see a trend that mimics the entire country. Again, the more data we have, whether for climate or any other complex system, the clearer the signal becomes over the local and random noise.
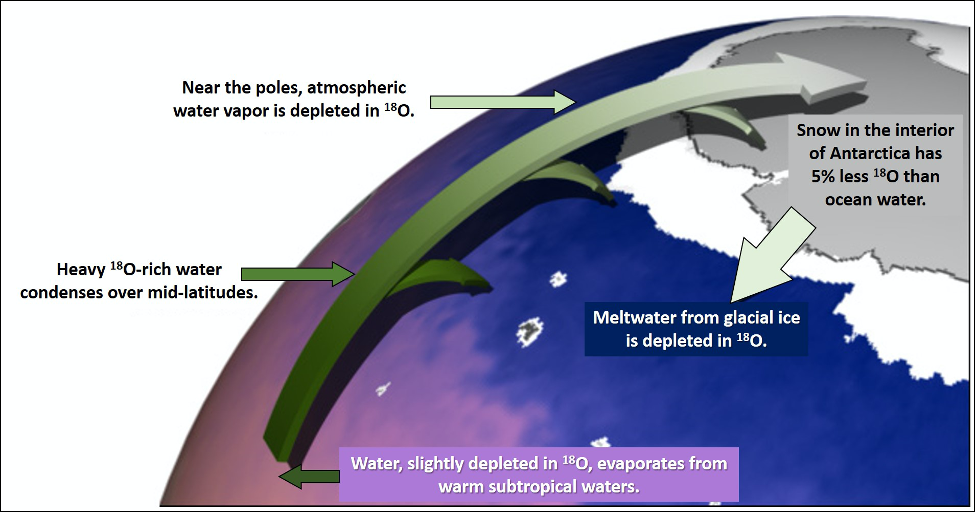
One of the most commonly used climate proxies is the measurement of oxygen isotopes. As you may remember, isotopes are atoms of the same element that differ in their masses because of differences in the number of neutrons in the nucleus of the atom. Multiple isotopes of oxygen are stable, meaning they do not radioactively decay over time. Oxygen has two stable isotopes that occur in a constant ratio on Earth; however, certain minerals, like calcite or ice, prefer one isotope over the other within their crystal structure. This preference results in a ratio of oxygen isotopes that is different from the ratio found in other materials; this difference is called fractionation. The amount of fractionation in oxygen isotopes is temperature dependent, such that the mineral calcite has a different ratio of oxygen isotopes if it was formed in near-freezing versus warm water. Oxygen isotopes provide climate records from many different sources, including coral, clams and other mollusks, the skeletons of single-celled organisms (foraminifera and coccolithophores), and ice cores to name a few (Figure 20.11). Ice cores contain a wealth of climate data in addition to temperature data from oxygen isotopes; they also include air bubbles that record the levels of greenhouse gases, concentrations of windblown aerosols, and ash from volcanic eruptions.
Other proxies include the extent of glacial sediment, sea level curves, pollen (palynology), and fossils. For instance, climatologists have used several features within fossil plants to reconstruct climate, largely because these organisms are sensitive to climate. These proxies include the thickness of tree rings, the shape of the leaves, and the density of pores on leaf surfaces.
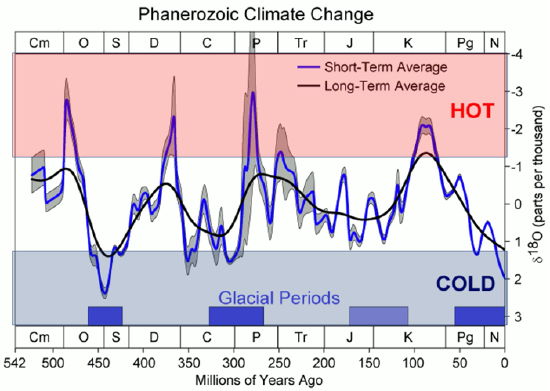
By combining hundreds to thousands of individual climate records, climate scientists begin to gain insight into overall climate trends. The Intergovernmental Panel on Climate Change (IPCC) and the National Oceanic and Atmospheric Administration (NOAA) regularly compile multiple types of proxy records from across the world to reconstruct climate patterns. The accuracy of climate records very much depends on the time frame being considered, with more certainty in the patterns of the recent past (Cenozoic) and less the further back in geologic time (Figure 20.12).
There is no scientific debate surrounding the interpretation of individual proxies and the resulting climate records; however, there appear to be many-sided discussions that largely stem from the economic and political aspects of climate change. It is important to remember to consider how scientific data is presented to the public and how we make conclusions based on presented data. When presented with new data or information it is important to consider 1) the source of the data, 2) how the data was collected, 3) how the data is presented, and, most importantly, 4) what reasonable conclusions can be drawn from the data independent of opinions. Lastly, as humans who share a planet with many, we must be willing and open to a change in perspective, particularly when faced with new data and information.
Additional Resources on Climate Change
To learn more about the science behind climate change and the scientific community’s position on anthropogenic climate change see the following:
● National Aeronautics and Space Administration (NASA) climate Site
● National Oceanic and Atmospheric Administration Climate Site
● Geological Society of America’s Position Statement on Climate Change
● American Meteorological Society’s Position Statement on Climate Change
● American Chemical Society’s Position Statement on Climate Change
● American Physical Society’s Position Statement on Climate Change
● American Association for the Advancement of Science’s Position Statement on Climate Change
Attributions
- Figure 20.1: “Weather vs. Climate” (Public Domain; NOAA)
- Figure 20.2: “Oblique Rays 02 Pengo” (CC-BY-SA 2.5; Peter Halasz via Wikimedia Commons)
- Figure 20.3: “Derivative of “Ice Albedo” (Public Domain; Don Perovich Cold Regions Research and Engineering Laboratory (CRREL)/NOAA via Flickr) by Chloe Branciforte
- Figure 20.4: “Milankovitch (Orbital) Cycles and Their Role in Climate” (Public Domain; NASA)
- Figure 20.5: “Milankovitch (Orbital) Cycles and Their Role in Climate” (Public Domain; NASA)
- Figure 20.6: “Milankovitch (Orbital) Cycles and Their Role in Climate” (Public Domain; NASA)
- Figure 20.7: “The Causes of Climate Change” (Public Domain; NASA/JPL-Caltech)
- Figure 20.8: “Change in Ocean Heat Content (1993-2019)” (Public Domain; NOAA/Climate.gov, via State of the Climate (2019))
- Figure 20.9: “A Snapshot of Sea Ice” (CC-BY 2.0; NASA/Goddard Space Flight Center Scientific Visualization Studio via Flickr)
- Figure 20.10: “The Causes of Climate Change” (Public Domain; NASA)
- Figure 20.11: Derivative of “Oxygen Isotopes at the Equator and Poles” (Public Domain; Robert Simmon/NASA/GSFC via Earth Observatory) by Chloe Branciforte
- Figure 20.12: Derivative of “Phanerozoic Climate Change” (CC-BY-SA 3.0; Global Warming Art via Wikipedia) by Chloe Branciforte