
5.3: Activity 5B- Hot Spots
- Page ID
- 14546

What Are Hot Spots?
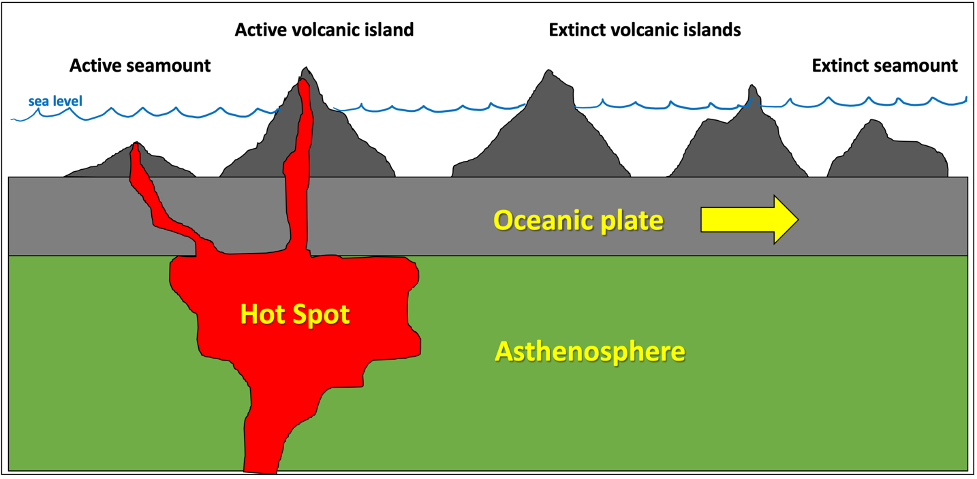
In addition to GPS technology, geologists can also track plate motion using the location of hot spots, volcanically active areas on the Earth’s surface that are caused by anomalously hot mantle rocks underneath (Figure 5.11). This heat is the result of a mantle plume that rises from deep in the mantle toward the surface resulting in the production of magma and volcanoes. These mantle plumes occur within the asthenosphere or deeper, such that they are unaffected by the movement of the continental or oceanic plates. Mantle plumes appear to be stationary through time; therefore, as the tectonic plate moves over the hot spot, a linear chain of volcanoes is produced. This gives geologists a wonderful view of the movement of a plate through time with the distribution of volcanoes indicating the direction of motion and their ages revealing the rate at which the plate was moving. Interested in hot spots? Want to learn more? Read this article from Earth Magazine: The Question of Mantle Plumes.
The Hawaiian Hot Spot
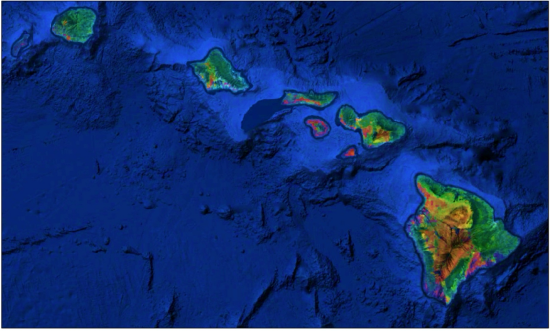
One of the most striking examples of a hot spot is underneath Hawaii. The mantle plume generates magma that results in an active volcano on the seafloor, referred to as a seamount. Each eruption causes the volcano to grow until it eventually breaks the surface of the ocean and forms a volcanic island. As the oceanic plate shifts the volcano off the stationary hot spot, the volcano loses its source for magma and becomes inactive. The volcano then cools down, contracts, erodes, sinks slowly beneath the ocean surface, and is carried by the tectonic plate as it moves over time. As each island moves away from the mantle plume, a new island will then be formed at the hot spot in a continual conveyor belt of islands. Therefore, the scars of ancient volcanic islands near Hawaii give a wonderful view of the movement of the tectonic plate beneath the Pacific Ocean.
Open the browser version of Google Earth and type “Hawaii” into the search bar and zoom out to an eye altitude (Camera) of 700 miles. Examine the chain of Hawaiian Islands.
- On the map of the Hawaiian Islands (Figure 5.12), include the following:
- A North arrow
- Label the following islands: Big Island of Hawaii, Kauai, Maui, Molokai, Oahu
- Next, label on the map the ages of each of the islands. These ages were determined through radiometric dating of the lava flows on the islands.
- Big Island of Hawaii: 0 years old (Active)
- Kauai: 5.1 million years old
- Maui: 1.3 million years old
- Molokai: 1.8 million years old
- Oahu: 3.7 million years old
- In Google Earth, measure the distance between the islands. To do this, measure from the center of each island and its adjacent island in centimeters. (Hint: numbers will be large)
- Distance between the Big Island and Maui (in cm):
- Distance between Maui and Molokai (in cm):
- Distance between Molokai and Oahu (in cm):
- Distance between Oahu and Kauai (in cm):
- Look closely at each island in Google Earth and record the maximum elevation in centimeters. (Hint: elevation can be determined by placing your cursor over a point and reading the elevation on the lower right of the image by the latitude and longitude. The elevation units can be changed in your settings. To locate the highest point on the islands, tilt the image or use the 3D button. Convert meters to centimeters by multiplying by 100.)
- Big Island of Hawaii, max elevation (in cm):
- Kauai, max elevation (in cm):
- Maui, max elevation (in cm):
- Molokai, max elevation (in cm):
- Oahu, max elevation (in cm):
- Consider the ages and positions of the islands listed above along with what you know about plate tectonics and hotspots. In what general direction is the Pacific Plate moving?
- Northwest
- Southeast
- Northeast
- Southwest
- How fast was the Pacific plate moving during the last 1.3 million years between the formation of the Big Island and Maui? Use the measurements you made from one island’s center to the other. Calculate your answer in cm/year. (Hint: Rate = Distance/Time). SHOW YOUR WORK.
- How fast was the Pacific plate moving between the formation of Oahu and Kauai? Use the measurements you made from one island’s center to the other. Calculate your answer in cm/year. (Hint: Rate = Distance/Time). SHOW YOUR WORK.
- Zoom out and examine the dozens of sunken volcanoes, referred to as extinct seamounts, to the northwest of Niihau, these are named the Emperor Seamounts. As one of these volcanic islands on the Pacific Plate moves off the hotspot it becomes inactive, or extinct, and the island begins to sink as it and the surrounding tectonic plate cool down. The speed the islands are sinking can be estimated by measuring the difference in elevation between two islands and dividing by the difference in their ages. Note, this method assumes the islands were a similar size when they were active.
- Calculate how fast the Hawaiian Islands are sinking, by using the ages and elevations of Maui and Kauai. (Hint: Rate = Distance/Time). SHOW YOUR WORK.
- When will the Big Island of Hawaii sink below the surface of the ocean? (Hint: use the rate calculated above, ignoring possible changes in sea level, and the max elevation of the Big Island in centimeters; Time = Distance/ Rate). SHOW YOUR WORK.
Attributions
- Figure 5.11: “Life of a Hotspot” (CC-BY 4.0; Chloe Branciforte and Cindy Lampe, own work)
- Figure 5.12: “Hawaiian Islands” (CC-BY 4.0; Chloe Branciforte using Google Earth, own work)