
16.1: Introduction to Geological Maps and Cross-sections
- Page ID
- 14856

What Are Geologic Maps and Why Are They Important?
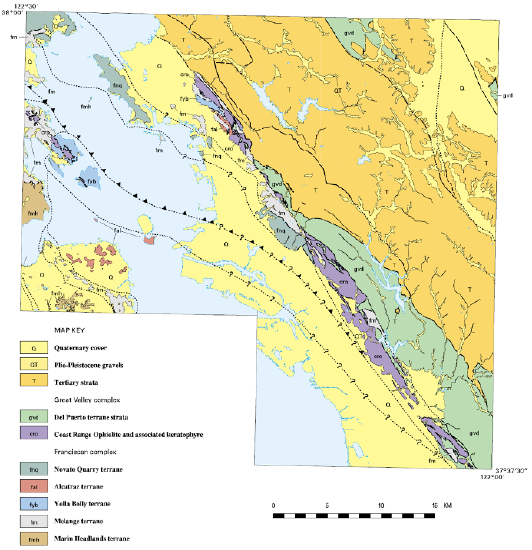
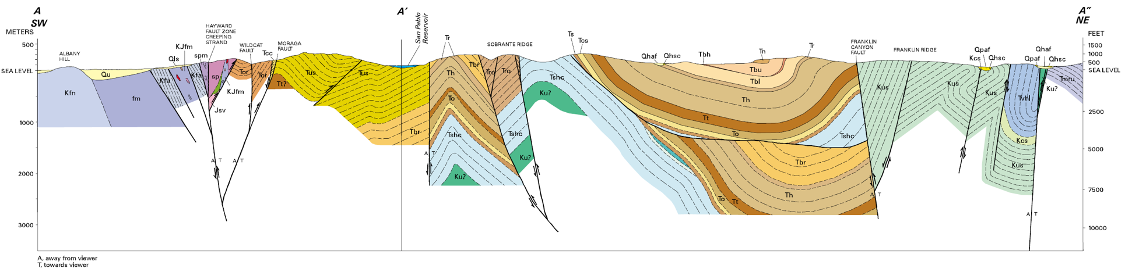
A geologic map uses lines, symbols, and colors to illustrate information about the nature and distribution of rock units within an area (Figure 16.1). Typically, a geologic map will depict mappable rock or sediment units. A mappable unit of rock or sediment is one that a geologist can consistently recognize, trace across a landscape, and describe so that other geologists may recognize and verify its presence and identity. Generally, a mappable unit is a geologic formation. These mappable units are shown as different colors or patterns on a base map (usually a topographic map), over which information about geologic contacts and strikes and dips are included. Geologists make these maps by making careful field observations at numerous outcrops (exposed rocks at the Earth’s surface) throughout the mapping area. At each outcrop, geologists record information such as rock type, strike and dip of the rock layers, and relative age data. Geologic maps take practice to understand, since they display three-dimensional features, such as folds, on a two-dimensional surface.
Geologic maps are important for two reasons. First, as geologists make geologic maps and related explanations and cross-sections, they develop a theoretical understanding of the geology and geologic history of a given area. Second, geologic maps are essential tools for practical applications such as zoning, engineering, and hazard assessment. Geologic maps are also vital in finding and developing geological resources, such as sediments, groundwater, fossil fuels, and minerals.
What Are the Essential Components of Geologic Maps?
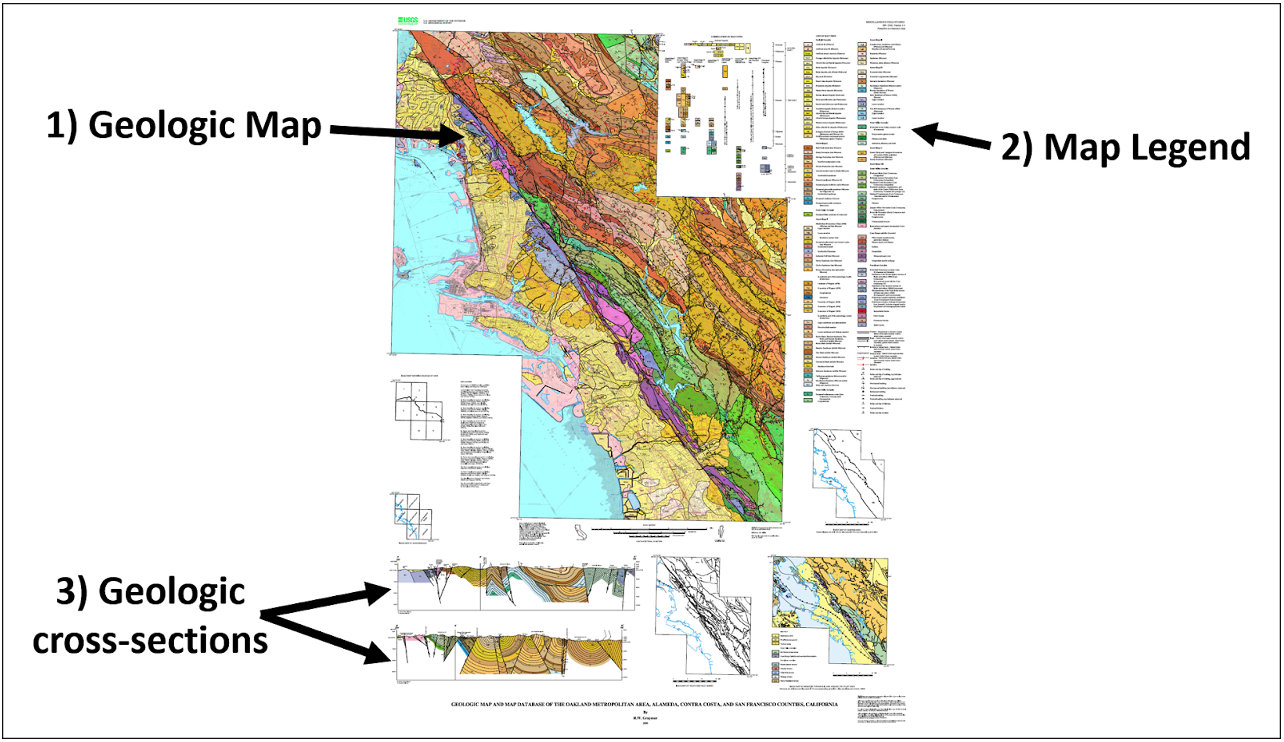
Most geologic maps have the following features (Figure 16.2):
1. The map itself
2. The map legend or key that explains all the symbols on the map
3. Geologic cross-section(s) of the map area. These will be explored further in the next chapter.
What Is a Geologic Map Legend?
The map legend to a geologic map is usually printed on the same page as the map and follows a customary format (Figure 16.3).
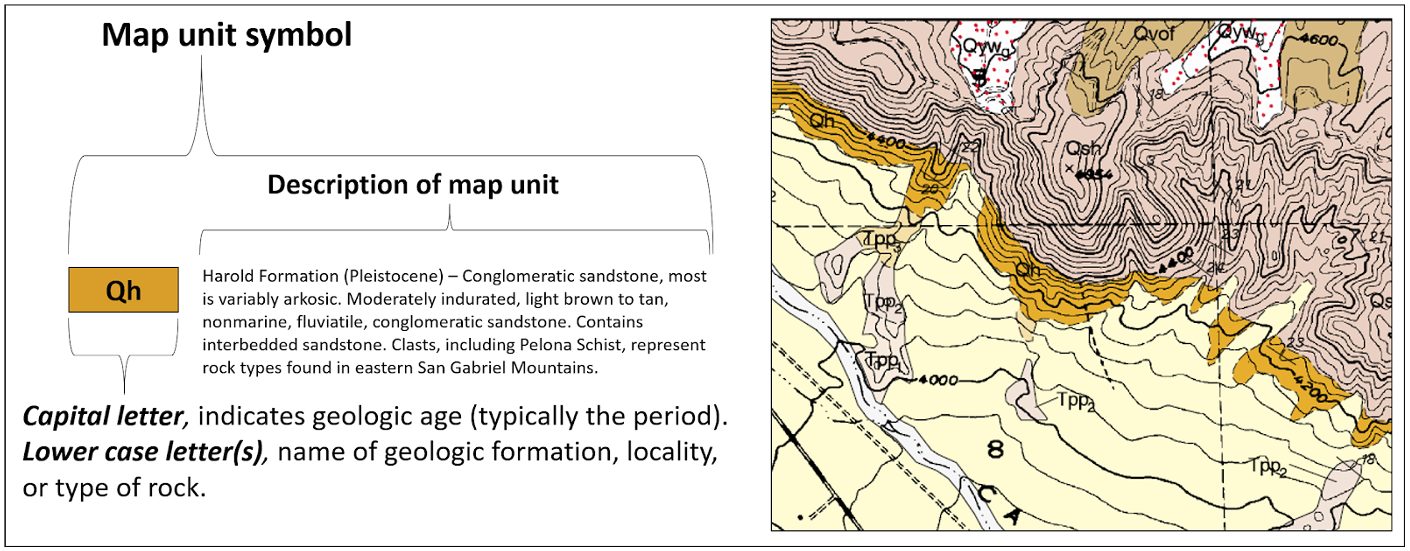
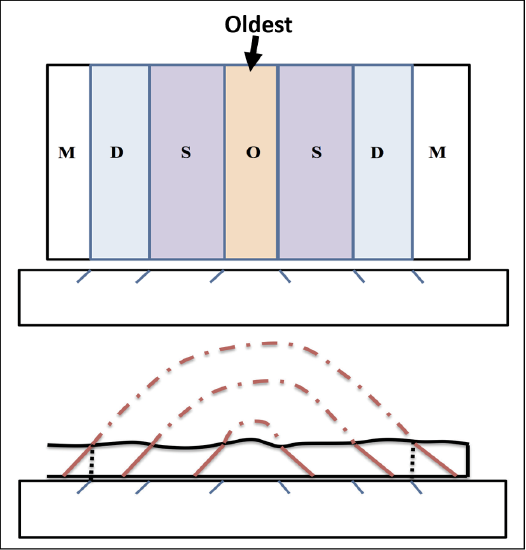
The symbol for each formation, or unit, is shown in a box next to its name with a brief description. The symbols typically follow superposition and are stacked in an age sequence from oldest at the bottom to youngest at the top. This allows the map reader to quickly assess the relative age of each unit. The geologic age (typically the geologic period) is listed for each unit in the key and uses standard symbols (Table 16.1). The map legend also contains an explanation of the symbols shown on the map, such as the symbols for different types of faults and folds (Table 16.2). The explanations of rock units often follow the map symbol on the map, but for very large maps are often given in a separate pamphlet that accompanies the map. The explanations include descriptions with enough detail for any geologist to be able to recognize the units and learn how their ages were determined.
Table 16.1: General geologic age symbols.
| Relative Age | Geologic Age Symbol | Geologic Time Period |
|---|---|---|
| Younger | Q | Quaternary |
 |
T | Tertiary |
| K | Cretaceous | |
| J | Jurassic | |
| Tr | Triassic | |
| P | Permian | |
| IP | Pennsylvanian | |
| M | Mississippian | |
| D | Devonian | |
| S | Silurian | |
| O | Ordovician | |
| Є | Cambrian | |
| Older | pЄ | Precambrian |
Table 16.2: General geologic map symbols.
| Map Symbol | Symbol Explanation |
|---|---|
 |
Strike & Dip |
 |
Vertical strata |
 |
Horizontal strata |
 |
Anticline axis |
 |
Syncline axis |
 |
Plunging anticline axis |
 |
Plunging syncline axis |
 |
Fault |
 |
Strike-slip fault |
 |
Normal fault |
 |
Reverse fault |
What Is a Geologic Cross-section?
Remember that a geologic map will be seen in map-view. However, geologists use information about rocks that are exposed at the surface to visualize the unseen rocks beneath the surface, enabling them to also construct a cross-sectional view. A geologic cross-section illustrates how different types of rock are layered or otherwise configured, including geologic structures, such as folds and faults (Figure 16.4).
How Do I Construct a Geologic Cross-section?
Follow these steps to successfully create your own geologic cross-section (Figure 16.5):
- Locate the points between which you will be constructing a cross-section for. Observe the geologic map in this region. Pay close attention to any strike and dip symbols, geologic contacts, and ages of the rock types.
- Take a sheet of scrap (scratch) paper. Place the paper along the map where you want to draw a cross-section.
- At each geologic contact, make a mark on the scratch paper. Position the marks in the direction you believe the rocks are dipping. To determine this, use any strike and dip symbols. If they are not provided, use the Rule of V’s or the ages given to help determine the geologic structure.
- Transfer the marks from your paper to a provided diagram.
- Sketch in and complete any structures, paying careful attention to dip angles (if provided). Structures may be drawn in with a dotted line above the Earth’s surface to indicate rocks that were formerly present but that have since been eroded.
- Incorporate a legend into the cross-section to explain the types of geologic materials present.
- Include vertical and horizontal scales along with the statement of vertical exaggeration.
Need more information? Watch the construction of a cross-section in this YouTube video.
General Rules for Interpreting Geologic Maps
- Folds
- Anticlines have their oldest beds in the center, and their limbs (sides) dip away from the fold axis or hinge. Plunging anticlines plunge towards the closed end (nose) of the V-shaped outcrop belt.
- Synclines have their youngest beds in the center, and their limbs (sides) dip toward the fold axis or hinge. Plunging synclines plunge toward the open end of the V-shaped outcrop belt.
- Streams
- They intersect dipping beds of rock, they will cut V shapes in the direction of dip.
- They cut “V” shapes into horizontal beds and formation contacts that point upstream. The formation contacts are parallel to topographic contour lines, and the stream drainage system developed on horizontal and/or unstratified formations has a dendritic pattern that resembles the branching of a tree.
- They cut across vertical beds, there will not be a V-shape
- Faults
- Upthrown blocks of faults tend to be eroded more (down to older beds) than downthrown blocks.
- General
- Geologic contacts migrate downdip upon erosion.
- True dip angles can only be seen in cross-section if the cross-section is perpendicular to the fault or to the strike of the beds.
Strike and Dip
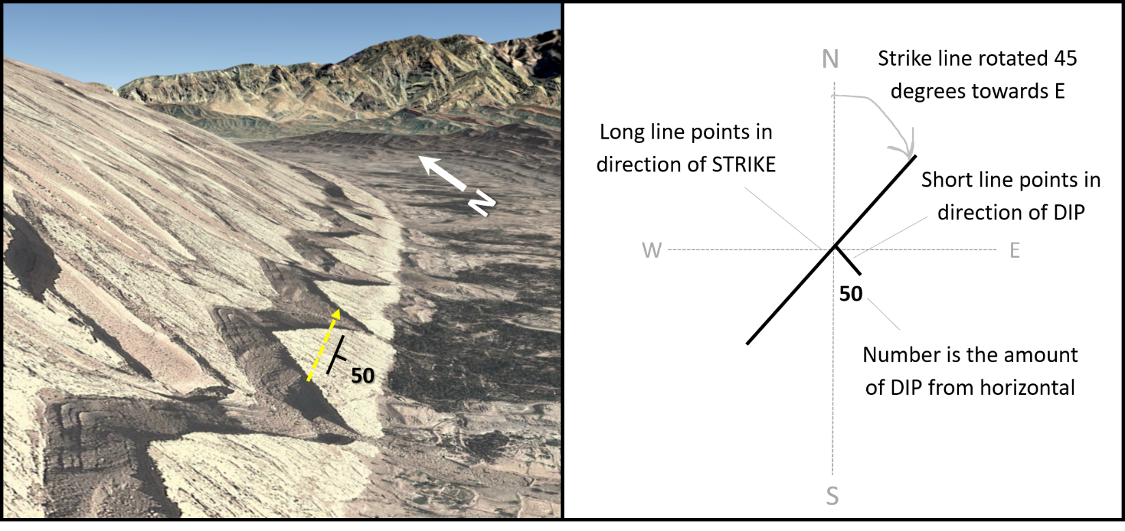
Recall that the symbol for strike and dip is given along the top of the block, as shown in Figure 16.6. Note that the dip symbol (shorter line) is perpendicular to the strike symbol; dip degree (number) will vary depending on measurements.
Strike and Dip Measurement
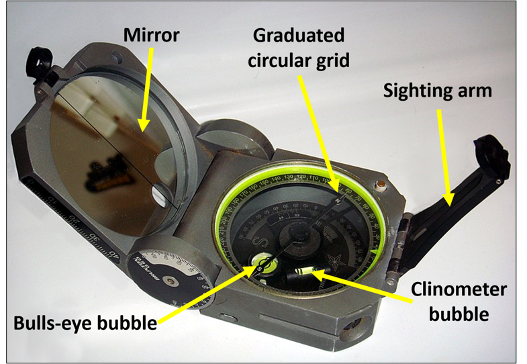
Geologists typically use a Brunton compass to measure strike and dip (Figure 16.7). Strike is measured along the plane by using the leveling bubble on the compass. Dip is measured by laying the side of the compass perpendicular to the strike measurement and rotating the horizontal level until the bubble is stable and the reading has been made.
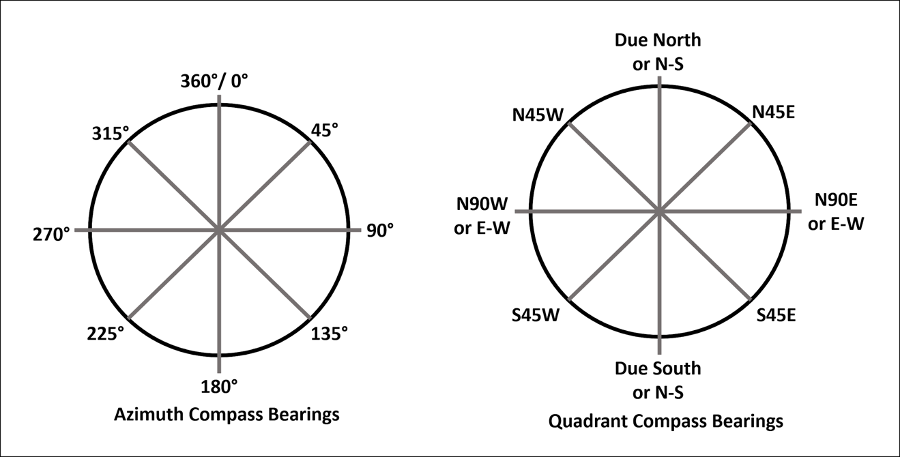
Recording strike and dip can be done using two different systems, the Azimuth System or the Quadrant System (Figure 16.8), and the choice between the two is dependent on the geologist, location, or organization for which the data is collected or produced. A strike can be given as a quadrant compass bearing of the strike line (N25E for example) or using a single three-digit number representing the azimuth, where the lower number is usually given. In our example of N25E, the azimuth reading would be 025° (see Table 16.2 for other examples.) Some students will find they prefer one system over the other. This is typically a personal decision; however, many geologists (and geology majors) find it important to know both systems, as they may be asked to use both over the course of their career.
| System | Strike & Dip | Description |
|---|---|---|
| Quadrant | N50W, 78NE | -- |
| N70E, 30SE | -- | |
| N90W, 33N | Strike direction, due west. Dip direction, due north. | |
| N70W, 90 | Vertical dips have no quadrant direction. | |
| Azimuth | 315, 78NE | -- |
| 70, 30S | -- | |
| 270, 33N | -- | |
| 290, 90 | -- |
How Do I Draw a Strike and Dip Symbol?
Using the quadrant system, a geologist measured the strike and dip of a rock layer as N35W, 30 NE. How can we draw a strike and dip symbol for this measurement?
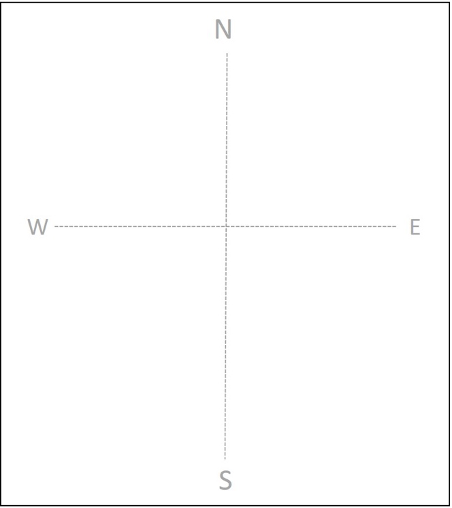
- Sketch a light grid on your paper, and label the directions, North, East, South, West (Figure 16.9).
- Using a protractor, place the small center hole or point over the place where you’ll draw the strike line, usually near the center of your grid. Lightly mark this location with a dot.
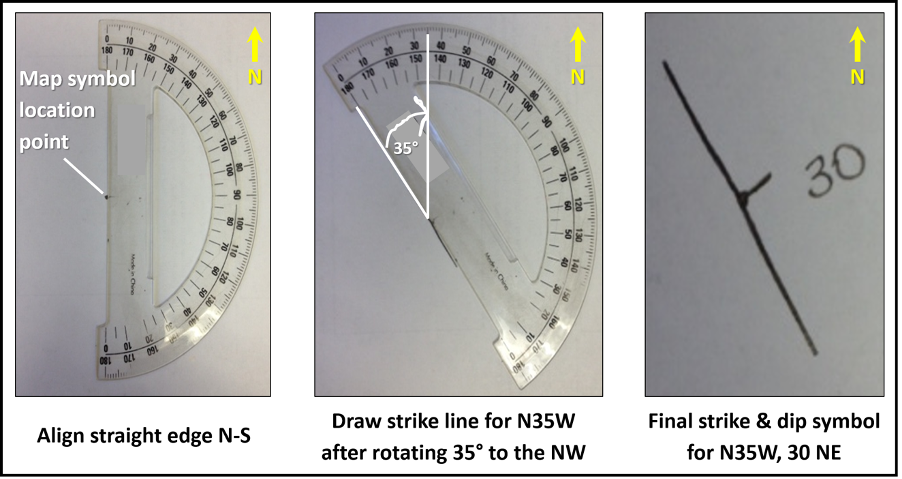
- Align the straight edge of the protractor so that it’s pointed due north, typically toward the top of the page. Since this quadrant measurement has a strike to the NW, place the protractor so that it makes the shape of a capital D. If you have a full 365° protractor, you do not need to be concerned with the overall shape. However, for both protractor types be sure 0° is towards the top of the page (Figure 16.10, left). Lightly mark the 0° point.
- Rotate the protractor 35° toward the west (to the left) until the 35° marking is aligned with true north. Be sure to read the outside numbers. Lightly mark the 35° point. The straight edge of the protractor is now aligned with a N35W strike.
- Lightly connect the marks you’ve previously made with a line along the straight edge of the protractor. To create a final strike line, darken about a centimeter or so of this line towards the center of your grid. This line is now the strike line for N35W (Figure 16.10, center).
- Now, the dip direction and measurement need to be added to complete the symbol. Determine the correct dip direction based on the measurement and the grid you’ve drawn. In this example, the dip is toward the NE, which is on the right side of the strike line. Remember, dip is perpendicular to strike. The dip line should be about 0.5 centimeter or less in length and should be perfectly straight and perpendicular from the strike line. Lastly, add the dip measurement, in this case 30°, typically this is written without a degree symbol (Figure 16.10, right).
Using the azimuth system, a geologist measured the strike and dip of a rock layer as 330°, 30 NE. How can we draw a strike and dip symbol for this measurement?
- Sketch a light grid on your paper, and label the directions, North, East, South, West (Figure 16.9).
- Using a full 365° protractor, place the small center hole or point over the place where you’ll draw the strike line, usually near the center of your grid. Lightly mark this location with a dot.
- Since we are now using the azimuth system, we need to measure 330° with our protractor. If you are using a half protractor, you will need to make a capital D again and subtract 330°from 365°. For both protractor types, be sure 0°/360° is towards the top of the page (Figure 16.11, left). Lightly mark the 0° point.
- Use the inside numbers to measure 330° with the full protractor. If you have the half-protractor, you must subtract 330° from 365° and then measure the resulting angle of 35° (rotate towards the west). Lightly mark this point. The straight edge of the protractor is now aligned with a 330° strike.
- Lightly connect the marks you’ve previously made with a line along the straight edge of the protractor. To create a final strike line, darken about a centimeter or so of this line towards the center of your grid. This line is now the strike line for 330° (Figure 16.11).
- Now, the dip direction and measurement need to be added to complete the symbol. Determine the correct dip direction based on the measurement and the grid you’ve drawn. In this example, the dip is toward the NE, which is on the right side of the strike line. Remember, dip is perpendicular to strike. The dip line should be about 0.5 centimeter or less in length and should be perfectly straight and perpendicular from the strike line. Lastly, add the dip measurement, in this case 30°, typically this is written without a degree symbol (Figure 16.11, right).
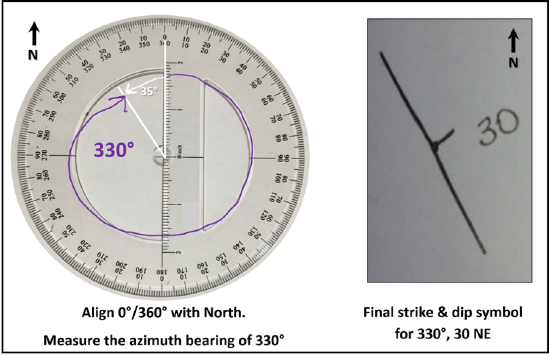
Figure 16.11: How to use a protractor to measure strike and dip using the azimuth system.
Attributions
- Figure 16.1: Derivative of “Geologic Map and Map Database of the Metropolitan Area, Alameda, Contra Costa, and San Francisco Counties, California” (Public Domain; R.W. Gramer/USGS) by Chloe Branciforte
- Figure 16.2: Figure 15.20: Derivative of “Geologic Map and Map Database of the Metropolitan Area, Alameda, Contra Costa, and San Francisco Counties, California” (Public Domain; R.W. Gramer/USGS) by Chloe Branciforte
- Figure 16.3: Derivative of “Geologic Map of the Telegraph Peak 7.5’ Quadrangle, San Bernardino County, California” (Public Domain; D.M Morton, M.O Woodburne, and J.H. Foster/USGS) by Chloe Branciforte
- Table 16.1: “Geologic Age Symbols” (CC-BY; Chloe Branciforte, own work)
- Table 16.2: “Geologic Map Symbols” (CC-BY; Chloe Branciforte, own work)
- Figure 16.4: Derivative of “Geologic Map and Map Database of the Metropolitan Area, Alameda, Contra Costa, and San Francisco Counties, California” (Public Domain; R.W. Gramer/USGS) by Chloe Branciforte
- Figure 16.5: Derivative of “Geologic Map to Cross-section” (CC-BY-SA 3.0; Randa Harris via LibreText) by Chloe Branciforte
- Figure 16.6: “Strike and Dip” (CC-BY 4.0; Chloe Branciforte via Google Earth, own work)
- Figure 16.7: Derivative of “Brunton” (CC-BY-SA 3.0; Matt Affolter (QFL247) via Wikimedia Commons) by Chloe Branciforte
- Figure 16.8: “Azimuth and Quadrant Compass Bearings” (CC-BY; Chloe Branciforte, own work)
- Table 16.3: “Compass Systems” (CC-BY; Chloe Branciforte, own work)
- Figure 16.9: “Grid” (CC-BY; Chloe Branciforte, own work)
- Figure 16.10: “180 protractor and Strike and Dip” (CC-BY; Chloe Branciforte, own work)
- Figure 16.11: “365 protractor and Strike and Dip” (CC-BY; Chloe Branciforte, own work)